Abstract
Background and Purpose
The human kinome consists of roughly 500 kinases, including 150 that have been proposed as therapeutic targets. Protein kinases regulate an array of signalling pathways that control metabolism, cell cycle progression, cell death, differentiation and survival. It is not surprising, then, that new kinase inhibitors developed to treat cancer, including sorafenib, also exhibit cardiotoxicity. We hypothesized that sorafenib cardiotoxicity is related to its deleterious effects on specific cardiac metabolic pathways given the critical roles of protein kinases in cardiac metabolism.
Experimental Approach
FVB/N mice (10 per group) were challenged with sorafenib or vehicle control daily for 2 weeks. Echocardiographic assessment of the heart identified systolic dysfunction consistent with cardiotoxicity in sorafenib‐treated mice compared to vehicle‐treated controls. Heart, skeletal muscle, liver and plasma were flash frozen and prepped for non‐targeted GC–MS metabolomics analysis.
Key Results
Compared to vehicle‐treated controls, sorafenib‐treated hearts exhibited significant alterations in 11 metabolites, including markedly altered taurine/hypotaurine metabolism (25‐fold enrichment), identified by pathway enrichment analysis.
Conclusions and Implications
These studies identified alterations in taurine/hypotaurine metabolism in the hearts and skeletal muscles of mice treated with sorafenib. Interventions that rescue or prevent these sorafenib‐induced changes, such as taurine supplementation, may be helpful in attenuating sorafenib‐induced cardiac injury.
Abbreviations
- PLS‐DA
partial least squares discriminant analysis
Introduction
Sorafenib is a kinase inhibitor (KI) used for the treatment of advanced renal cell carcinoma, hepatocellular carcinoma and radioactive iodine resistant thyroid carcinoma. Sorafenib inhibits multiple tyrosine kinases, including VEGFR, PDGFR and Raf family kinases (c‐Raf >B‐Raf) (Wilhelm et al., 2008; Keating and Santoro, 2009; Smalley et al., 2009). Sorafenib generally is well tolerated at the target dose of 400 mg twice daily; the most common adverse effects are diarrhoea, nausea, hand‐and‐foot skin reaction and rash (Karovic et al., 2016; Kudo et al., 2016). Less commonly, sorafenib is complicated by cardiovascular toxicity or liver failure, either of which requires cessation of therapy.
A recently published meta‐analysis of cardiovascular toxicity from randomized clinical trials of targeted cancer therapy drugs(Escalante et al., 2016) linked sorafenib with a significantly increased risk of all‐grade decreased left ventricular ejection fraction. Sorafenib also has been associated with a significantly increased risk of myocardial infarction (MI) in one study (Duran et al., 2014) and in all‐grade and high‐grade hypertension (Escalante et al., 2016). The underlying mechanisms of these cardiovascular toxicities are not clear (Hall et al., 2013).
Recent studies of 31 small‐molecule KIs approved for use in humans as of November 2016 found that sorafenib was one of three KIs that were hepatotoxic at concentrations equal to the Cmax and indicated that mitochondrial toxicity was likely contributing to the liver toxicity (Zhang et al., 2017). Treating animals with sorafenib decreases body weight, an effect also reported in humans, suggesting that sorafenib treatment may lead to fundamental alterations in metabolism (Duran et al., 2014; Kuczynski et al., 2015). The broader metabolomic effects of sorafenib on tumour‐free tissue have not been investigated.
In the present study, mice were treated with sorafenib for 2 weeks. Heart, liver, skeletal muscle and plasma were analysed using a non‐targeted metabolomics approach to discover the metabolic effects of sorafenib that may contribute to its heart and liver toxicity.
Methods
Animals, experimental design, drug delivery and harvest
Mice were 10‐week‐old FVB/N females. They were fed the usual animal care diet per the UNC Animal Care facility and were gavaged daily with sorafenib 30 mg·kg−1·day−1 (Selleck Chemicals, LLC, Cat. #S7397) or vehicle by UNC Lineberger Animal Models Core staff. Sorafenib was dissolved in DMSO, then diluted in purified water. Final gavage volumes were 200 μL (40 μL DMSO + 160 μL water in both sorafenib and vehicle groups) for a 20 g mouse. At baseline and on Day 14, five mice from each group underwent conscious echocardiography as previously described (Quintana et al., 2016; Wadosky et al., 2016). On Day 14, mice were deeply anaesthetized with isoflurane and blood was collected by retro‐orbital eyebleed (~200 μL) into purple‐top paediatric plasma collection tubes. Mice were then killed by cervical dislocation. The heart (after a cold PBS flush and excision of atria and great vessels), skeletal muscle (quadriceps femoris) and liver were blotted for excess moisture and snap frozen immediately in liquid nitrogen. Blood was centrifuged within 30 min at 2000× g for 10 min. Plasma was then transferred into Eppendorf tubes, which were stored immediately at −80°C. Animal studies are reported in compliance with the ARRIVE guidelines (Kilkenny et al., 2010; McGrath and Lilley, 2015).
Histological analysis
Flash frozen liver and quadriceps femoris muscle were placed in O.C.T. compound (Tissue‐Tek®; Sakura Finetek USA, Inc., Torrance, CA, USA) and immediately frozen with dry ice and processed for frozen sections onto glass slides, which were stained with H&E using standard methods. Slides were then scanned on a Leica Aperio VERSA ScanScope XT epifluorescent microscope digital scanner (DM6000 B, Leica) at 20× with an Andor Zyla sCMOS camera and were visualized/analysed using Aperio ImageScope (Version 12.1.0.5029; Leica Biosystems, Buffalo Grove, IL, USA), including export of TIFF images used in publication. Three biological replicates from each treatment (vehicle or sorafenib) from the liver, heart and quadriceps femoris were evaluated (18 total biological replicates), each with three sections per biological replicate (54 sections in total).
Non‐targeted metabolomics determination by GC–MS instrumentation
Previously flash‐frozen heart, skeletal muscle and liver were weighed (25–50 mg wet weight), then placed in buffer (50% acetyl‐nitrile, 50% water and 0.3% formic acid) at a standard concentration of 25 mg·(475 μL)−1 buffer then fully homogenized on ice for 10–25 s and placed on dry ice/stored at −80°C. The resulting tissues in buffer and sera samples were then analysed by GC/MS, as described previously (Banerjee et al., 2015; Quintana et al., 2016). The raw, transformed and sorted data used for each of the three comparisons in the metabolomics analyses can be found in Supporting Information Table S1. The data obtained in this study are accessible at the NIH Common Fund's Data Repository and Coordinating Centre (supported by NIH grant, U01‐DK097430) website, http://www.metabolomicsworkbench.org.
Metabolomic statistical analyses
Metaboanalyst (v3.0) run on the statistical package R (v2.14.0) used metabolite peak areas (as representative of concentration) (Xia et al., 2009, 2015). These data were scaled using the Pareto scaling feature. To detect a systemic metabolic signature of sorafenib treatment, a t‐test was performed using Metaboanalyst v3.0. T‐test significant metabolites [false discovery rate (FDR) < 0.05] were matched to metabolomics pathways using the Pathway Analysis and enrichment analysis features in Metaboanalyst 3.0. Only metabolites identified and detected in all groups were included in the statistical analysis. For sorafenib heart and skeletal muscle samples, up to two missing values (of 10 total) were imputed; for liver and plasma, up to three missing values (of 10 total) were imputed with the group's minimum value. If more values were missing, the analyte was not included in the statistical analysis. All data from this study are available in Supporting Information Table S1. All data are shown as mean ± SEM, unless otherwise indicated.
Other statistical analysis
The data and statistical analysis comply with the recommendations on experimental design and analysis in pharmacology (Curtis et al., 2015). All data are shown as mean ± SEM, unless otherwise indicated. Differences between controls and drug‐treated groups were compared using Student's t‐test in Microsoft Excel®.
Nomenclature of targets and ligands
Key protein targets and ligands in this article are hyperlinked to corresponding entries in http://www.guidetopharmacology.org, the common portal for data from the IUPHAR/BPS Guide to PHARMACOLOGY (Southan et al., 2016), and are permanently archived in the Concise Guide to PHARMACOLOGY 2015/16 (Alexander et al., 2015).
Results
Sorafenib is administered p.o. at 400 mg twice daily for renal cell carcinoma, hepatocellular carcinoma and thyroid cancer, resulting in a mean plasma concentration of 121.7 μmL·L−1·h−1 (Clark et al., 2005). This concentration is within the range observed for mouse plasma at efficacious doses of 10 mg·kg−1 (62 μmol·L−1·h−1) and 30 mg·kg−1 (210 μmol·L−1·h−1) (Chowbay et al., 2006; Liu et al., 2006; Chang et al., 2007; Wilhelm et al., 2008), though doses up to 100 mg·kg−1·day−1 were tolerated without increased mortality or excess weight loss in a rodent model of hepatocellular carcinoma (Wilhelm et al., 2008). Based on these reports, we chose to gavage FVB/N mice with 30 mg·kg−1 daily for 2 weeks to model therapeutic sorafenib levels in humans undergoing cancer therapy.
Echocardiographic analysis of mice treated daily with sorafenib for 2 weeks revealed a decrease in systolic cardiac function compared to age‐matched vehicle‐treated mice, evidenced by significant decreases in fractional shortening (FS%) (Figure 1). The complementary complete echocardiographic analysis consistent with this defect is found in Table 1. Body weight was unchanged by either vehicle or sorafenib treatment (Table 2).
Figure 1.
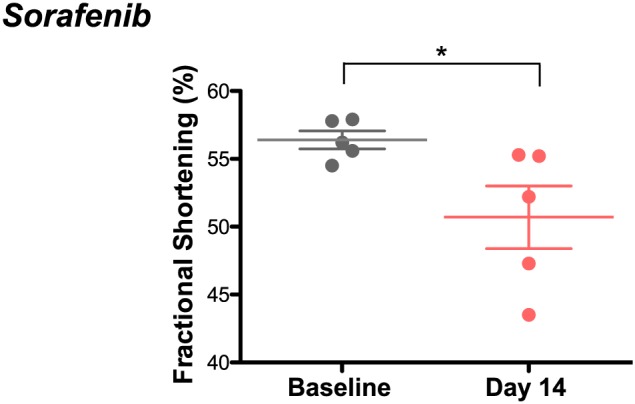
Sorafenib induces cardiac systolic dysfunction in mice after 2 weeks of treatment. Conscious echocardiography showed a fractional shortening of 56 ± 1% at baseline and 50 ± 2% after treatment. n = 5 per group. *P < 0.05.
Table 1.
Echocardiographic parameters after vehicle or sorafenib treatment
| HR | LVIDd | LVIDs | FS | LVd vol | LVs vol | IVSd | PWd | LV mass | |
|---|---|---|---|---|---|---|---|---|---|
|
Vehicle (5)
Day 0 |
674 ± 9 | 2.6 ± 0.1 | 1.1 ± 0 | 58 ± 2 | 25 ± 2 | 3 ± 0 | 0.9 ± 0 | 1.0 ± 0 | 82 ± 1 |
| Day 14 | 687 ± 8 | 2.8 ± 0.1 | 1.2 ± 0.1 | 57 ± 1 | 29 ± 2 | 3 ± 0 | 1.0 ± 0.1 | 1.0 ± 0 | 85 ± 5 |
|
Sorafenib (5)
Day 0 |
648 ± 17 | 2.7 ± 0.1 | 1.1 ± 0.1 | 56 ± 1 | 26 ± 2 | 3 ± 1 | 1.0 ± 0 | 0.9 ± 0 | 76 ± 4 |
| Day 14 | 694 ± 15 | 2.7 ± 0.1 | 1.3 ± 0.1 | 50 ± 2* | 28 ± 2 | 5 ± 0 | 1.0 ± 0 | 0.9 ± 0 | 88 ± 3a |
Echocardiography was performed on unanaesthetized mice. Values represent mean ± SEM. Two‐tailed t‐tests compared Days 0 and 14 weights within vehicle and sorafenib‐treated groups.
P < 0.05 versus Dox + vehicle.
FS, fractional shortening (%); HR, heart rate (beats.min‐1); IVSd, interventricular septal thickness, diastole (mm); LVd vol, left ventricular diastolic volume (mL); LVs vol, left ventricular systolic volume (mL); LVIDd, left ventricular internal diameter, diastole (cm); LVIDs, left ventricular internal diameter, systole (cm); LVm, LV mass, calculated; PWd, posterior wall, diastole (mm).
Table 2.
Body weights after vehicle or sorafenib treatment
| Treatment (n) | Body weight, initial (g) | Body weight, Day 7 (g) | Body weight, Day 14 (g) |
|---|---|---|---|
| Vehicle (10) | 21.6 ± 0.3 | 21.2 ± 0.4 | 21.4 ± 0.5 |
| Sorafenib 30 mg·kg−1·day−1 (10) | 21.4 ± 0.3 | 20.4 ± 0.4 | 20.7 ± 0.4 |
Values represent mean ± SEM. Biological replicates (n) are presented in parentheses. Two‐tailed t‐tests compared initial and Day 14 weights within vehicle‐ and sorafenib‐treated groups. P = not significant for all comparisons.
Since sorafenib causes cardiotoxicity necessitating drug discontinuation in some patients (Schmidinger et al., 2008; Hall et al., 2013; Escalante et al., 2016), as well as liver toxicity associated with mitochondrial dysfunction in rodents (Zhang et al., 2017), we applied a non‐targeted metabolomics analysis using GC/MS to both the heart and liver after 2 weeks of treatment that induced cardiac toxicity (Figure 2). We assayed skeletal muscle (quadriceps femoris) and plasma collected in parallel to identify if myocardium and striated muscle metabolism are affected similarly and if any of these observed alterations could be monitored by any biomarkers in the plasma.
Figure 2.
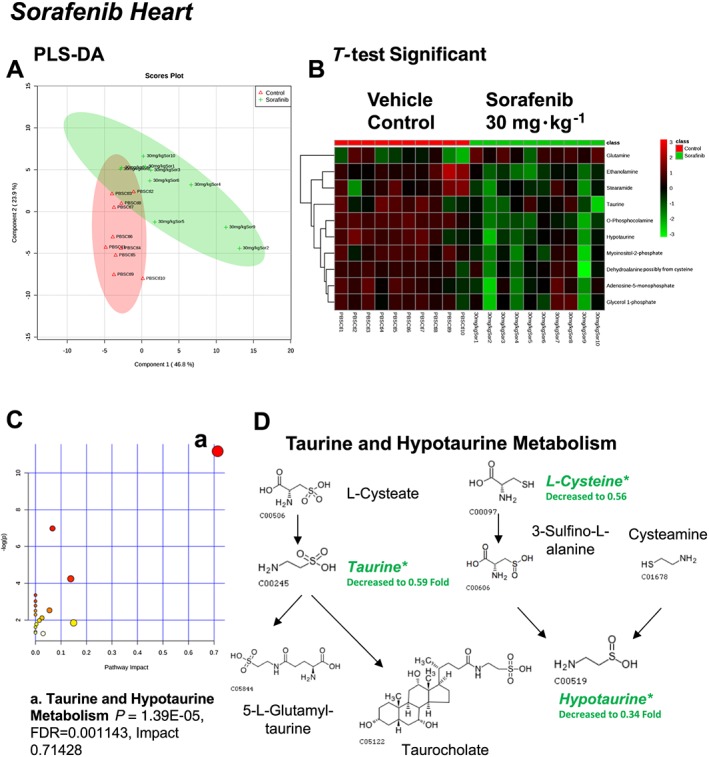
Analysis of non‐targeted metabolomics of heart from sorafenib‐treated mice compared to vehicle‐treated mice. (A) PLS‐DA of heart metabolites from sorafenib‐treated mice compared to vehicle control mice plotted on two principal components. (B) Heatmap of significant (as assessed by t‐test) metabolites in hearts from sorafenib‐treated mice. (C) Pathway analysis of significant metabolites. (D) Overview of taurine and hypotaurine metabolism and the context of the significant metabolites identified in sorafenib‐treated hearts.
A total of 84 named metabolites were identified in the heart (Supporting Information Figure S1 and Supporting Information Table S1). The initial analysis of these metabolites using a partial least squares discriminant analysis (PLS‐DA) demonstrated a component 1 accounting for 46.8% and a component 2 accounting for 23.9% of the distinct differences between groups (Figure 2A). Ten metabolites were significantly different in the sorafenib‐treated hearts (Figure 2B). Nine of the 10 metabolites were significantly decreased; only glutamine was increased compared to vehicle‐treated control hearts (Figure 2B). Pathway analysis of these 10 metabolites indicated that three are involved in taurine and hypotaurine metabolism (Figure 2C; P = 1.39E‐05, FDR = 0.001), including taurine, hypotaurine and L‐cysteine (Figure 2D). Means and standard errors for significantly altered metabolites are presented in Figure 3.
Figure 3.
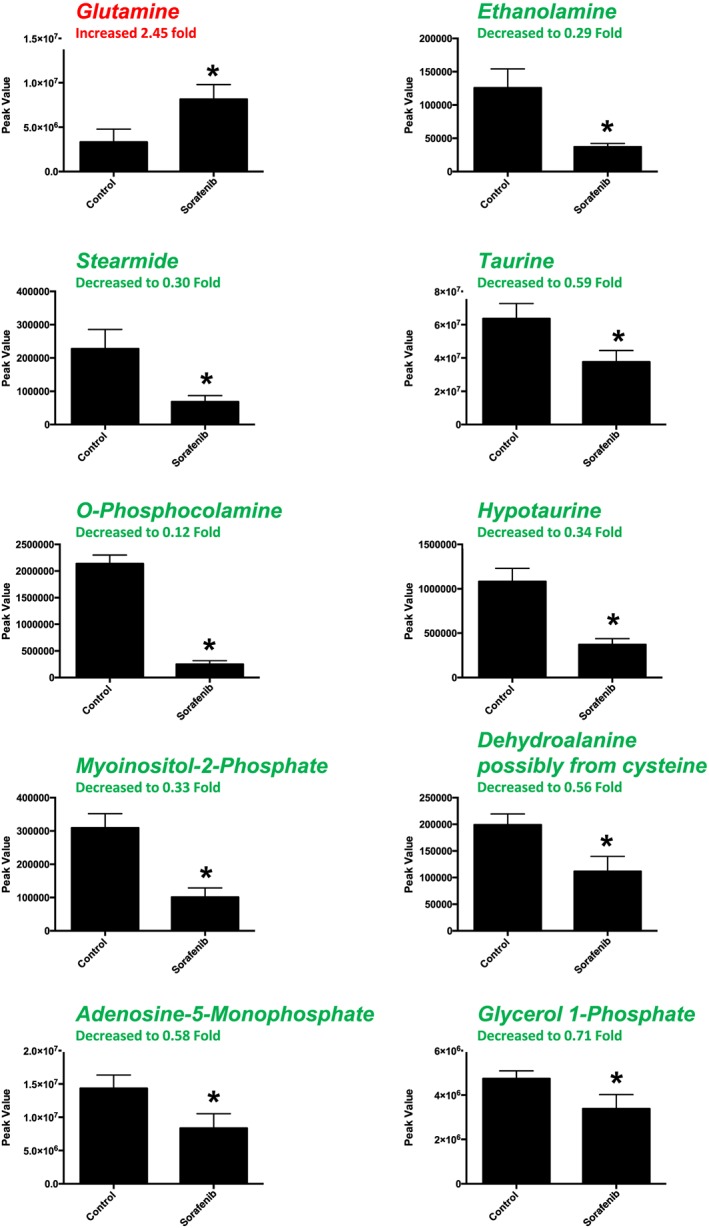
Significant metabolites (as assessed by t‐test) in sorafenib‐treated mouse heart. Nine of the 10 significant metabolites did not have any inputted data points. Stearimide had 1 value imputed (in the sorafenib‐treated group) as detailed in Supporting Information Figure S1. Data represent mean ± SEM. n = 10 per group. *P < 0.05.
A total of 88 named metabolites were identified in the liver (Supporting Information Figure S2 and Supporting Information Table S1). The initial analysis of these metabolites using a PLS‐DA demonstrated a component 1 accounting for 19.6% and a component 2 accounting for 10.6% of the distinct differences between groups (Figure 4A). Fourteen metabolites were significantly different in the sorafenib‐treated livers (Figure 4B). Of these, 13 of the 14 metabolites were significantly decreased, with the exception of proline, which was increased compared to vehicle control livers (Figure 4B). Pathway analysis of these 14 metabolites identified three significantly affected metabolic pathways, including phenylalanine, tyrosine and tryptophan biosynthesis (P = 0.03); Synthesis and degradation of ketone bodies (P = 0.048); and butanoate metabolism (P = 0.016) (Figure 4C). These pathway effects were identified largely due to decreases in tyrosine, acetoacetate and succinate (Figure 4D). Means and standard errors for significantly altered metabolites are presented in Figure 5.
Figure 4.
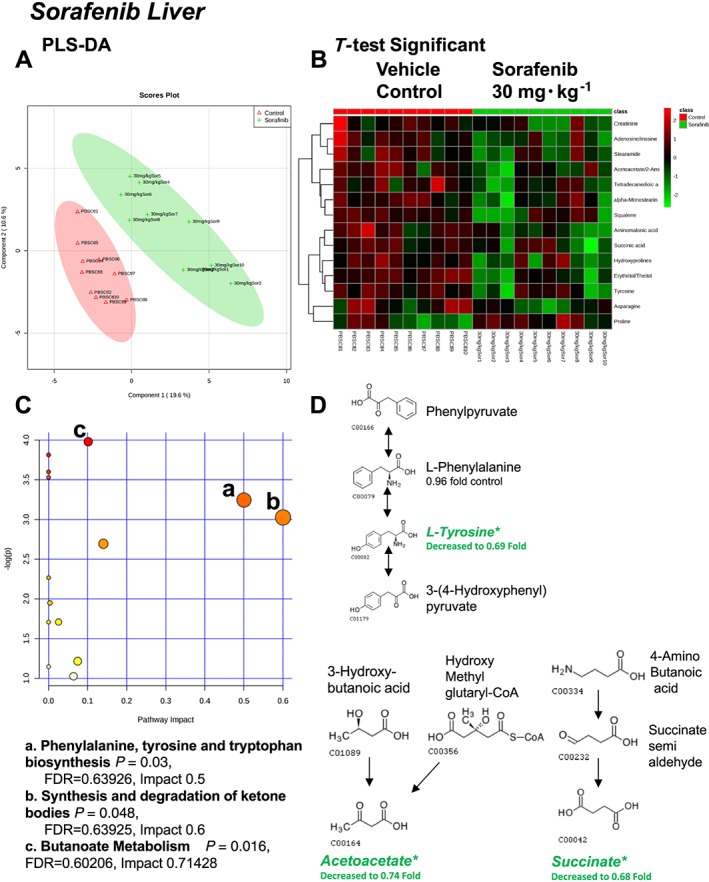
Analysis of non‐targeted metabolomics of liver from sorafenib‐treated mice compared to vehicle‐treated mice. (A) PLS‐DA of liver metabolites from sorafenib‐treated mice compared to vehicle control mice plotted on two principal components. (B) Heatmap of significant (as assessed by t‐test) metabolites in livers from sorafenib‐treated mice. (C) Pathway analysis of significant metabolites. (D) Overview of phenylalanine, tyrosine and tryptophan biosynthesis, synthesis/degradation of ketone bodies and butanoate metabolism and the context of the significant metabolites identified in sorafenib‐treated livers.
Figure 5.
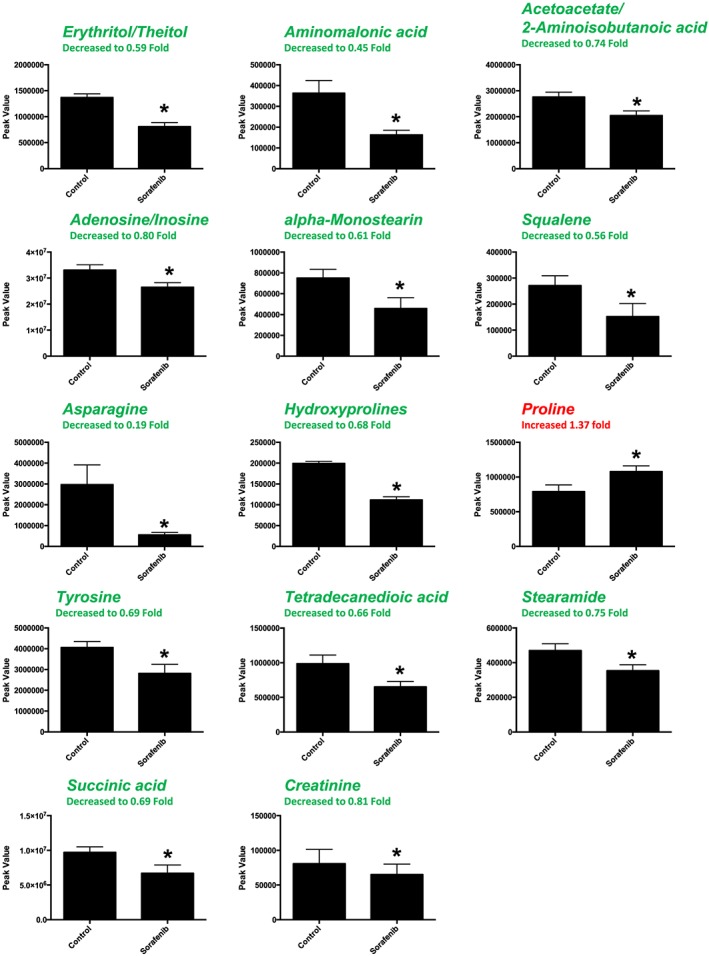
Significant (as assessed by t‐test) metabolites in sorafenib‐treated mouse liver. Nine of the 14 significant metabolites had any imputed data points. As detailed in Supporting Information Figure S1, the imputed values (#, group) for the remaining metabolites were as follows: squalene (3, sorafenib), asparagine (1, sorafenib), hydroxyprolines (3, control; 1, sorafenib), proline (1, control) and creatine (2, sorafenib). Data represent mean ± SEM. n = 10 per group. *P < 0.05.
A total of 82 named metabolites were identified in skeletal muscle (quadriceps femoris) (Supporting Information Figure S3 and Supporting Information Table S1). The initial analysis of these metabolites using a PLS‐DA demonstrated a component 1 accounting for 43.1% and a component 2 accounting for 13.6% of the distinct differences between groups (Figure 6A). Five metabolites were significantly different in the sorafenib‐treated skeletal muscle (Figure 6B). Pathway analysis of these five metabolites identified two significantly affected metabolic pathways, including taurine and hypotaurine metabolism (P = 5.7E‐4, FDR = 0.047) and cysteine and methionine metabolism (P = 6.9E‐4, FDR = 0.28) j(Figure 6C). These pathway effects were identified largely due to decreases in cysteine, hypotaurine and dehydroalanine (Figure 6D). All five significantly altered metabolites in sorafenib‐treated skeletal muscle were decreased (Figure 7).
Figure 6.
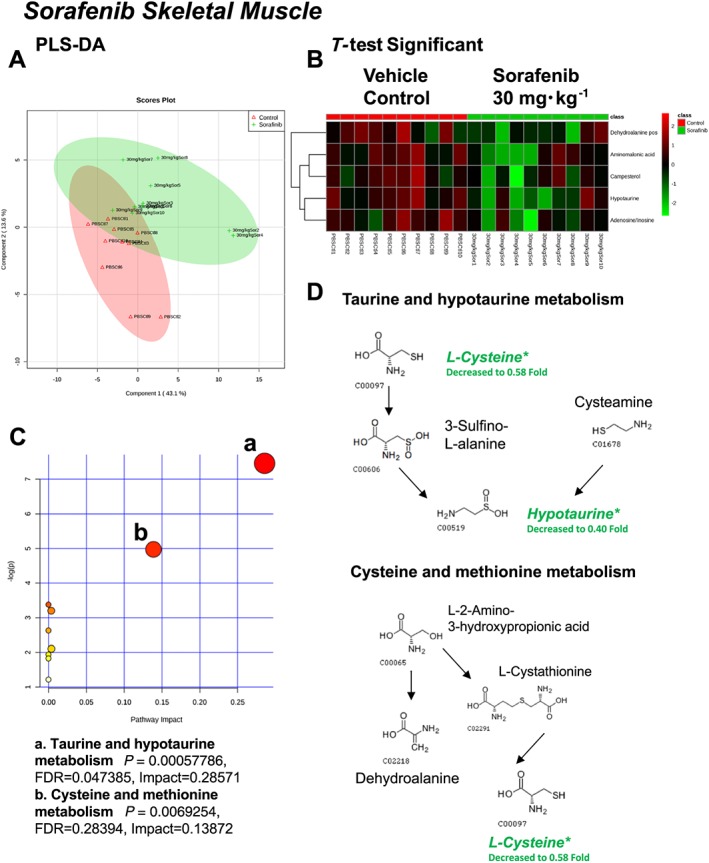
Analysis of non‐targeted metabolomics of skeletal muscle (quadriceps femoris) from sorafenib‐treated mice compared to vehicle‐treated mice. (A) PLS‐DA of skeletal muscle metabolites from sorafenib‐treated mice compared to vehicle control mice plotted on two principal components. (B) Heatmap of significant (as assessed by t‐test) metabolites in skeletal muscles from sorafenib‐treated mice. (C) Pathway analysis of significant metabolites. (D) Overview of taurine and hypotaurine metabolism, cysteine and methionine metabolism and the context of the significant metabolites identified in sorafenib‐treated skeletal muscles.
Figure 7.
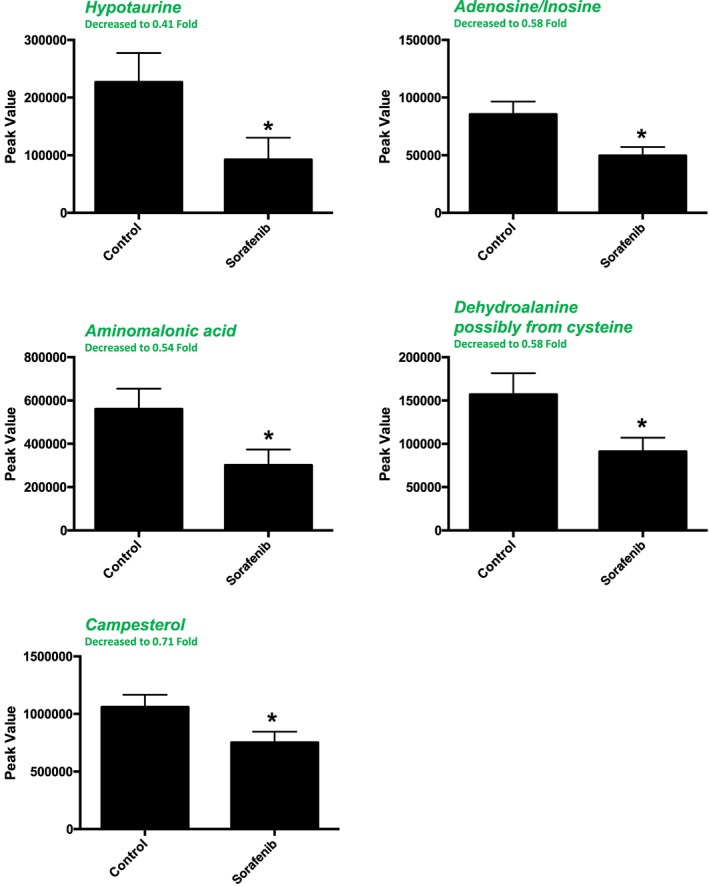
Significant (as assessed by t‐test) metabolites in sorafenib‐treated mouse skeletal muscle (quadriceps femoris). Two of the 5 significant metabolites did not have any imputed data points. As detailed in Supporting Information Figure S1, the imputed values (#, group) for the remaining metabolites were as follows: hypotaurine (1, control; 2, sorafenib), aminomalonic acid (2, control; 2, sorafenib) and dehydroalanine (1, sorafenib). Data represent mean ± SEM. n = 10 per group. *P < 0.05.
A total of 84 named metabolites were identified in plasma (Supporting Information Figure S4 and Supporting Information Table S1). The initial analysis of these metabolites using a PLS‐DA demonstrated a component 1 accounting for 25.4% and a component 2 accounting for 24.1% of the distinct differences between groups (Figure 8A). Four metabolites were significantly different (all decreased) in the sorafenib‐treated plasma compared to vehicle controls (Figure 8B). Pathway analysis of these metabolites identified two affected metabolic pathways, including the citrate cycle (P = 0.028, FDR = 0.88043) and glyoxylate and dicarboxylate metabolism (P = 0.025, FDR = 0.88043) (Figure 8C). Both pathways were identified through differential abundance of only one metabolite (malate) (Figure 8D). All four significantly altered metabolites in sorafenib‐treated plasma were decreased (Figure 9).
Figure 8.
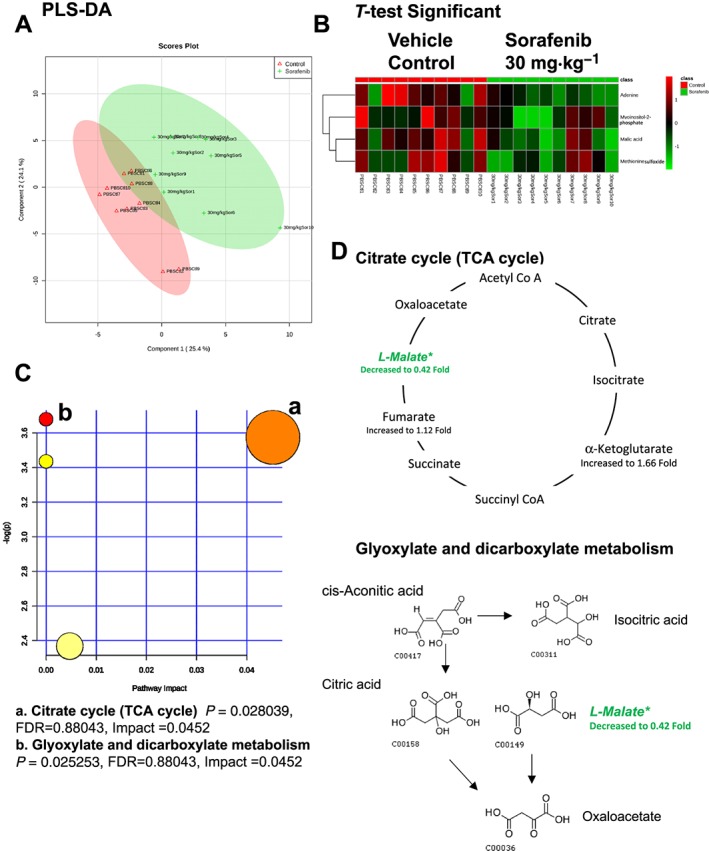
Analysis of non‐targeted metabolomics of plasma from sorafenib‐treated mice compared to vehicle‐treated mice. (A) PLS‐DA of plasma metabolites from sorafenib‐treated mice compared to vehicle control mice plotted on two principal components. (B) Heatmap of significant (as assessed by t‐test) metabolites in plasma from sorafenib‐treated mice. (C) Pathway analysis of significant metabolites. (D) Overview of the citrate cycle, the glyoxylated and dicarboxylate metabolism and the context of the significant metabolites identified in sorafenib‐treated plasma.
Figure 9.
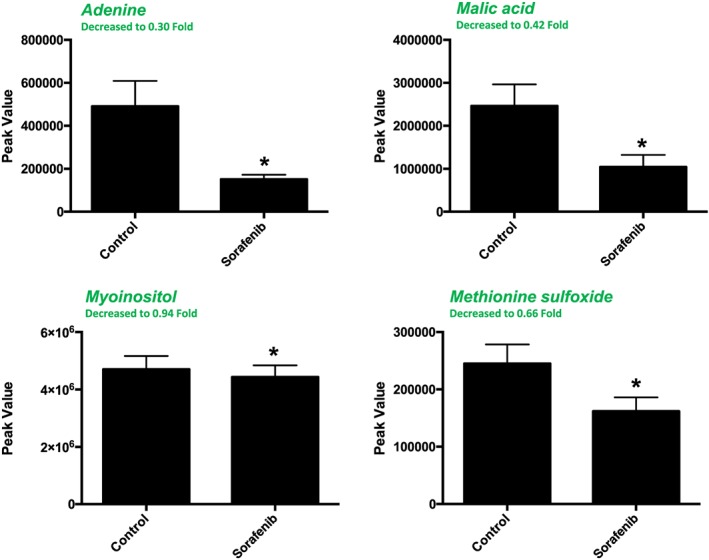
Significant (as assessed by t‐test) metabolites in sorafenib‐treated mouse plasma. One of the 4 significant metabolites did not have any imputed data points. As detailed in Supporting Information Figure S1, the imputed values (#, group) for the remaining metabolites were as follows: adenine (1, control; 2, sorafenib), malic acid (1, control; 1, sorafenib) and methionine sulfoxide (3, control; 3, sorafenib). Data represent mean + SEM. n = 10 per group. *P < 0.05.
In additional enrichment analyses across tissues, the metabolic pathways with the highest fold enrichment (~30‐fold) and lowest P values (P = 4E‐05 to 1E‐03) were taurine and hypotaurine metabolism (heart and muscle) and the malate–aspartate shuttle (plasma) in the sorafenib‐treated animals compared to vehicle‐treated controls (Supporting Information Figure S5). Across the heart, liver, skeletal muscle and plasma, four metabolites were significantly altered in two or more compartments (Table 3): Adenosine/inosine [adenine, adenosine‐5‐monophosphate (AMP)], dehydroalanine (possibly from cysteine), hypotaurine, myoinositol‐2‐phosphate and animomalonic acid.
Table 3.
Significant metabolites in sorafenib treated tissues compared to vehicle treated (control) tissues
| Heart | Liver | Skeletal Muscle | Serum |
|---|---|---|---|
| AMP | Acetoacetate/2‐Aminoisobutanoic acid | Adenosine/Inosine | Adenine |
| Dehydroalanine possibly from cysteine | Adenosine/Inosine | Aminomalonic acid | Malic acid |
| Ethanolamine | α‐Monostearin | Campesterol | Methionine sulfoxide |
| Glutamine | Aminomalonic acid | Dehydroalanine possibly from cysteine | Myoinositol‐2‐phosphate |
| Glycerol‐1‐phosphate | Asparagine | Hypotaurine | |
| Hypotaurine | Creatinine | ||
| Myoinositol‐2‐phosphate | Erythritol/Theitol | ||
| O‐Phosphocolamine | Hydroxyprolines | ||
| Stearamide | Proline | ||
| Taurine | Squalene | ||
| Stearamide | |||
| Succinic acid | |||
| Tetradecanedioic acid | |||
| Tyrosine |
Colour‐matched metabolites are highlighted if they (or they and closely related metabolites) were found in two or more tissues.
For further evaluation of potential sorafenib‐induced tissue injury, histological analyses of liver and skeletal muscle were performed on a subset of the source frozen tissues used in these metabolomics studies above. Frozen liver sections were cut and stained with H&E, and trichrome did not reveal any differences between sorafenib‐treated and vehicle‐treated animals, with sporadic lymphocytes scattered routinely in the parenchyma (Supporting Information Figures S6A and S7), without changes in collagen deposition (Supporting Information Figure S6B). No histological differences were noted in sorafenib‐treated skeletal muscle (Supporting Information Figure S8).
Discussion
Sorafenib is a KI that targets multiple kinases, including VEGFR, PDGFR, c‐Raf (Raf‐1)/B‐Raf, c‐Kit and FLT3 and is used to treat patients with advanced renal cell carcinoma, hepatocellular carcinoma and radioactive iodine resistant thyroid carcinoma (Wilhelm et al., 2008; Keating and Santoro, 2009; Smalley et al., 2009). Sorafenib can be associated with multiple severe adverse cardiovascular effects, including MI and heart failure, (Escalante et al., 2016), but the underlying mechanisms of these toxicities are not known. In the present study, we identify decreased myocardial function coupled with numerous metabolic changes found in the heart, liver, skeletal muscle and plasma of mice treated with clinically relevant sorafenib doses (Figure 1). The taurine and hypotaurine metabolic pathway was affected in both the heart and skeletal muscle, with significant decreases in hypotaurine and taurine abundance (Figures 2D and 6D). Since skeletal muscle and the heart share many biologically relevant characteristics, these alterations may highlight general metabolic effects of sorafenib on muscle tissue. In contrast, liver and plasma did not reveal alterations in the taurine/hypotaurine metabolites.
Taurine is an organic compound (amino acid) that is widely distributed in mammalian tissues. It is the most abundant free amino acid in the heart, skeletal muscle, retina, brain and leukocytes, reaching concentrations of 50 mM in leukocytes (Schuller‐Levis and Park, 2003). Though taurine differs from most amino acids as it is not incorporated into proteins, it plays diverse roles in the cell, regulating cellular volume, antioxidant stress, protein stabilization, stress responses and neuromodulation (Warskulat et al., 2007). Taurine is protective in oxidant‐induced injury, possibly due to its ability to react with hypochlorous acid to produce a less toxic and more stable taurine chloramine (Schuller‐Levis and Park, 2003).
As early as 1988, taurine was shown to reduce doxorubicin‐induced cardiotoxicity in mice: taurine treatment after a single doxorubicin challenge (15 mg·kg−1) attenuated doxorubicin‐induced elevations of creatine phosphokinase, glutamic oxaloacetic transaminase and LDH (Hamaguchi et al., 1988). Oral taurine (3% w.v‐1 in water) later was shown to reduce doxorubicin‐induced oxidative stress (determined by cardiac glutathione content) and decrease mortality in both acute and sub‐acute doxorubicin treatment (Ito et al., 2009). Taurine‐induced cardioprotection against doxorubicin has been attributed to the activation of pro‐survival signalling including PI3K/Akt, which inhibits p53, JNK, p38 and NF‐kB (Das et al., 2011).
Mice lacking the taurine transporter have reduced exercise capacity and develop progressive age‐dependent heart failure as well as cellular necrosis in skeletal muscle (Azuma et al., 1985; Ito et al., 2010; Beyranvand et al., 2011). Cardiac taurine depletion directly alters the calcium sensitivity of myofibrillar proteins, through impaired sarcoplasmic reticulum calcium ATPase activity and reduced phospholamban phosphorylation. Collectively, these defects yield abnormalities in both systolic and diastolic function (Ramila et al., 2015). Taurine also acts to attenuate the detrimental effects of catecholamines and angiotensin II in heart failure (Ito et al., 2014). Of particular relevance to the current findings, metabolomic analysis of a rat model of myocardial infarction identified taurine/hypotaurine metabolism as one of five uniquely altered pathways. (Liu et al., 2013; Schaffer et al., 2014). Collectively, these findings suggest that taurine/hypotaurine depletion may play a directly pathogenic role in sorafenib‐induced cardiotoxicity.
Sorafenib treatment also has been associated with impaired cognitive functioning in cancer patients, including impairment of learning, memory and executive function (Brandi et al., 2013; Mulder et al., 2014). Interestingly, NMR‐based metabolomics analysis of sorafenib neurotoxicity identified significant decreases in taurine abundance in hippocampus and striatum after 7 and 29 days of sorafenib treatment (Du et al., 2015), consistent with our findings.
Sorafenib treatment also induced significant decreases in AMP (heart), adenosine/iosine (liver and skeletal muscle) and adenine (plasma) compared to vehicle‐treated controls (Table 3). In the AMP‐adenosine pathway, the adenine purine base binds a nucleoside to form adenosine, which is then phosphorylated to form AMP. While it is not clear if sorafenib's effects on the AMP pathway have been identified previously, sorafenib is known to interfere with cAMP/PKA signalling in cancer cells to inhibit growth (Spirli et al., 2012). Since sorafenib is an aromatic molecule that mimics the adenine group of ATP, engaging the highly conserved ATP‐binding pocket, alterations in this pathway may be due to sorafenib's structural properties (Zhang et al., 2009). The relationship of altered adenine‐adenosine‐AMP to the cardiotoxicity is unclear, but concomitant changes in both heart and plasma adenine suggest the possibility that this pathway could be monitored during sorafenib treatment.
Future studies of sorafenib‐induced cardiotoxicity could test the use of more sensitive assays of circulating taurine/hypotaurine or adenine (e.g. urine) as potential biomarkers or explore whether taurine deficiency contributes directly to cardiac injury. If taurine deficiency proves to be mechanistically involved in sorafenib cardiotoxicity, taurine supplementation may be helpful in attenuating sorafenib‐induced cardiac injury, as has been shown with doxorubicin‐induced cardiotoxicity. Interestingly, recent studies indicated that taurine is among the micronutrients that are commonly deficient in heart failure (Soukoulis et al., 2009).
Author contributions
B.J., M.W., C.P. and G.J. conceived and designed the experiments; T.L., J.Y.B., W.H., A.I., J.R.B., C.N. and M.M. performed the experiments and wrote the materials and methods; B.J., M.W., J.R.B. and M.M. analysed the data; B.J., M.W., C.P. and G.J. were involved with the interpretation of the data; M.W. and B.J. wrote and edited the work.
Conflict of interest
The authors declare no conflicts of interest.
Declaration of transparency and scientific rigour
This Declaration acknowledges that this paper adheres to the principles for transparent reporting and scientific rigour of preclinical research recommended by funding agencies, publishers and other organisations engaged with supporting research.
Supporting information
Table S1.1 Non‐targeted metabolomics performed on heart from mice treated with Vehicle or Sorafenib (30 mg·kg−1). Metabolites included for analysis here contained at least 8 values of the 10 total biological replicates per groups. Missing values in these cases were substituted with the lowest peak value across the remaining group. Up to two missing values in a given group were imputed. Metabolites with no detection in either group were not included for analysis. Raw data is available at www.metabolomicsworkbench.org (The Metabolomics Workbench, Created by the National Institutes of Health (NIH) Common Fund Metabolomics Program).
Table S1.2 Non‐targeted metabolomics performed on liver from mice treated with Vehicle or Sorafenib (30 mg·kg−1). Metabolites included for analysis here contained at least 8 values of the 10 total biological replicates per groups. Missing values in these cases were substituted with the lowest peak value across the remaining group. Up to two missing values in a given group were imputed. Metabolites with no detection in either group were not included for analysis. Raw data is available at www.metabolomicsworkbench.org (The Metabolomics Workbench, Created by the National Institutes of Health (NIH) Common Fund Metabolomics Program).
Table S1.3 Non‐targeted metabolomics performed on skeletal muscle (quadriceps femoris) from mice treated with Vehicle or Sorafenib (30 mg·kg−1). Metabolites included for analysis here contained at least 8 values of the 10 total biological replicates per groups. Missing values in these cases were substituted with the lowest peak value across the remaining group. Up to two missing values in a given group were imputed. Metabolites with no detection in either group were not included for analysis. Raw data is available at www.metabolomicsworkbench.org (The Metabolomics Workbench, Created by the National Institutes of Health (NIH) Common Fund Metabolomics Program).
Table S1.4 Non‐targeted metabolomics performed on plasma from mice treated with Vehicle or Sorafenib (30 mg·kg−1). Metabolites included for analysis here contained at least 8 values of the 10 total biological replicates per groups. Missing values in these cases were substituted with the lowest peak value across the remaining group. Up to two missing values in a given group were imputed. Metabolites with no detection in either group were not included for analysis. Raw data is available at www.metabolomicsworkbench.org (The Metabolomics Workbench, Created by the National Institutes of Health (NIH) Common Fund Metabolomics Program).
Figure S1 Heat map of all metabolites in hearts from sorafenib‐treated mice compared to vehicle‐treated mice determined by GC–MS. Heat map represents peak values of metabolites. n = 10 biological replicates per group.
Figure S2 Heat map of all metabolites in livers from sorafenib‐treated mice compared to vehicle‐treated mice determined by GC–MS. Heat map represents peak values of metabolites. n = 10 biological replicates per group.
Figure S3 Heat map of all metabolites in skeletal muscle (quadriceps femoris) from sorafenib‐treated mice compared to vehicle‐treated mice determined by GC–MS. Heat map represents peak values of metabolites. n = 10 biological replicates per group.
Figure S4 Heat map of all metabolites in plasma from sorafenib‐treated mice compared to vehicle‐treated mice determined by GC–MS. Heat map represents peak values of metabolites. n = 10 biological replicates per group.
Figure S5 Enrichment analysis of the t‐test significant metabolites identified after sorafenib treatment in heart, liver, skeletal muscle (quadriceps femoris), and plasma. Enrichment analysis performed using Metaboanalyst V3 (www.metaboanalyst.ca).
Figure S6 Liver histology after 14 days of sorafenib treatment. A. Representative H&E stained liver sections. B. Representative Masson trichrome stained liver sections. Three biological replicates per groups were analysed. The black bar in each panel represents 200 microns. 10X magnification
Figure S7 Higher power liver histology after 14 days of sorafenib treatment. Representative H&E stained liver sections. Three biological replicates per groups were analysed. The black bar in each panel represents 100 microns. 20X magnification.
Figure S8 Skeletal muscle histology after 14 days of sorafenib treatment. A. H&E stained sections (10X magnification, black bar represents 100 microns). B. Trichrome stained sections (20X magnification, black bar represents 100 microns).
Acknowledgements
This work was supported by the National Institutes of Health (R01HL104129 to M.S.W. and UL1TR001111 to B.C.J. and G.L.J. through UNC NC TraCS), the Leducq Foundation Transatlantic Networks of Excellence (11CVD04 to M.S.W. and C.P.) and the American Heart Association (Post‐Doctoral Fellowship to T.L.P.). The authors thank Dawud Hilliard (University of North Carolina Lineberger Center Animal Histopathology Laboratory) for assistance in processing and staining of the histological specimens and Bentley Midkiff in the UNC Translational Pathology Laboratory for assistance and technological support in digitally scanning the glass slides for Aperio digital analysis.
Jensen, B. C. , Parry, T. L. , Huang, W. , Beak, J. Y. , Ilaiwy, A. , Bain, J. R. , Newgard, C. B. , Muehlbauer, M. J. , Patterson, C. , Johnson, G. L. , and Willis, M. S. (2017) Effects of the kinase inhibitor sorafenib on heart, muscle, liver and plasma metabolism in vivo using non‐targeted metabolomics analysis. British Journal of Pharmacology, 174: 4797–4811. doi: 10.1111/bph.14062.
Contributor Information
Brian C Jensen, Email: bcjensen@med.unc.edu.
Monte S Willis, Email: monte_willis@med.unc.edu.
References
- Alexander SPH, Fabbro D, Kelly E, Marrion N, Peters JA, Benson HE et al (2015). The Concise Guide to PHARMACOLOGY 2015/16: Catalytic receptors. Br J Pharmacol 172: 5979–6023. [DOI] [PMC free article] [PubMed] [Google Scholar]
- Azuma J, Sawamura A, Awata N, Ohta H, Hamaguchi T, Harada H et al (1985). Therapeutic effect of taurine in congestive heart failure: a double‐blind crossover trial. Clin Cardiol 8: 276–282. [DOI] [PubMed] [Google Scholar]
- Banerjee R, Bultman SJ, Holley D, Hillhouse C, Bain JR, Newgard CB et al (2015). Non‐targeted metabolomics of Brg1/Brm double‐mutant cardiomyocytes reveals a novel role for SWI/SNF complexes in metabolic homeostasis. Metabolomics 11: 1287–1301. [DOI] [PMC free article] [PubMed] [Google Scholar]
- Beyranvand MR, Khalafi MK, Roshan VD, Choobineh S, Parsa SA, Piranfar MA (2011). Effect of taurine supplementation on exercise capacity of patients with heart failure. J Cardiol 57: 333–337. [DOI] [PubMed] [Google Scholar]
- Brandi G, de Rosa F, Calza L, Girolamo SD, Tufoni M, Ricci CS et al (2013). Can the tyrosine kinase inhibitors trigger metabolic encephalopathy in cirrhotic patients? Liver Int 33: 488–493. [DOI] [PubMed] [Google Scholar]
- Chang YS, Adnane J, Trail PA, Levy J, Henderson A, Xue D et al (2007). Sorafenib (BAY 43‐9006) inhibits tumor growth and vascularization and induces tumor apoptosis and hypoxia in RCC xenograft models. Cancer Chemother Pharmacol 59: 561–574. [DOI] [PubMed] [Google Scholar]
- Chowbay B, Jada SR, Wan Teck DL (2006). Correspondence re: Cecchin et al., Carboxylesterase isoform 2 mRNA expression in peripheral blood mononuclear cells is a predictive marker of the irinotecan to SN38 activation step in colorectal cancer patients. Clin Cancer Res 2005; 11: 6901‐7. Clin Cancer Res 12: 1942; author reply 1942‐1943. [DOI] [PubMed] [Google Scholar]
- Clark JW, Eder JP, Ryan D, Lathia C, Lenz HJ (2005). Safety and pharmacokinetics of the dual action Raf kinase and vascular endothelial growth factor receptor inhibitor, BAY 43‐9006, in patients with advanced, refractory solid tumors. Clin Cancer Res 11: 5472–5480. [DOI] [PubMed] [Google Scholar]
- Curtis MJ, Bond RA, Spina D, Ahluwalia A, Alexander SP, Giembycz MA et al (2015). Experimental design and analysis and their reporting: new guidance for publication in BJP. Br J Pharmacol 172: 3461–3471. [DOI] [PMC free article] [PubMed] [Google Scholar]
- Das J, Ghosh J, Manna P, Sil PC (2011). Taurine suppresses doxorubicin‐triggered oxidative stress and cardiac apoptosis in rat via up‐regulation of PI3‐K/Akt and inhibition of p53, p38‐JNK. Biochem Pharmacol 81: 891–909. [DOI] [PubMed] [Google Scholar]
- Du C, Shao X, Zhu R, Li Y, Zhao Q, Fu D et al (2015). NMR‐based metabolic profiling reveals neurochemical alterations in the brain of rats treated with sorafenib. Neurotox Res 28: 290–301. [DOI] [PubMed] [Google Scholar]
- Duran JM, Makarewich CA, Trappanese D, Gross P, Husain S, Dunn J et al (2014). Sorafenib cardiotoxicity increases mortality after myocardial infarction. Circ Res 114: 1700–1712. [DOI] [PMC free article] [PubMed] [Google Scholar]
- Escalante CP, Chang YC, Liao K, Rouleau T, Halm J, Bossi P et al (2016). Meta‐analysis of cardiovascular toxicity risks in cancer patients on selected targeted agents. Support Care Cancer 24: 4057–4074. [DOI] [PubMed] [Google Scholar]
- Hall PS, Harshman LC, Srinivas S, Witteles RM (2013). The frequency and severity of cardiovascular toxicity from targeted therapy in advanced renal cell carcinoma patients. JACC Heart Fail 1: 72–78. [DOI] [PubMed] [Google Scholar]
- Hamaguchi T, Azuma J, Awata N, Ohta H, Takihara K, Harada H et al (1988). Reduction of doxorubicin‐induced cardiotoxicity in mice by taurine. Res Commun Chem Pathol Pharmacol 59: 21–30. [PubMed] [Google Scholar]
- Ito T, Muraoka S, Takahashi K, Fujio Y, Schaffer SW, Azuma J (2009). Beneficial effect of taurine treatment against doxorubicin‐induced cardiotoxicity in mice. Adv Exp Med Biol 643: 65–74. [DOI] [PubMed] [Google Scholar]
- Ito T, Oishi S, Takai M, Kimura Y, Uozumi Y, Fujio Y et al (2010). Cardiac and skeletal muscle abnormality in taurine transporter‐knockout mice. J Biomed Sci 17 (Suppl 1): S20. [DOI] [PMC free article] [PubMed] [Google Scholar]
- Ito T, Schaffer S, Azuma J (2014). The effect of taurine on chronic heart failure: actions of taurine against catecholamine and angiotensin II. Amino Acids 46: 111–119. [DOI] [PubMed] [Google Scholar]
- Karovic S, Shiuan EF, Zhang SQ, Cao H, Maitland ML (2016). Patient‐level adverse event patterns in a single‐institution study of the multi‐kinase inhibitor sorafenib. Clin Transl Sci. https://doi.org/10.1111/cts.12408. [DOI] [PMC free article] [PubMed] [Google Scholar]
- Keating GM, Santoro A (2009). Sorafenib: a review of its use in advanced hepatocellular carcinoma. Drugs 69: 223–240. [DOI] [PubMed] [Google Scholar]
- Kilkenny C, Browne W, Cuthill IC, Emerson M, Altman DG (2010). Animal research: reporting in vivo experiments: the ARRIVE guidelines. Br J Pharmacol 160: 1577–1579. [DOI] [PMC free article] [PubMed] [Google Scholar]
- Kuczynski EA, Lee CR, Man S, Chen E, Kerbel RS (2015). Effects of sorafenib dose on acquired reversible resistance and toxicity in hepatocellular carcinoma. Cancer Res 75: 2510–2519. [DOI] [PMC free article] [PubMed] [Google Scholar]
- Kudo M, Ikeda M, Takayama T, Numata K, Izumi N, Furuse J et al (2016). Safety and efficacy of sorafenib in Japanese patients with hepatocellular carcinoma in clinical practice: a subgroup analysis of GIDEON. J Gastroenterol 51: 1150–1160. [DOI] [PMC free article] [PubMed] [Google Scholar]
- Liu L, Cao Y, Chen C, Zhang X, McNabola A, Wilkie D et al (2006). Sorafenib blocks the RAF/MEK/ERK pathway, inhibits tumor angiogenesis, and induces tumor cell apoptosis in hepatocellular carcinoma model PLC/PRF/5. Cancer Res 66: 11851–11858. [DOI] [PubMed] [Google Scholar]
- Liu YT, Jia HM, Chang X, Ding G, Zhang HW, Zou ZM (2013). The metabolic disturbances of isoproterenol induced myocardial infarction in rats based on a tissue targeted metabonomics. Mol Biosyst 9: 2823–2834. [DOI] [PubMed] [Google Scholar]
- McGrath JC, Lilley E (2015). Implementing guidelines on reporting research using animals (ARRIVE etc.): new requirements for publication in BJP. Br J Pharmacol 172: 3189–3193. [DOI] [PMC free article] [PubMed] [Google Scholar]
- Mulder SF, Bertens D, Desar IM, Vissers KC, Mulders PF, Punt CJ et al (2014). Impairment of cognitive functioning during sunitinib or sorafenib treatment in cancer patients: a cross sectional study. BMC Cancer 14: 219. [DOI] [PMC free article] [PubMed] [Google Scholar]
- Quintana MT, Parry TL, He J, Yates CC, Sidorova TN, Murray KT et al (2016). Cardiomyocyte‐specific human Bcl2‐associated anthanogene 3 P209L expression induces mitochondrial fragmentation, Bcl2‐associated anthanogene 3 haploinsufficiency, and activates p38 signaling. Am J Pathol 186: 1989–2007. [DOI] [PMC free article] [PubMed] [Google Scholar]
- Ramila KC, Jong CJ, Pastukh V, Ito T, Azuma J, Schaffer SW (2015). Role of protein phosphorylation in excitation‐contraction coupling in taurine deficient hearts. Am J Physiol Heart Circ Physiol 308: H232–H239. [DOI] [PubMed] [Google Scholar]
- Schaffer SW, Jong CJ, Ito T, Azuma J (2014). Effect of taurine on ischemia‐reperfusion injury. Amino Acids 46: 21–30. [DOI] [PubMed] [Google Scholar]
- Schmidinger M, Zielinski CC, Vogl UM, Bojic A, Bojic M, Schukro C et al (2008). Cardiac toxicity of sunitinib and sorafenib in patients with metastatic renal cell carcinoma. J Clin Oncol 26: 5204–5212. [DOI] [PubMed] [Google Scholar]
- Schuller‐Levis GB, Park E (2003). Taurine: new implications for an old amino acid. FEMS Microbiol Lett 226: 195–202. [DOI] [PubMed] [Google Scholar]
- Smalley KS, Xiao M, Villanueva J, Nguyen TK, Flaherty KT, Letrero R et al (2009). CRAF inhibition induces apoptosis in melanoma cells with non‐V600E BRAF mutations. Oncogene 28: 85–94. [DOI] [PMC free article] [PubMed] [Google Scholar]
- Soukoulis V, Dihu JB, Sole M, Anker SD, Cleland J, Fonarow GC et al (2009). Micronutrient deficiencies an unmet need in heart failure. J Am Coll Cardiol 54: 1660–1673. [DOI] [PubMed] [Google Scholar]
- Southan C, Sharman JL, Benson HE, Faccenda E, Pawson AJ, Alexander SPH et al (2016). The IUPHAR/BPS guide to PHARMACOLOGY in 2016: towards curated quantitative interactions between 1300 protein targets and 6000 ligands. Nucleic Acids Res 44: D1054–D1068. [DOI] [PMC free article] [PubMed] [Google Scholar]
- Spirli C, Morell CM, Locatelli L, Okolicsanyi S, Ferrero C, Kim AK et al (2012). Cyclic AMP/PKA‐dependent paradoxical activation of Raf/MEK/ERK signaling in polycystin‐2 defective mice treated with sorafenib. Hepatology 56: 2363–2374. [DOI] [PMC free article] [PubMed] [Google Scholar] [Research Misconduct Found]
- Wadosky KM, Berthiaume JM, Tang W, Zungu M, Portman MA, Gerdes AM et al (2016). MuRF1 mono‐ubiquitinates TRalpha to inhibit T3‐induced cardiac hypertrophy in vivo. J Mol Endocrinol 56: 273–290. [DOI] [PMC free article] [PubMed] [Google Scholar]
- Warskulat U, Heller‐Stilb B, Oermann E, Zilles K, Haas H, Lang F et al (2007). Phenotype of the taurine transporter knockout mouse. Methods Enzymol 428: 439–458. [DOI] [PubMed] [Google Scholar]
- Wilhelm SM, Adnane L, Newell P, Villanueva A, Llovet JM, Lynch M (2008). Preclinical overview of sorafenib, a multikinase inhibitor that targets both Raf and VEGF and PDGF receptor tyrosine kinase signaling. Mol Cancer Ther 7: 3129–3140. [DOI] [PubMed] [Google Scholar]
- Xia J, Psychogios N, Young N, Wishart DS (2009). MetaboAnalyst: a web server for metabolomic data analysis and interpretation. Nucleic Acids Res 37: W652–W660. [DOI] [PMC free article] [PubMed] [Google Scholar]
- Xia J, Sinelnikov IV, Han B, Wishart DS (2015). MetaboAnalyst 3.0 – making metabolomics more meaningful. Nucleic Acids Res 43: W251–W257. [DOI] [PMC free article] [PubMed] [Google Scholar]
- Zhang J, Yang PL, Gray NS (2009). Targeting cancer with small molecule kinase inhibitors. Nat Rev Cancer 9: 28–39. [DOI] [PubMed] [Google Scholar]
- Zhang J, Salminen A, Yang X, Luo Y, Wu Q, White M et al (2017). Effects of 31 FDA approved small‐molecule kinase inhibitors on isolated rat liver mitochondria. Arch Toxicol 91: 2921–2938. [DOI] [PMC free article] [PubMed] [Google Scholar]
Associated Data
This section collects any data citations, data availability statements, or supplementary materials included in this article.
Supplementary Materials
Table S1.1 Non‐targeted metabolomics performed on heart from mice treated with Vehicle or Sorafenib (30 mg·kg−1). Metabolites included for analysis here contained at least 8 values of the 10 total biological replicates per groups. Missing values in these cases were substituted with the lowest peak value across the remaining group. Up to two missing values in a given group were imputed. Metabolites with no detection in either group were not included for analysis. Raw data is available at www.metabolomicsworkbench.org (The Metabolomics Workbench, Created by the National Institutes of Health (NIH) Common Fund Metabolomics Program).
Table S1.2 Non‐targeted metabolomics performed on liver from mice treated with Vehicle or Sorafenib (30 mg·kg−1). Metabolites included for analysis here contained at least 8 values of the 10 total biological replicates per groups. Missing values in these cases were substituted with the lowest peak value across the remaining group. Up to two missing values in a given group were imputed. Metabolites with no detection in either group were not included for analysis. Raw data is available at www.metabolomicsworkbench.org (The Metabolomics Workbench, Created by the National Institutes of Health (NIH) Common Fund Metabolomics Program).
Table S1.3 Non‐targeted metabolomics performed on skeletal muscle (quadriceps femoris) from mice treated with Vehicle or Sorafenib (30 mg·kg−1). Metabolites included for analysis here contained at least 8 values of the 10 total biological replicates per groups. Missing values in these cases were substituted with the lowest peak value across the remaining group. Up to two missing values in a given group were imputed. Metabolites with no detection in either group were not included for analysis. Raw data is available at www.metabolomicsworkbench.org (The Metabolomics Workbench, Created by the National Institutes of Health (NIH) Common Fund Metabolomics Program).
Table S1.4 Non‐targeted metabolomics performed on plasma from mice treated with Vehicle or Sorafenib (30 mg·kg−1). Metabolites included for analysis here contained at least 8 values of the 10 total biological replicates per groups. Missing values in these cases were substituted with the lowest peak value across the remaining group. Up to two missing values in a given group were imputed. Metabolites with no detection in either group were not included for analysis. Raw data is available at www.metabolomicsworkbench.org (The Metabolomics Workbench, Created by the National Institutes of Health (NIH) Common Fund Metabolomics Program).
Figure S1 Heat map of all metabolites in hearts from sorafenib‐treated mice compared to vehicle‐treated mice determined by GC–MS. Heat map represents peak values of metabolites. n = 10 biological replicates per group.
Figure S2 Heat map of all metabolites in livers from sorafenib‐treated mice compared to vehicle‐treated mice determined by GC–MS. Heat map represents peak values of metabolites. n = 10 biological replicates per group.
Figure S3 Heat map of all metabolites in skeletal muscle (quadriceps femoris) from sorafenib‐treated mice compared to vehicle‐treated mice determined by GC–MS. Heat map represents peak values of metabolites. n = 10 biological replicates per group.
Figure S4 Heat map of all metabolites in plasma from sorafenib‐treated mice compared to vehicle‐treated mice determined by GC–MS. Heat map represents peak values of metabolites. n = 10 biological replicates per group.
Figure S5 Enrichment analysis of the t‐test significant metabolites identified after sorafenib treatment in heart, liver, skeletal muscle (quadriceps femoris), and plasma. Enrichment analysis performed using Metaboanalyst V3 (www.metaboanalyst.ca).
Figure S6 Liver histology after 14 days of sorafenib treatment. A. Representative H&E stained liver sections. B. Representative Masson trichrome stained liver sections. Three biological replicates per groups were analysed. The black bar in each panel represents 200 microns. 10X magnification
Figure S7 Higher power liver histology after 14 days of sorafenib treatment. Representative H&E stained liver sections. Three biological replicates per groups were analysed. The black bar in each panel represents 100 microns. 20X magnification.
Figure S8 Skeletal muscle histology after 14 days of sorafenib treatment. A. H&E stained sections (10X magnification, black bar represents 100 microns). B. Trichrome stained sections (20X magnification, black bar represents 100 microns).


