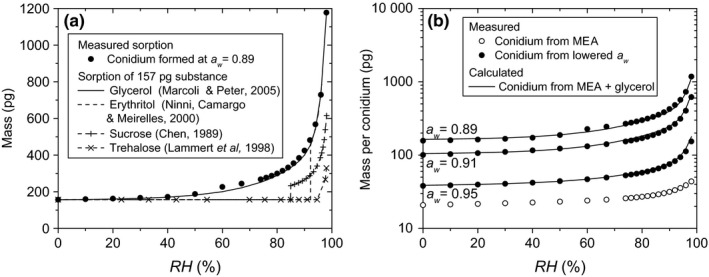
Figure 4.

(a) comparison of the sorption behavior of several compatible solutes (lines) as compared to the measured sorption of a conidium formed at a w = 0.89 (●). For each polyol, the relation between concentration and a w of its aqueous solution is used to plot the mass of the solution as a function of RH when the amount of solute is kept constant. Each time, an amount of polyol corresponding to the dry mass of a conidium was chosen to visually compare the sorption of the solutions to that of the conidium. (b) a simple model describing how the sorption of conidia formed on MEA (○) would be modified by different amounts of glycerol. The result is compared to the measured sorption of conidia formed at lowered a w (●). The mass of the glycerol is chosen to be equal to the difference in dry weight between conidia formed at lowered a w and those formed on MEA. The modeled sorption (_) is defined as the sum of the sorption of the glycerol solution and that of the conidia formed on MEA
