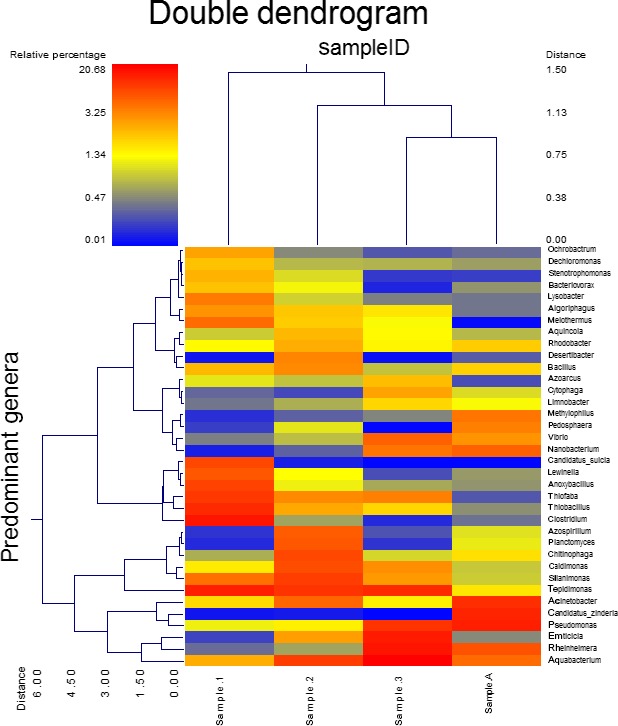
Figure 4.

Dual Hierarchal dendrogram assessment of the taxonomic classification data. Samples that have similar microbial populations are clustered closer together. The genera or consortia are used here for clustering. Therefore, the samples with more similar genera or consortium cluster closer together and the length of connecting lines (top of heatmap) is correlated to the similarity. Shorter lines between two samples indicate closely matched microbial consortium. The heatmap denotes the relative percentages of each genus. The dominant genera are represented along the right Y‐axis. The heatmap legend is shown in the upper left corner
