


Abstract
H2A.Z histone variant is an important regulator of gene transcription, which is enriched at regulatory regions but is also found within gene bodies. Recent evidence suggests that active recruitment of H2A.Z within gene bodies is required to induce gene repression. In contrast to this view, we show that global inhibition of transcription results in H2A.Z accumulation at gene transcription start sites, as well as within gene bodies. Our results indicate that accumulation of H2A.Z within repressed genes can also be a consequence of the repression of gene transcription rather than an active mechanism required to establish the repression.
INTRODUCTION
The regulation of chromatin dynamics is a key mechanism that controls essential cellular functions such as gene expression, DNA repair and replication (1). Chromatin dynamics can be modulated through different mechanisms including post-translational modification of histone tails, physical displacement of nucleosomes by ATP-dependent nucleosome remodelers, and exchange of canonical histones by histone variants (2,3). Histone variant H2A.Z has been studied in detail over the last decade and owing to the work of several laboratories, a detailed picture of H2A.Z biology has emerged. It is now clear that the distribution of H2A.Z across the human genome is restricted to very specific loci such as gene transcription start sites (TSS), enhancers, and insulator sites (4–6). We have shown in two examples, in yeast and in human cells, that H2A.Z is required for the proper positioning of regulatory nucleosomes at promoters (7–10), but other reports have shown that this may not be a general mechanism (11,12).
Although H2A.Z is found to be located primarily at gene regulatory regions across the genome, the histone variant can also be found within gene bodies (13–16). However, the significance of this phenomenon is still debatable. In recent work by Latorre et al., the recruitment of H2A.Z within gene bodies by the DREAM (Dimerization partner, RB-like, E2F and Multi-vulval class B) complex has been proposed to cause the repression of the targeted genes, suggesting that active recruitment of H2A.Z within gene bodies is required to establish transcriptional repression (14). In parallel, Hardy et al. previously showed that active gene transcription prevents H2A.Z from associating with gene bodies (13). The evidence supporting this suggestion is derived from two main results from this group. First, they showed that upon shut down of heat shock genes in yeast, H2A.Z re-associates with gene bodies (13). Secondly, they very recently found that yeast RNA Pol II-associated histone chaperones, FACT and Spt6, prevent accumulation of H2A.Z within gene bodies during transcription by ensuring proper nucleosome assembly behind the advancing RNA Pol II, a process that presumably prevents the formation of aberrant NFRs that would in turn allow ectopic H2A.Z deposition (17). Consequently, and in contrast to what Latorre et al. proposed, these experiments suggest that H2A.Z accumulation within gene bodies would be the consequence of gene repression. However, both studies only draw indirect correlations between transcription levels and the presence of H2A.Z within gene bodies, which makes it difficult to determine whether the recruitment of H2A.Z within the body of repressed genes is a cause, or a consequence of gene activity.
To shed light on this issue, we thus used a genome-wide approach to investigate the distribution of H2A.Z within genes under normal conditions and under conditions where global transcription by RNA Pol II is artificially inhibited. While we were able to confirm the anti-correlation between the presence of H2A.Z within genes and transcription levels, we also reveal that global inhibition of transcription results in a specific increase of H2A.Z incorporation within gene bodies and TSSs. We further demonstrate that this increase in H2A.Z incorporation within genes can be concomitant—at least in some genes—to the recruitment of the H2A.Z loading chromatin remodeler, p400, at TSSs and cohesin binding sites. Our findings provide evidence supporting the hypothesis that the accumulation of H2A.Z within repressed genes can also be the consequence of the absence of gene transcription rather than an active mechanism required to establish the repression.
MATERIALS AND METHODS
Cells, cell culture, and cell treatment
HCT116 cells (a gift from Dr Bert Vogelstein, Howard Hughes Medical Institute, Baltimore, MD, USA) were cultured in a 5% CO2-containing atmosphere in DMEM (Wisent) supplemented with 10% fetal bovine serum (Sigma), 0.2 U/ml penicillin G and 100 mg/ml streptomycin (Invitrogen). For the global inhibition of transcription, HCT116 cells were treated with 8 μM α-amanitin (Sigma) or 0.5 μM flavopiridol (Santa Cruz) for 24 h.
Chromatin immunoprecipitation
ChIP assays were performed as previously described (4). Samples were sonicated to generate 500-bp DNA fragments. Immunoprecipitations were carried out using antibodies reported in Supplementary Table S1. Pre-immune and no antibody controls were also performed. qPCR was done using the primer set reported in Supplementary Table S2. ChIP was analyzed as % of input and with a NoAb as control. NT signals were set to 100% and the Amanitin/Flavopridol signals were normalized by respect to their NT signal. ChIP experiments were performed as independent biological triplicates and data are presented as mean ± SD.
Chromatin immunoprecipitation coupled to deep-sequencing
H2A.Z and Rad21 ChIP-seq were performed similarly to the ChIP experiments except for the following steps. For each treatment conditions, six immunoprecipitations were performed in parallel. For Rad21, immunoprecipitations were carried out using Dynabeads coupled to protein A (Life Technologies) and no pre-clearing was done. The banks for deep-sequencing were prepared from 10 ng of ChIPed DNA using the NEBNext Ultra DNA Library Prep Kit for Illumina (NEB) according to manufacturer's protocol. Samples were sequenced paired-end at 50-bp read length on an Illumina HiSeq-2000. As described in supplementary methods, the reads were aligned onto the hg19 reference genome using BWA and processed using MACS2 and VAP (18–20).
RT-qPCR
Pre-mRNAs of p21, PCNA, DDIT4, GDF15 and mRNA of 36B4 were quantified by RT-qPCR and normalized to 36B4 expression level. Total RNA was extracted from cultured cells using EZ-10 DNAaway RNA Miniprep Kit (BioBasic). RNA was treated with DNase I, a 50 μl reaction containing 5 μg RNA, 1× DNase I Buffer (Zymo), 5 u DNase I (Zymo) was assembled and incubated for 15 min at 37°C and then purified using the RNA Clean and Concentrator Kit (Zymo). Reverse transcription was carried out using the M-MLV reverse transcriptase enzyme (Enzymatics) and random hexamers according to manufacturer's protocols. The RT-qPCR primer sets are reported in Supplementary Table S3. Experiments were performed as independent biological triplicates and data are presented as mean ± SD.
RNA sequencing
Total RNA was extracted as described in the RT-qPCR protocol section. Banks for deep-sequencing were prepared from 800 ng total RNA using Illumina's TruSeq Stranded mRNA LT Kit according to manufacturer's protocol. Samples were sequenced paired-end at 50-bp read length on an Illumina HiSeq-2000. As described in supplementary methods, the reads were trimmed using Trimmomatic, aligned onto the hg19 reference genome using TopHat2, filtered using SamTools, then the FPKM calculated using Cufflinks (21–24).
Immunoblotting
Western blots of p400, H2A.Z, H3 and actin were performed on whole cell extracts. Briefly, cells were washed with PBS, harvested, resuspended in lysis buffer (50 mM Tris–HCl, pH 7.5, 150 mM NaCl, 1% Triton X-100, 0.5% Na-deoxycholate, 0.2% SDS, 1 mM PMSF, 1× Roche Complete protease inhibitor cocktail) and passed five times through a 23G1 needle. Lysis was performed at 4°C for 1 h on a rotary wheel and the lysate was centrifuged at 14 000 rpm for 10 min at 4°C. The supernatant was collected and dosed.
Western blots of H2A.Z and H3 were performed on histone extracts. Cells were washed with PBS, collected, resuspended in Triton extraction buffer (0.5% Triton X-100, 2.5 mM PMSF, 0.02% NaN3, 1× Roche Complete protease inhibitor cocktail), incubated on ice for 10 min, and centrifuged at 7500 rpm for 8 min at 4°C. The pellet was washed with 500 μl of Triton extraction buffer, then centrifuged at 7500 rpm for 8 min at 4°C. The pellet was resuspended in 0.2 N HCl (50 μl for 4 million cells) and incubated over-night at 4°C. The next day, histone extracts were cleared by a centrifugation at 7500 rpm for 8 min at 4°C. The supernatant was collected and dosed.
The list of antibodies used for the western blots are reported in Supplementary Table S4.
Knock-down of p400
For the knockdown experiment of p400, HCT116 cells were transduced immediately following cell passage with either lentiviruses containing the pLVTHM plasmid (Trono's laboratory) directed against p400 (TRCN0000312676 + TRCN0000312686) or a control shRNA in the presence of polybrene (8 μg/ml) for 24 h. On the fourth day following infections, the cells were collected for subsequent experiments.
RESULTS AND DISCUSSION
H2A.Z level is low within gene bodies and anti-corelates with transcription at nucleosome +1
In a first experiment, we aimed at investigating the effect of transcription on the distribution of H2A.Z within genes bodies in human cells. To achieve this, we made use of chromatin immuno-precipitation assays coupled to deep sequencing (ChIP-seq) to measure the genome-wide distribution of H2A.Z in HCT116 colon cancer cells. In parallel to ChIP-seq, RNA from HCT116 cells was extracted and sequenced (RNA-seq) in order to measure gene expression levels. As such, we were able to sort genes according to their relative expression level using their respective ‘Fragments Per Kilobase of transcript per Million mapped reads’ index (FPKM), as well as generate H2A.Z aggregate profiles (Figure 1). We observed that H2A.Z accumulates only at the –1 and +1 nucleosomes of transcribed genes’ TSS, and was absent from the TSSs of non-transcribed genes (Figure 1). We also noted that, while the increase of transcription has virtually no effect on H2A.Z level at the TSS –1 nucleosome, H2A.Z is evicted from the +1 nucleosome as transcription increases (Figure 1). Finally, we observed that the level of H2A.Z within gene bodies of transcribed genes decreases as genes transcription levels increase, suggesting that transcription maintains low levels of H2A.Z within gene bodies (Figure 1 and Supplementary Figure S1).
Figure 1.
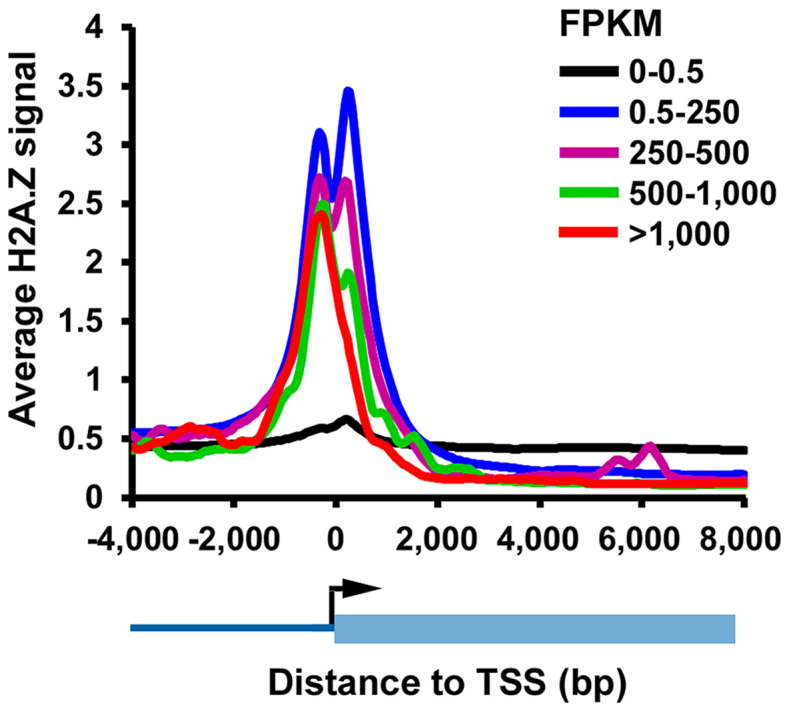
The presence of H2A.Z within genes anti-correlates with transcription. Genes were grouped based on their FPKM values and the average ChIP-seq signal of H2A.Z is shown at TSS for each group.
Taken together, these results, in accordance with the data from Hardy et al. and Jeronimo et al., suggest that active transcription may lead to the eviction of H2A.Z from genes (13,17). These experiments however do not directly test whether active gene transcription per se is directly responsible for remodeling histone H2A.Z within gene bodies.
Inhibition of transcription specifically increases the incorporation of H2A.Z within genes
In order to measure H2A.Z incorporation under conditions where RNA pol II transcription is globally inhibited, we treated HCT116 cells with α-amanitin. This molecule is a very strong inhibitor of transcription that stops the translocation of RNA pol II and causes its release from DNA (25,26). To first verify that α-amanitin treatment efficiently inhibits transcription, we used our RNA-seq data to select a set of control genes that are transcribed in non-treated HCT116 cells and used ChIP to monitor RNA pol II levels at their TSS following α-amanitin treatment (Supplementary Figure S2). This experiment validated that α-amanitin treatment results in a severe decrease in RNA pol II binding at their genes’ respective TSSs (Supplementary Figure S2A). Next, to verify that the eviction of RNA pol II decreases the transcription of these genes, we measured the level of their pre-mRNAs by RT-qPCR following α-amanitin treatment (Supplementary Figure S2B). We monitored pre-mRNAs because their half-life is shorter than those of mature mRNAs, and, as such, the quantification of pre-mRNA is more likely to reflect the transcriptional activity that occurs at a given gene. As expected, the α-amanitin treatment significantly decreased transcription levels measured at control genes (Supplementary Figure S2B).
We then performed ChIP-seq to measure H2A.Z levels in HCT116 cells following α-amanitin treatment. We observed that at genes that were not transcribed, H2A.Z remained absent from their TSSs, whether or not transcription was inhibited (Figure 2A). On the other hand, at genes that were transcribed, the α-amanitin treatment triggered a strong accumulation of H2A.Z at TSSs and within gene bodies (Figure 2A). The accumulation of H2A.Z was very specific and restricted to TSSs and gene bodies as the inhibition of transcription had virtually no effect on the level of H2A.Z in non-transcribed regions located outside genes (Figure 2B).
Figure 2.

Inhibition of transcription specifically increases the incorporation of H2A.Z within genes. Average H2A.Z ChIP-seq signal at different location following treatment of cells with 8 μM α-amanitin for 24 h: (A) at TSS of non-transcribed (FPKM = 0; n = 14 676) or transcribed (FPKM > 0.5; n = 5046) non-overlapping genes; (C) at regions located outside genes (n = 4238). The average distance of these sites to the closest gene is >30 kb; (C) at Rad21 sites located within non-transcribed (FPKM = 0; n = 3193) or transcribed (FPKM > 0.5; n = 9,550) non-overlapping genes; (D) at Rad21 sites located outside genes (n = 8825). (E) Example of genes where H2A.Z accumulates within gene bodies following transcription inhibition. RNA-seq (blue) and H2A.Z ChIP-seq (black) tracks are shown.
We then investigated whether the inhibition of transcription also affects the level of H2A.Z at functional elements located within gene bodies. To this aim, because H2A.Z is known to colocalize with the Rad21 cohesion subunit, we analyzed H2A.Z signals at the binding sites of the cohesin subunit Rad21 identified through peak calling using Rad21 ChIP-seq data obtained in HCT116 cells (10,27). Cohesin is a conserved four subunit complex that was originally known for its role in mediating sister chromatid cohesion, but increasing evidence involved the complex in other processes that involve DNA looping such as transcriptional regulation (28). Figure 2C shows that only Rad21 sites located within genes that were transcribed prior to transcription inhibition present an accumulation of H2A.Z. The accumulation is global and not restricted to the Rad21 site, as the signal increases equally in the surrounding region (Figure 2C). This accumulation was also specific to gene bodies as no increase in H2A.Z level was observed at Rad21 sites located outside genes (Figure 2D). These data support that the inhibition of transcription globally increases the level of H2A.Z within gene bodies, regardless of whether the region is a functional element or not.
In order to verify that the accumulation of H2A.Z that we observed was due to an increase in H2A.Z incorporation within nucleosomes, rather than to an increase in nucleosome density, we performed a ChIP of histones H3 and H2A.Z at control sites (Supplementary Figure S3A). We observed that, while H3 levels remained mostly stable following α-amanitin treatment, the level of H2A.Z increased; supporting the view that the increase in H2A.Z levels following inhibition of transcription is due to an increase in the incorporation of H2A.Z (Supplementary Figure S3B). Finally, to ensure that the incorporation of H2A.Z within gene bodies following α-amanitin treatment was restricted to specific loci and was not occurring globally across the entire genome, we measured global levels of H2A.Z present in chromatin by performing an immunoblot of H2A.Z using acid-extracted histones (Supplementary Figure S3C). This experiment revealed that there is no global increase in H2A.Z incorporation within chromatin, but rather α-amanitin treatment prompts the incorporation of H2A.Z at a limited set of genomic loci.
To further validate these findings, we used another general transcription inhibitor, flavopiridol. Flavopiridol is an inhibitor of the CDK9 component of positive transcription elongation factor b (P-TEFb) (26). By inhibiting the kinase activity of P-TEFb, flavopiridol prevents RNA pol II entry into transcription elongation (29,30), which results in accumulation of promoter proximal paused RNA pol II (31,32). As expected, flavopiridol treatment caused an increase in paused RNA pol II at the TSSs of PCNA, DDIT4 and CDKN1A (Supplementary Figure S4A), as well as a significant decrease in the transcription levels of all the genes tested (Supplementary Figure S4B). Importantly, inhibition of transcription using flavopiridol caused H2A.Z accumulation specifically at TSS’s as well as within gene bodies while the levels of H3 and the global levels of chromatin-bound H2A.Z were not affected (Supplementary Figure S5A,B and C). This is of significance since making use of α-amanitin and flavopiridol to halt transcription both have very distinct mechanisms of action on RNA polII yet both methods allows an increase in H2A.Z localization at TSS’s and Rad21 sites. As a control, we confirmed that treatment of cells with flavopiridol did not affect the protein levels of p400 (Supplementary Figure S5D).
Based on these data, we conclude that gene levels of H2A.Z increase globally within gene bodies and TSSs when actively transcribed genes become transcriptionally inactive (see example Figure 2E). We propose that when transcription is prevented, whether or not RNA pol II is evicted from TSSs and gene bodies, H2A.Z accumulates within those regions. It is not entirely surprising that H2A.Z can also co-localize with RNA polII at TSS’s (e.g. during flavopiridol treatment) as it was also observed in other studies (11,13,33,34). This suggests that H2A.Z replaces non-processive RNA pol II and is incorporated non-specifically throughout these loci. However, it remains to be determined which chaperone could be involved for actively loading H2A.Z throughout gene bodies.
The p400 ATPase is recruited to genes following transcription inhibition
In human cells, the p400 chromatin-remodeling ATPase is known to play a critical role in the incorporation of H2A.Z within chromatin (4,35). We speculated that this remodelling complex might be responsible for the incorporation of H2A.Z within TSSs and gene bodies following α-amanitin treatment. We thus performed a ChIP of p400 in HCT116 cells treated or not with α-amanitin (Figure 3A). Remarkably, p400 recruitment was increased at the TSSs of all tested genes, where we also observed an increase in H2A.Z incorporation following α-amanitin treatment (Figure 3A, Supplementary Figure S3B). We also measured p400 levels at Rad21 sites located within genes and outside of genes. Following α-amanitin treatment, we observed that p400 can be recruited to the Rad21 sites located within CDKN1A and GDF15 genes, but it is totally absent at the FDXR site. We also found that, under those conditions, p400 is not recruited to Rad21 sites that lie outside of genes, even though H2A.Z is incorporated (Figure 3A, Supplementary Figure S3B). We thus conclude that the incorporation of H2A.Z at TSSs and within gene bodies is correlated for the most part with the recruitment of p400. It remains to be determined whether other chaperones, such as SRCAP, also participate in reloading H2A.Z after transcription ceases. Finally, to further substantiate that p400 is important for the incorporation of H2A.Z within chromatin, we made use of shRNA to deplete its expression and subsequently measured total H2A.Z using immunoblotting with an anti-H2A.Z antibody either from total extracts or from acid extracted histones. We found no significant drop in H2A.Z levels with total cellular H2A.Z, while a significant decrease is observed with chromatin-associated H2A.Z (Figure 3B). Finally, using ChIP, we observed that the depletion of p400 resulted in a decrease of H2A.Z levels at TSSs and Rad21 sites located within the genes (Figure 3D). H2A.Z levels outside of genes at a Rad21 site and three control regions were also monitored. In those cases we observed that the depletion of p400 did not decrease H2A.Z occupancy outside of the genes (Figure 3D). These experiments confirm that when p400 protein levels are decreased, the incorporation of H2A.Z within chromatin is also decreased at some but not all sites. As a control, we confirmed that cellular depletion of p400 did not affect the level of H2A.Z mRNA (Figure 3C).
Figure 3.

The p400 chromatin-remodeling ATPase is specifically recruited at gene TSSs following transcription inhibition. (A) ChIP experiment showing p400 binding following treatment of cells with 8 μM α-amanitin for 24 h. (B) Immunoblot analysis of p400, H2A.Z, H3 and actin in p400 depleted HCT116 cells. (C) RT-qPCR of p400 and H2A.Z in p400 depleted HCT116 cells. (D) ChIP analysis of H2A.Z enrichment following p400 depletion using shRNA. knockdown at different p53 target genes. The primers used in these experiments correspond to the mentioned sites for each genes. Chr10 correspond to an intergenic region at chromosome 10. Data presented as % non-treated (NT) signal (% input of H2A.Z/H3 considered as 100 and % input of H2A.Z/H3 of amanitin treatment normalized to respective NT).
Taken together, our results demonstrate that after transcription is inhibited, p400 incorporates H2A.Z at TSSs and also, to some extent, within gene bodies at Rad21 sites. It remains to be determined however what triggers p400 to associate with those gene regions when transcription is inhibited. Part of the answer may lie in an observation made by Fazzio et al. They showed that the H3K4me3 mark is responsible for the recruitment of p400 at both silent and active genes (36). This may account for its association to TSSs following inhibition of transcription. Nonetheless, we surmise that chaperones such as p400 can use TSSs and Rad21 sites to initiate deposition of H2A.Z ‘unidirectionally’ from TSSs and ‘bidirectionally’ from cohesin sites, which may then facilitate H2A.Z spreading within gene bodies. We propose a model where transcriptionally active RNA pol II machinery and associated histone chaperones force H2A.Z eviction at the TSS of genes (+1 nucleosome), as well as within gene bodies (17). Upon transcription inhibition, H2A.Z is reincorporated within gene bodies at least to some extent by p400 and possibly other chaperones (Figure 4). This model is also consistent with a study by Ed Luk's group where they show that blocking preinitiation complex assembly actually results in promoter-specific accumulation of H2A.Z, and that turnover of the histone variant requires the preinitiation complex (37).
Figure 4.

A schematic model illustrating H2A.Z accumulation at gene following inhibition of transcription. (A) In the presence of weak transcription H2A.Z is incorporated at nucleosome –1 and +1 of TSSs and intragenic cohesin sites by p400 or another remodelling complex (indicated by a question mark). (B) When transcription level is high, the sustained passage of elongating RNA pol II accompanied by its histone chaperone (e.g. FACT and Spt6H) results in the eviction of H2A.Z from gene bodies. (C) When transcription is inhibited by α-amanitin, RNA pol II is evicted from DNA and H2A.Z accumulates specifically within gene bodies through the action of chromatin remodelers such as p400.
In conclusion, our work has exploited two strategies to more closely investigate the role of histone H2A.Z in gene repression within gene bodies. First, because H2A.Z localization within gene bodies is diffuse, investigating its level using genome-wide approach is difficult. To circumvent this problem, we have taken advantage of the fact that H2A.Z co-localizes with cohesin (38–40) to use Rad21 sites as a viewpoint to monitor H2A.Z binding within gene bodies. Second, we have devised an experimental setup where we can artificially manipulate transcription levels to directly address whether or not H2A.Z binding to gene bodies generally catalyzes target gene repression or whether its association to those regions is simply a consequence of transcription inhibition. While Latorre et al. propose that accumulation of H2A.Z within gene bodies is an active mechanism required to establish repression, our data indicates that accumulation of H2A.Z within the body of repressed genes can also be the consequence of a decrease in transcription and, as such, should be taken into consideration when interpreting results related to H2A.Z genome wide distribution (14).
DATA AVAILABILITY
The raw reads and processed files from both ChIP-Seq and mRNA-Seq experiments have been deposited in the NCBI Gene Expression Omnibus (GEO) database (http://www.ncbi.nlm.nih.gov/geo/) and are accessible through GEO series accession number GSE101427.
Supplementary Material
ACKNOWLEDGEMENTS
We are very grateful to Dr Bert Vogelstein for the HCT116 p53+/+ cell lines. We are also grateful to Jean-François Lucier for his help with the ChIP-seq and RNA-seq analyses. We are thankful to Jennifer Chambers and Dr Viktor Steimle for their help during the preparation of this manuscript.
SUPPLEMENTARY DATA
Supplementary Data are available at NAR Online.
FUNDING
Calcul Québec and Compute Canada; CIHR [MOP-93620 awarded to L.G.] (in part). Funding for open access charge: Université de Sherbrooke.
Conflict of interest statement. None declared.
REFERENCES
- 1. Voss T.C., Hager G.L.. Dynamic regulation of transcriptional states by chromatin and transcription factors. Nat. Rev. Genet. 2014; 15:69–81. [DOI] [PMC free article] [PubMed] [Google Scholar]
- 2. Clapier C.R., Cairns B.R.. The biology of chromatin remodeling complexes. Annu. Rev. Biochem. 2009; 78:273–304. [DOI] [PubMed] [Google Scholar]
- 3. Kouzarides T. SnapShot: Histone-modifying enzymes. Cell. 2007; 131:822. [DOI] [PubMed] [Google Scholar]
- 4. Gevry N., Chan H.M., Laflamme L., Livingston D.M., Gaudreau L.. p21 transcription is regulated by differential localization of histone H2A.Z. Genes Dev. 2007; 21:1869–1881. [DOI] [PMC free article] [PubMed] [Google Scholar]
- 5. Zhang H., Roberts D.N., Cairns B.R.. Genome-wide dynamics of Htz1, a histone H2A variant that poises repressed/basal promoters for activation through histone loss. Cell. 2005; 123:219–231. [DOI] [PMC free article] [PubMed] [Google Scholar]
- 6. Ku M., Jaffe J.D., Koche R.P., Rheinbay E., Endoh M., Koseki H., Carr S.A., Bernstein B.E.. H2A.Z landscapes and dual modifications in pluripotent and multipotent stem cells underlie complex genome regulatory functions. Genome Biol. 2012; 13:R85. [DOI] [PMC free article] [PubMed] [Google Scholar]
- 7. Gevry N., Hardy S., Jacques P.E., Laflamme L., Svotelis A., Robert F., Gaudreau L.. Histone H2A.Z is essential for estrogen receptor signaling. Genes Dev. 2009; 23:1522–1533. [DOI] [PMC free article] [PubMed] [Google Scholar]
- 8. Guillemette B., Bataille A.R., Gevry N., Adam M., Blanchette M., Robert F., Gaudreau L.. Variant histone H2A.Z is globally localized to the promoters of inactive yeast genes and regulates nucleosome positioning. PLoS Biol. 2005; 3:e384. [DOI] [PMC free article] [PubMed] [Google Scholar]
- 9. Marques M., Laflamme L., Gervais A.L., Gaudreau L.. Reconciling the positive and negative roles of histone H2A.Z in gene transcription. Epigenetics. 2010; 5:267–272. [DOI] [PubMed] [Google Scholar]
- 10. Millau J.F., Gaudreau L.. CTCF, cohesin, and histone variants: connecting the genome. Biochem. Cell Biol. 2011; 89:505–513. [DOI] [PubMed] [Google Scholar]
- 11. Li B., Pattenden S.G., Lee D., Gutierrez J., Chen J., Seidel C., Gerton J., Workman J.L.. Preferential occupancy of histone variant H2AZ at inactive promoters influences local histone modifications and chromatin remodeling. Proc. Natl. Acad. Sci. U.S.A. 2005; 102:18385–18390. [DOI] [PMC free article] [PubMed] [Google Scholar]
- 12. Hartley P.D., Madhani H.D.. Mechanisms that specify promoter nucleosome location and identity. Cell. 2009; 137:445–458. [DOI] [PMC free article] [PubMed] [Google Scholar]
- 13. Hardy S., Jacques P.E., Gevry N., Forest A., Fortin M.E., Laflamme L., Gaudreau L., Robert F.. The euchromatic and heterochromatic landscapes are shaped by antagonizing effects of transcription on H2A.Z deposition. PLoS Genet. 2009; 5:e1000687. [DOI] [PMC free article] [PubMed] [Google Scholar]
- 14. Latorre I., Chesney M.A., Garrigues J.M., Stempor P., Appert A., Francesconi M., Strome S., Ahringer J.. The DREAM complex promotes gene body H2A.Z for target repression. Genes Dev. 2015; 29:495–500. [DOI] [PMC free article] [PubMed] [Google Scholar]
- 15. Coleman-Derr D., Zilberman D.. Deposition of histone variant H2A.Z within gene bodies regulates responsive genes. PLoS Genet. 2012; 8:e1002988. [DOI] [PMC free article] [PubMed] [Google Scholar]
- 16. Zilberman D., Coleman-Derr D., Ballinger T., Henikoff S.. Histone H2A.Z and DNA methylation are mutually antagonistic chromatin marks. Nature. 2008; 456:125–129. [DOI] [PMC free article] [PubMed] [Google Scholar]
- 17. Jeronimo C., Watanabe S., Kaplan C.D., Peterson C.L., Robert F.. The histone chaperones FACT and Spt6 restrict H2A.Z from intragenic locations. Mol. Cell. 2015; 58:1113–1123. [DOI] [PMC free article] [PubMed] [Google Scholar]
- 18. Coulombe C., Poitras C., Nordell-Markovits A., Brunelle M., Lavoie M.A., Robert F., Jacques P.E.. VAP: a versatile aggregate profiler for efficient genome-wide data representation and discovery. Nucleic Acids Res. 2014; 42:W485–W493. [DOI] [PMC free article] [PubMed] [Google Scholar]
- 19. Li H., Durbin R.. Fast and accurate short read alignment with Burrows-Wheeler transform. Bioinformatics (Oxford, England). 2009; 25:1754–1760. [DOI] [PMC free article] [PubMed] [Google Scholar]
- 20. Zhang Y., Liu T., Meyer C.A., Eeckhoute J., Johnson D.S., Bernstein B.E., Nusbaum C., Myers R.M., Brown M., Li W. et al. Model-based analysis of ChIP-Seq (MACS). Genome Biol. 2008; 9:R137. [DOI] [PMC free article] [PubMed] [Google Scholar]
- 21. Bolger A.M., Lohse M., Usadel B.. Trimmomatic: a flexible trimmer for Illumina sequence data. Bioinformatics (Oxford, England). 2014; 30:2114–2120. [DOI] [PMC free article] [PubMed] [Google Scholar]
- 22. Kim D., Pertea G., Trapnell C., Pimentel H., Kelley R., Salzberg S.L.. TopHat2: accurate alignment of transcriptomes in the presence of insertions, deletions and gene fusions. Genome Biol. 2013; 14:R36. [DOI] [PMC free article] [PubMed] [Google Scholar]
- 23. Li H., Handsaker B., Wysoker A., Fennell T., Ruan J., Homer N., Marth G., Abecasis G., Durbin R.. The Sequence Alignment/Map format and SAMtools. Bioinformatics (Oxford, England). 2009; 25:2078–2079. [DOI] [PMC free article] [PubMed] [Google Scholar]
- 24. Trapnell C., Williams B.A., Pertea G., Mortazavi A., Kwan G., van Baren M.J., Salzberg S.L., Wold B.J., Pachter L.. Transcript assembly and quantification by RNA-Seq reveals unannotated transcripts and isoform switching during cell differentiation. Nat. Biotechnol. 2010; 28:511–515. [DOI] [PMC free article] [PubMed] [Google Scholar]
- 25. Bushnell D.A., Cramer P., Kornberg R.D.. Structural basis of transcription: alpha-amanitin-RNA polymerase II cocrystal at 2.8 A resolution. Proc. Natl. Acad. Sci. U.S.A. 2002; 99:1218–1222. [DOI] [PMC free article] [PubMed] [Google Scholar]
- 26. Bensaude O. Inhibiting eukaryotic transcription: Which compound to choose? How to evaluate its activity. Transcription. 2011; 2:103–108. [DOI] [PMC free article] [PubMed] [Google Scholar]
- 27. Millau J.F., Wijchers P., Gaudreau L.. High-resolution 4C reveals rapid p53-dependent chromatin reorganization of the CDKN1A locus in response to stress. PLoS One. 2016; 11:e0163885. [DOI] [PMC free article] [PubMed] [Google Scholar]
- 28. Losada A. Cohesin in cancer: chromosome segregation and beyond. Nat. Rev. Cancer. 2014; 14:389–393. [DOI] [PubMed] [Google Scholar]
- 29. Chao S.H., Price D.H.. Flavopiridol inactivates P-TEFb and blocks most RNA polymerase II transcription in vivo. J. Biol. Chem. 2001; 276:31793–31799. [DOI] [PubMed] [Google Scholar]
- 30. Chao S.H., Fujinaga K., Marion J.E., Taube R., Sausville E.A., Senderowicz A.M., Peterlin B.M., Price D.H.. Flavopiridol inhibits P-TEFb and blocks HIV-1 replication. J. Biol. Chem. 2000; 275:28345–28348. [DOI] [PubMed] [Google Scholar]
- 31. Henriques T., Gilchrist D.A., Nechaev S., Bern M., Muse G.W., Burkholder A., Fargo D.C., Adelman K.. Stable pausing by RNA polymerase II provides an opportunity to target and integrate regulatory signals. Mol. Cell. 2014; 52:517–528. [DOI] [PMC free article] [PubMed] [Google Scholar]
- 32. Rahl P.B., Lin C.Y., Seila A.C., Flynn R.A., McCuine S., Burge C.B., Sharp P.A., Young R.A.. c-Myc regulates transcriptional pause release. Cell. 2011; 141:432–445. [DOI] [PMC free article] [PubMed] [Google Scholar]
- 33. Day D.S., Zhang B., Stevens S.M., Ferrari F., Larschan E.N., Park P.J., Pu W.T.. Comprehensive analysis of promoter-proximal RNA polymerase II pausing across mammalian cell types. Genome Biol. 2016; 17:120. [DOI] [PMC free article] [PubMed] [Google Scholar]
- 34. Raisner R.M., Hartley P.D., Meneghini M.D., Bao M.Z., Liu C.L., Schreiber S.L., Rando O.J., Madhani H.D.. Histone variant H2A.Z marks the 5′ ends of both active and inactive genes in euchromatin. Cell. 2005; 123:233–248. [DOI] [PMC free article] [PubMed] [Google Scholar]
- 35. Bowman T.A., Wong M.M., Cox L.K., Baldassare J.J., Chrivia J.C.. Loss of H2A.Z is not sufficient to determine transcriptional activity of Snf2-related CBP activator protein or p400 complexes. Int. J. Cell Biol. 2011; 2011:715642. [DOI] [PMC free article] [PubMed] [Google Scholar]
- 36. Fazzio T.G., Huff J.T., Panning B.. An RNAi screen of chromatin proteins identifies Tip60-p400 as a regulator of embryonic stem cell identity. Cell. 2008; 134:162–174. [DOI] [PMC free article] [PubMed] [Google Scholar]
- 37. Tramantano M., Sun L., Au C., Labuz D., Liu Z., Chou M., Shen C., Luk E.. Constitutive turnover of histone H2A.Z at yeast promoters requires the preinitiation complex. eLife. 2016; 5:e14243. [DOI] [PMC free article] [PubMed] [Google Scholar]
- 38. Barski A., Cuddapah S., Cui K., Roh T.Y., Schones D.E., Wang Z., Wei G., Chepelev I., Zhao K.. High-resolution profiling of histone methylations in the human genome. Cell. 2007; 129:823–837. [DOI] [PubMed] [Google Scholar]
- 39. Jin C., Zang C., Wei G., Cui K., Peng W., Zhao K., Felsenfeld G.. H3.3/H2A.Z double variant-containing nucleosomes mark ‘nucleosome-free regions’ of active promoters and other regulatory regions. Nat. Genet. 2009; 41:941–945. [DOI] [PMC free article] [PubMed] [Google Scholar]
- 40. Witcher M., Emerson B.M.. Epigenetic silencing of the p16(INK4a) tumor suppressor is associated with loss of CTCF binding and a chromatin boundary. Mol. Cell. 2009; 34:271–284. [DOI] [PMC free article] [PubMed] [Google Scholar]
Associated Data
This section collects any data citations, data availability statements, or supplementary materials included in this article.
Supplementary Materials
Data Availability Statement
The raw reads and processed files from both ChIP-Seq and mRNA-Seq experiments have been deposited in the NCBI Gene Expression Omnibus (GEO) database (http://www.ncbi.nlm.nih.gov/geo/) and are accessible through GEO series accession number GSE101427.