

Abstract
There are fewer than normal glucose transporters at the blood-brain barrier (BBB) in Alzheimer’s disease (AD). When reduced expression of transporters aggravates the symptoms of AD, the transporters become a potential target of therapy. The incretin hormone GLP-1 prevents the decline of cerebral metabolic rate for glucose (CMRglc) in AD, and GLP-1 may serve to raise transporter numbers. We hypothesized that the GLP-1 analog liraglutide would prevent the decline of CMRglc in AD by raising blood-brain glucose transfer, depending on the duration of disease. We randomized 38 patients with AD to treatment with liraglutide (n = 18) or placebo (n = 20) for 6 months, and determined the blood-brain glucose transfer capacity (T max) in the two groups and a healthy age matched control group (n = 6). In both AD groups at baseline, T max estimates correlated inversely with the duration of AD, as did the estimates of CMRglc that in turn were positively correlated with cognition. The GLP-1 analog treatment, compared to placebo, highly significantly raised the T max estimates of cerebral cortex from 0.72 to 1.1 umol/g/min, equal to T max estimates in healthy volunteers. The result is consistent with the claim that GLP-1 analog treatment restores glucose transport at the BBB.
Introduction
Aging populations suffer from increased incidence of metabolic disorders and type 2 diabetes, including vascular disease and dementia1. Under normal circumstances, glucose molecules in the circulation enter brain tissue from plasma by facilitated diffusion across the two membranes of the endothelium of the blood–brain barrier (BBB). The facilitated diffusion is mediated mainly by the glucose transporter 1 (GLUT1), a key regulator of glucose transport into and out of the brain where it serves to maintain homeostasis2. Among the insulin-insensitive transporters, GLUT1 is abundant in the BBB and in astrocytes, while neurons primarily are served by the glucose transporter GLUT3. Brain glucose uptake correlates with GLUT1 levels in cerebral microvessels3–5, although glucose transporters other than GLUT1 are known also to operate in the BBB, including in particular the insulin-sensitive glucose transporter GLUT46. Although GLUT1 transport mechanistically is insulin insensitive, GLUT1 transport in general may be said to moderately sensitive to the presence of insulin in the sense that the presence of insulin in earlier studies led to a limited increase in the number of GLUT1 transporters in cell membranes in specific parts of the body (muscle, thyroid gland7,8).
Alzheimer’s disease (AD) is characterized by deposits of amyloid-β (Aβ) and hyperphosphorylated tau proteins that may impair neurovascular regulation, blood brain barrier (BBB) integrity9, and expression of glucose transporters at the BBB6. The deposits also may aggravate the cerebral metabolic decline10 that correlates with impaired cognition11. Loss of glucose transporters from the BBB is known to occur before the onset of AD symptoms6, and PET of [18F]fluoro-2-deoxyglucose ([18F]FDG)-derived radioactivity in brain reveals progressive reduction of cerebral metabolic rate of glucose CMRglc, before detection of clinical symptoms in individuals with subsequently confirmed AD12. The diminished metabolism exceeds and precedes brain atrophy and neurodegeneration13–16.
There is evidence in AD that impaired brain glucose uptake or metabolism, or both, may be the result of brain insulin resistance, or down-regulation of the glucose transporters in brain required for cerebral glucose uptake and metabolism17–19. This means that it is possible that glucose transport across the BBB may become the rate-limiting step of glucose metabolism in AD20, the disorder in which the number of glucose transporters is known to be reduced21,22. Thus, the decline of the CMRglc may follow the reduction of BBB glucose transport capacity23,24. Recent work in mice reveals that reduced expression of GLUT1 in the BBB leads to massive progression of AD neuropathology, and that GLUT1 deficiency in the endothelium initiates BBB breakdown, possibly as an early pathogenic step in the evolution of AD25.
The formal differences between the maximum blood-brain glucose transport capacity (T max) and CMRglc steps of the pathways of glucose metabolism mean that the two measures are unrelated in principle, as the T max step depends on the density and activity of transporters, while the CMRglc step depends on and is close to the maximum velocity (V max) of hexokinase in brain tissue. The phosphorylation of glucose (or [18F]FDG) requires the presence of the substrate in the tissue at a concentration consistent with the V max of hexokinase, but there is no other link between the two measures. The absence of additional links was the motivation for the analysis presented here, i.e., the determination of the transport changes potentially correlated with the progression of AD.
Recent findings by the present group of researchers show that native GLP-1 raises maximum glucose transport capacity in brain capillary endothelium in healthy humans2,26. In the present investigation, we hypothesized that the same mechanism activated by the GLP-1 analog liraglutide may act to prevent the decline of glucose metabolism in patients with AD, as reported by Gejl et al.27. Restoration of mechanisms important to the neurovascular unit by liraglutide and prevention of further neurovascular degeneration would then avert the potential exacerbation of glucose transporter deficiency in AD28, in agreement with the view that glucose transport is a potentially important therapeutic target of treatment in AD6,25.
The rationales of the present paper are, first, the test of the physiological impact of BBB glucose transport on AD progress and evolution and, second, the test of restoration of mechanisms important to the neurovascular unit by liraglutide and prevention of further neurovascular degeneration would then avert the potential exacerbation of glucose transporter deficiency in AD, in agreement with the view that glucose transport is a potentially important therapeutic target of treatment in AD.
On the basis of the results of GLP-1 analog treatment, and the effects on CMRglc 27, we tested the hypothesis that liraglutide is a GLP-1 analog that raises the T max and the clearance from the circulation of glucose by the brain tissue. We determined the values of T max and CMRglc during AD evolution and progression, as reflected in measures of cognition and disease duration. Specifically, we tested the hypothesis that treatment with the GLP-1 analog liraglutide would prevent or reduce the decline of T max, assessed by PET of tracer [18F]FDG derived radioactivity in brain.
Results
Baseline
Group differences at baseline are listed by Gejl et al.27. Disease duration was significantly longer in the liraglutide group (30 ± 6 vs 15 ± 3 months). At baseline the average T max estimate was significantly lower in the treatment group (P = 0.02), compared to the placebo group, with a mean difference of 0.15 µmol/g/min, 95% CI of diff: 0.29; 0.017), as shown in Fig. 1. The liraglutide group was slightly younger (63.1 vs. 66.6 years, P = 0.16), as was the group of six cognitively normal volunteers at 63 ± 3 years29.
Figure 1.
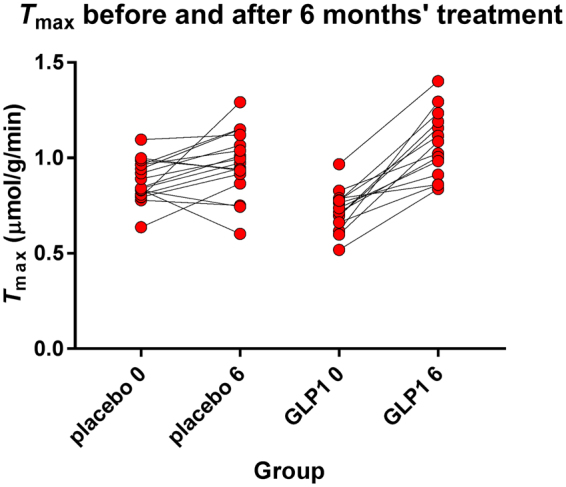
Estimates of T max of two groups before and after liraglutide and placebo treatment. Ordinate T max estimates. GLP-1 analog treatment very significantly (P < 0.0001) raised the average T max estimate in cerebral cortex as a whole. The resulting value of T max significantly exceeded the value reached by placebo treatment.
Group Regressions and Correlations at Baseline
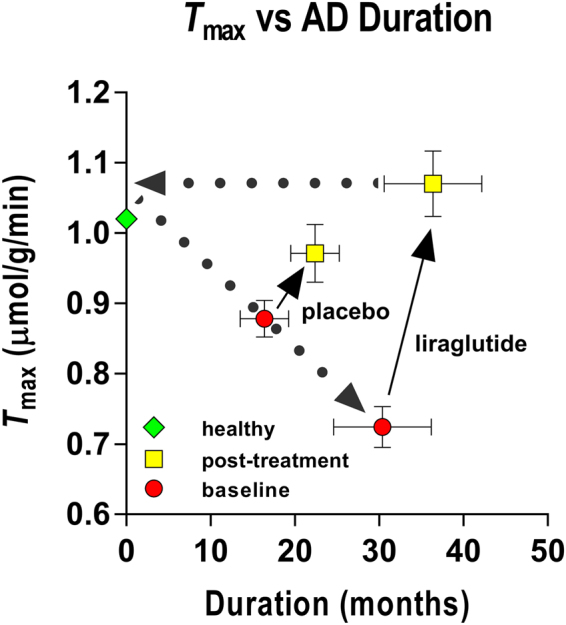
Linear regressions among the variables determined at baseline are shown in Fig. 2: Analysis of CMRglc versus duration of AD revealed a negative correlation (P = 0.006, R2 = 0.23, Fig. 2A) at baseline of both groups pooled. We observed a positive correlation between CMRglc and the total cognition score at baseline of all members of the two groups pooled (P = 0.006, R2 = 0.23, Fig. 2B). We found tendencies of correlation between the T max estimates and the duration of disease (P = 0.05, R2 = 0.12, Fig. 2C) at baseline of all members of the groups pooled, nor between the T max estimates and total cognitive score (P = 0.83, R2 = 0.002, not shown). We found positive linear correlation of glucose utilization fraction (GUF) and cognition (P = 0.01, R2 = 0.21, Fig. 2D) at baseline of both groups pooled, but no correlation between GUF and duration of disease (P = 0.19, R2 = 0.06, not shown), also of all members of the two groups pooled, nor between the unidirectional glucose extraction fraction (GEF) and cognition or duration (P > 0.35, R2 < 0.03, not shown). We also found a positive linear correlation of CMRglc and T max (P = 0.02, R2 = 0.18, Fig. 2E).
Figure 2.

Relationship between duration of AD and CMRglc (A), total cognitive score and CMRglc (B), duration of AD and Tmax, (C), total cognitive score and GUF (D), Tmax and CMRglc (E), and total cognitive score and net clearance of [18F]FDG. The points representing the averages of the healthy control group were not included in the analysis.
We observed a positive correlation between the net clearance of [18F]FDG (and therefore of glucose as well) and the total cognitive score at baseline of both groups pooled (P = 0.02, R2 = 0.17, Fig. 2F). The correlation of the net clearance of [18F]FDG (and therefore of glucose) and the duration of AD was significantly negative (P = 0.007, R2 = 0.22, not shown) at baseline for the members of both groups pooled.
Group Variables, Changes, and Differences During and After Treatment
Gejl et al.27 reported a decrease in fasting plasma glucose in both groups and a significant difference of fasting plasma glucose levels between the two groups after six months of treatment (5.6 mM in the placebo group and 5.1 mM in the GLP-1 analog group). Fasting plasma glucose levels in the heathy group was 5.830. We also noted significant reduction of systolic and diastolic blood pressures in the liraglutide group at the end of the study period.
We observed no change of the cortical T max estimate (P = 0.24, mean difference 0.093 µmol/g/min, 95% CI of difference: −0.037; 0.22) in the placebo group during the six months of treatment. In the GLP-1 analog treatment group, the T max estimate increased significantly after the 6 months of treatment (P < 0.0001, mean difference 0.34 µmol/g/min, 95% CI of the difference 0.20; 0.49), as shown in Fig. 1 of both estimates. After the six months, the T max estimates of the two groups no longer differed significantly (P = 0.24). The estimates of T max increased significantly more in the liraglutide treated group than in the placebo group (P = 0.0002, mean difference 0.25 µmol/g/min, 95% CI of the difference 0.13; 0.37), as shown in Figs 1 and 3. In healthy volunteers, the T max estimates averaged 1.022 umol/g/min, as shown in Fig. 3.
Figure 3.
The GLP-1 analog treatment appeared to reduce the effects of disease duration. The results are consistent with the claims (1) that the maximum blood-brain transfer capacity declines with duration of Alzheimer’s disease, and (2) that GLP-1 analog treatment raises the GLUT1 activity in the barrier as a potential future target for treatment of the neurovascular dysfunction in Alzheimer’s disease. Estimates of K t averaged 9.3 mM (± 0.28 RSDR, robust standard deviation of residuals) in the placebo treated group at baseline, 10.1 mM (± 0.19 RSDR) at six months, and 5.9 mM (± 0.18 RSDR) in the liraglutide group at baseline, and 11.1 mM (± 0.25 RSDR) at six months of treatment. The points representing the averages of the healthy control group were not included in the analysis.
The maximum observable clearance is the ratio of an estimate of T max to the corresponding estimate of the Michaelis half-saturation concentration K t, i.e., the ratio, equal to the abscissa intercept of the Eadie-Hofstee plot. The ratio is a measure of the highest attainable transport capacity at the present affinity of the transporters to glucose. The maximum clearance estimates increased with the duration of disease, as shown in Fig. 4 for the placebo group at baseline and 6 months, and for liraglutide treatment group at baseline. The six months of liraglutide treatment reversed the trend by returning the ratio to the value of the placebo group at baseline. The corresponding estimates of the Michaelis half-saturation concentration are listed in the legend to Fig. 1.
Figure 4.
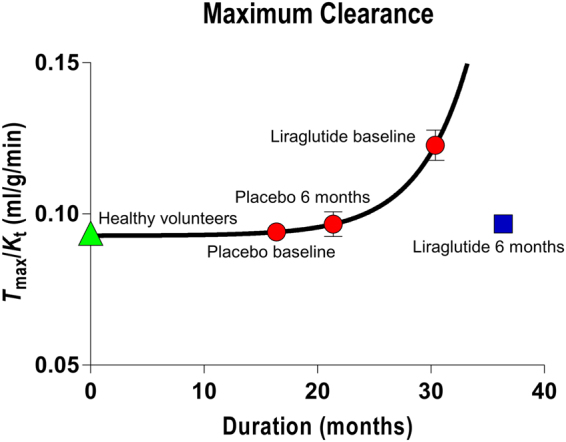
Maximum clearance as function of disease duration of all baseline and placebo treatment groups, and separately for liraglutide group treated for 6 months. Abscissa: Duration (months). Ordinate: Maximum clearance calculated as average of Tmax/Kt ratios for the four groups. Curve represents best fit of exponential growth equation Y = Yo + A exp(−k(X − Xo)) with R2 = 0.4 and parameters + standard errors of Yo = 9.28 + 0.08 ml/hg/min, A = 0.12 + 0.49 ml/hg/min, and k = 0.23 + 0.27 min−1, with Xo fixed at 16.4 months, the average duration of the placebo group members at baseline. The points representing the averages of the healthy control group were not included in the analysis.
The estimates of net clearance of [18F]FDG and glucose (K * and K) did not change in the placebo group (P = 0.53), but increased with borderline significance in the liraglutide group (P = 0.049), as listed in Table 1. We calculated the estimates of CMRglc listed in Table 1 by regional kinetic analysis. The estimates confirmed the decrease in the placebo group (P = 0.05) and unaltered CMRglc in the liraglutide group (P = 0.58) reported by Gejl et al.27. The CMRglc estimates of the healthy control group was 0.31 ± 0.062 umol/g/min29.
Table 1.
Kinetic analysis results.
| Placebo | Vb | K1* | K2* | K3* | Jglc | K | CMRglc | Ctissue | K2 | J2 | K1 | GUF | GEF |
|---|---|---|---|---|---|---|---|---|---|---|---|---|---|
| mean baseline | 0.066 | 0.094 | 0.107 | 0.062 | 0.375 | 0.035 | 0.268 | 1.448 | 0.073 | 0.107 | 0.064 | 0.115 | 0.165 |
| sd | 0.020 | 0.016 | 0.014 | 0.015 | 0.058 | 0.010 | 0.071 | 0.589 | 0.010 | 0.051 | 0.011 | 0.031 | 0.042 |
| mean 6 month | 0.062 | 0.097 | 0.117 | 0.062 | 0.370 | 0.033 | 0.248 | 1.547 | 0.079 | 0.122 | 0.065 | 0.106 | 0.160 |
| sd | 0.014 | 0.013 | 0.029 | 0.024 | 0.059 | 0.008 | 0.062 | 0.516 | 0.019 | 0.049 | 0.009 | 0.029 | 0.043 |
| ttest | 0.35 | 0.53 | 0.20 | 0.37 | 0.69 | 0.53 | 0.05 | 0.36 | 0.20 | 0.12 | 0.53 | 0.21 | 0.49 |
| Liraglutide | Vb | K1* | K2* | K3* | Jglc | K | CMRglc | Ctissue | K2 | J2 | K1 | GUF | GEF |
| mean baseline | 0.065 | 0.102 | 0.131 | 0.064 | 0.383 | 0.034 | 0.246 | 1.531 | 0.089 | 0.137 | 0.069 | 0.106 | 0.165 |
| sd | 0.018 | 0.020 | 0.021 | 0.007 | 0.083 | 0.009 | 0.059 | 0.413 | 0.014 | 0.044 | 0.013 | 0.033 | 0.051 |
| mean 6 month | 0.069 | 0.105 | 0.117 | 0.066 | 0.361 | 0.038 | 0.250 | 1.382 | 0.079 | 0.111 | 0.071 | 0.126 | 0.179 |
| sd | 0.016 | 0.014 | 0.024 | 0.017 | 0.057 | 0.005 | 0.036 | 0.430 | 0.016 | 0.047 | 0.009 | 0.035 | 0.035 |
| ttest | 0.46 | 0.49 | 0.09 | 0.99 | 0.26 | 0.049 | 0.58 | 0.36 | 0.09 | 0.06 | 0.49 | 0.12 | 0.25 |
*paired test, nonparametric.
Discussion
Analogs of the glucagon-like peptide-1 (GLP-1) hold promise as a novel approach to the treatment of neurodegenerative disorders such as AD31. The analogs target cerebral metabolism and neurodegeneration in animal models, with potential translation to afflicted humans27. In the present analysis of findings obtained in patients with AD, we discovered a highly significant effect of the GLP-1 analog liraglutide on the blood-brain glucose transport capacity. In the patients, the estimates of blood-brain glucose transport capacity correlated with the estimates of glucose consumption (CMRglc). We confirmed the natural disease progression in the study population, determined by a negative correlation between disease duration and neuronal activity measured as glucose metabolism and the tendency of the T max estimates to decline with increasing duration of disease. The estimates of metabolism in turn correlated positively with measures of cognition, including the trend towards decreased estimates of cortical CMRglc in the members of the placebo treatment group. The net clearances of [18F]FDG and glucose correlated positively with cognition and negatively with duration at baseline and increased significantly with treatment in the liraglutide group. The glucose utilization fraction (GUF) correlated positively with cognition and in the treatment group numerically exceeded the corresponding estimates of placebo group.
Glucose transport across the BBB is the net result of glucose fluxes in the two directions across both membranes of the capillary endothelium, mediated by glucose transporters of which GLUT1 predominates32. The fluxes across the membranes of the BBB can be regulated (1) by changing the concentration gradients in the directions of the tissue, thereby changing the differences between the fluxes in both directions across the endothelial membranes, (2) by changing the affinity of the transporters separately or jointly for the multiple substrates33, or (3) by changing the number or density of transporters by insertion of new proteins independently of the capillary surface area34. The last of the three mechanisms determines the magnitude of the maximum transport capacity (T max). The present results indicate that changes associated with the GLUT1 transporter can occur by changes of the density of GLUT1 or by changes of the half-saturation or affinity constants. In animal studies, reports suggest that regulation of GLUT1 is essential to preservation of proper brain capillary networking, blood flow, and endothelial integrity, as well as to neuronal function and structure25. Recent results imply that reduced glucose availability in the central nervous system directly triggers behavioral deficits related to the development of neuropathology and synaptic dysfunction mediated by hyperphosphorylated tau proteins35. The GLUT1 deficiency syndrome introduced by, among other authors of the report by DeVivo and Harik36, is an important example of an extreme version of GLUT1 deficiency that leads to a number of neurodegenrative features, of which Alzheimer’s disease may be said to be a milder example.
The present results agree with reports of healthy subjects26, although little is known of the specific effects of GLP-1 and its analogs on brain glucose transport. The claim of a direct effect of GLP-1 or its analogs on the transport of glucose across the BBB therefore remains speculative, but recent work by Jais et al.37 unveils the novel mechanism that vascular endothelial growth factor (VEGF) from macrophages at the BBB restores the presence of GLUT1 to baseline values, maintains CMRglc, and prevents loss of function. It is of particular interest that GLP-1 is coupled to augmented VEGF generation38. The most abundant GLUT in the BBB is GLUT-1, but low levels of other GLUTs (including the insulin sensitive GLUT-4) have been reported6.
The present observation of increased estimates of T max in principle can be explained by increase of the number of GLUTs, prompted by liraglutide, or by subsequent increased postprandial insulin levels. Liraglutide raises GLUT-4 levels in the periphery via an AMPK-dependent mechanism that is independent of insulin39, but recent reports suggest that astrocytic insulin receptors modulate GLUT1 expression, and consequently GLUT1 protein levels at the cell membrane40. Moreover, insulin signalling in hypothalamic astrocytes supposedly contributes to glucose sensing in the central nervous system and systemic glucose metabolism by regulation of glucose uptake across the BBB41, in agreement with the present results, as GLP-1 potentially co-regulates the expression of hypothalamic insulin, although the mechanism is debated42. We note that liraglutide does not appear to cross the BBB of cerebral cortex43, suggesting direct effects on the barrier, or peripheral effects of receptor stimulation, e.g., anti-inflammatory44, potentially interfering with the reported decline of CMRglc in AD.
The average value of the T max of 1.02 umol/g/min in healthy volunteers agreed with values from Choi et al.45 who fitted the standard Michaelis–Menten equation to the measured brain glucose concentrations. As a function of plasma glucose, the regression yielded values of Michaelis constant K t of 11.8 ± 1.6 mmol/L and a T max/CMRglc ratio of 4.7 ± 0.14. Similarly, De Graaf et al.46 reported values of the T max/CMRglc ratio that averaged 3.2 ± 0.10 and 3.9 ± 0.15 for gray matter and white matter using the standard transport model, with K t of 6.2 ± 0.85 and 7.3 ± 1.1 mmol/L for gray matter and white matter. For an average whole-brain glucose consumption rate of 0.25 umol/g/min, the corresponding T max estimates average close to 1 umol/g/min with an average Michaelis constant of 8.4 mmol/l. Direct T max estimates by Brooks et al.; Feinendegen et al., and Blomqvist et al.47–49 averaged 0.9 umol/g/min, with an average Michaelis constant of 3.7 mM. Measurements of blood-brain unidirectional cleance of glucose (K1)48–53, averaged 0.08 ml/g/min for K1 and 0.34 umol/g/min for the blood-brain glucose flux (J1 = K1 Ca). The canonical T max estimate for glucose transport across the human blood-brain barrier was listed by Gjedde54 as 1 umol/g/min.
The prevention of decline of CMRglc is associated with an effect of liraglutide on the T max estimates. The effect may represent a possible reversal of the expected down-regulation of the brain glucose transporters that are required for glucose uptake and metabolism in the brain19. We note that the finding of reduced glucose transport capacity in AD presented here may also to some extent reflect lower neuronal activity and/or loss of neuronal cell mass, raising the issue of the unresolved identification of cause and effect. Although the present population of patients only revealed a tendency towards a direct correlation with disease duration, animal studies show that BBB breakdown occurs before the development of functional deficits25. The reversal of the duration-related increase of the estimates of maximum clearance () is a further indication that a potentially important mechanism of disease advance with duration is the increase of affinity of the transporters to glucose that causes the maximum clearance to increase, as the maximum transport capacity declines. The treatment with liraglutide reverses both of these trends, jointly expressed as a normalization of the estimates of maximum clearance.
Aging and neurodegenerative disorders have been shown to be associated with increased lactate concentration55, and lactate has been observed to play an important role in the regulation of cerebral blood flow56,57, implying that higher lactate production is associated with higher blood flow rates. One prediction from this association is higher blood flow rates relative to glucose consumption in these states, including lowering of the glucose utilization or net extraction fraction (GUF) in aging and neurodegenerative disorders. In agreement with these findings, we report a positive correlation between cognitive scores and GUF estimates in the patients from both groups at baseline. In addition, we report that the GLP-1 analog treatment is associated with insignificantly higher GUF estimates and significantly increased net clearances of [18F]FDG and glucose in the treatment group, compared to the placebo group, with numerical tendencies towards an increase of GUF estimates in the treatment group and a decline of GUF estimates in the placebo group (although neither trend is significant).
As predicted, the estimates of CMRglc declined with disease duration, indicating the natural progression of the disease in this group of patients, signifying the conclusion that GLP-1 receptor stimulation halts the progression of Alzheimer’s disease, in association with a very significant increase of the T max estimates. The decline of CMRglc estimates coincided with the decline of cognitive functioning, as previously reported11. As the restoration of brain glucose levels and metabolism is likely to positively influence AD pathology35, this is a potentially novel approach to prevention or termination of disease progression.
Limitations
The AD duration measure determined as the time from definite diagnosis naturally has considerable uncertainty. The fact that the inclusion criteria were solely clinical, potentially limits the accuracy of the duration measure58. A further caveat is the small subject sample sizes. Regardless of blinding and randomization, minor differences in the baseline characteristics of the treated and placebo groups influence subsequent disease progression and hence affect the therapeutic impact. In larger studies, randomization would be more likely to balance the treated and untreated groups. Despite the extensive evidence of the relation between CMRglc and cognition, also as reported in a study of this size, the interpretation of measures of cognition in the current paper is of course speculative. While the trial was conducted as a randomized, placebo-controlled, double-blinded intervention study, and the PET analysis was carried out by an author blinded to the group and subject definitions (KV), the findings are the results of post-hoc analysis and as such were not obtained in a blinded fashion.
Conclusion
In the present study, we report the evidence that prevention of the decline of CMRglc is associated with improvement of BBB glucose transport capacity, detected as differences of estimates of the maximum capacity of blood-brain transfer of glucose (T max), interpreted as a crucial element of disease progression and duration, responsible for possible limitations of nutrient delivery. The evidence extends the previous discovery of an effect of GLP-1 on maximum blood-brain glucose transfer capacity in healthy human volunteers, reported by Gejl et al.26. The change of T max estimates occurred in relation to changes of the net clearance of glucose, and net glucose consumption (CMRglc), both as functions of disease duration and cognitive ability. Thus, the restoration of brain glucose availability and neuronal metabolism with GLP-1 or an analog potentially protects against cognitive impairment in Alzheimer’s disease.
Methods
Study design and participants
In the present investigation, we completed a 26-week, randomized, placebo-controlled, double-blinded intervention with liraglutide or placebo in patients with AD, recruited from dementia clinics in Central Denmark, with key clinical inclusion and exclusion criteria and administrative details listed by Gejl et al.27.
We assigned 38 patients to receive either the GLP-1 analog liraglutide (n = 18) or placebo (n = 20), as described by Gejl et al.27. Of these, 14 patients had PET with [18F]FDG before and after treatment, compared to 19 patients who received placebo, all of whom completed the cognitive examination. Tomography sessions for CMRglc were incomplete in two patients, leaving 17 patients from the placebo group and 14 patients from the liraglutide group in the final analysis of [18F]FDG-derived radioactivity. Demographic and clinical characteristics are described in Gejl et al.27. The AD duration measure was determined as the time from definite diagnosis.
Patients willing to participate gave written informed consent. Safety data were monitored independently throughout the study period. The study was conducted according to the principles of the Helsinki Declaration. The Central Denmark Regional Committees on Biomedical Research Ethics, the Danish Data Protection Agency, and the Danish Medicines Agency approved the protocol59, with trial registration at ClinicalTrials.gov: NCT01469351, November 1, 2011. Participants attended a screening visit to assess eligibility followed by randomization to liraglutide or placebo for 26 weeks. Liraglutide was administered as 0.6 mg subcutaneously daily for one week; hereafter 1.2 mg daily for one week, before final increase to 1.8 mg daily. The placebo group members received saline in similar volumes.
Positron Emission Tomography
The subjects underwent PET of [18F]FDG uptake and metabolism, as described in previous dynamic [18F]FDG studies of brain metabolism26,60.
Co-registration
We acquired anatomical images for co-registration with the 3 T Magnetom Tim Trio system (Siemens Healthcare, Erlangen, Germany) with 3D T1-weighted high-resolution anatomic scan of magnetization-prepared rapid acquisition gradient echo (MPRAGE) sequence. We co-registered PET images with individual MR images to an MR template, and evaluated the quality of each co-registration by visual inspection in 3 planes. PET and MR-images were co-registered and entered in Talairach space, and anatomical volumes of interest were used to extract time-activity-curves (TACs) from the dynamic PET images for the [18F]FDG analyses of cortex as a whole.
Cognitive Testing
We evaluated cognition by the “Brief cognitive examination” from the Wechsler Memory Scale (WMS-IV)61, the test examines examining orientation, time estimation, mental control, clock drawing, incidental recall, inhibition and verbal reproduction.
Kinetic Analysis
The primary outcome was the maximum glucose transport capacity of the BBB (T max.) assessed with [18F]FDG. We also determined magnitudes of unidirectional glucose extraction fraction (GEF) from measures of [18F]FDG uptake and blood flow, the latter as reported by Gejl et al.27. Using a 3-compartment model, we obtained values of . (unidirectional clearance where symbols marked with asterisk indicate tracer [18F]FDG), . (efflux rate constant), (phosphorylation rate constant) and (volume of brain occupied by intravascular blood) for [18F]FDG. The absolute dephosphorylation flux and the absolute quantity of [18F]FDG were both considered negligible during the scanning period. In the use of [18F]FDG to trace glucose metabolism, the “lumped constant” (LC) is a necessary isotope correction factor that we set to the value of 0.7627. T ratio between unidirectional clearances of [18F]FDG and glucose (τ) was set at the value of 1.48 and the phosphorylation ratio (ϕ) at the value of 0962. T net clearance of [18F]FDG then is given by63,
| 1 |
where K * and are the net and unidirectional blood-brain clearances of [18F]FDG, and , and are the corresponding rate constants of [18F]FDG-derived radioactivity exchanges between circulation and the [18F]FDG precursor pool mediated by GLUT1 and hexokinase. The unidirectional glucose flux from blood into brain was calculated from the unidirectional [18F]FDG clearance as,
| 2 |
where J 1 is the unidirectional flux of glucose (rather than [18F]FDG) from blood to brain, C a is the arterial plasma glucose concentration, and τ is the affinity ratio of [18F]FDG to glucose for blood-brain transfer across the BBB. The net clearance of glucose by definition is
| 3 |
where is the “lumped constant”, defined above as the ratio of the net clearances of [18F]FDG and glucose, such that the net cerebral metabolic rate for glucose is calculated from the net [18F]FDG clearance as,
| 4 |
such that the cerebral tissue glucose concentration is
| 5 |
and the flux of glucose from brain to blood, , is
| 6 |
Here, the unidirectional glucose extraction fraction (GEF) by definition is where F is cerebral blood flow, while the glucose utilization fraction (GUF), also by definition, is . We determined the blood-brain unidirectional clearance, defined as,
| 7 |
from the values of flux and concentration, while the glucose clearance from brain tissue to the circulation (K 2) likewise was determined from the brain-blood flux and brain tissue concentration of glucose, as,
| 8 |
Michaelis-Menten analysis
Together, the two sets of values of clearance and corresponding fluxes (K 1, J 1 and K 2, J 2) depend on the affinity and maximum transport capacity of glucose across the BBB, as implemented twice in the linearized Eadie-Hofstee Plot version of the Michaelis-Menten equation64–66, both for the blood-brain transfer direction,
| 9 |
and for the brain-blood transfer direction,
| 10 |
from which we calculated the parameters T max and K t by multilinear regression, yielding a shared estimate of K t for all members of the group and individual estimates of T max for each member.
Control group
We obtained a control estimate of the maximum glucose transport across the blood-brain barrier from published measurements by Kuwabara et al.29 that we analyzed in the same manner as the estimates in the four groups of patients with Alzheimer’s disease, after correction for the lower resolution and greater partial volume effect of PET before the 21st Century (radioactivities increased by 1.33 for cerebral cortex).
Statistics
We analyzed treatment group data in two ways: We analyzed changes of kinetic variables by paired t-tests within groups, and changes of T max with 2-way ANOVA of qui-squared with Tukey’s correction for multiple comparisons within and between groups. P-values less than 0.05 were considered indicative of significant difference. Spearman and Pearson’s r tests were used to evaluate correlations, implemented in GraphPad Prism (GraphPad Software, San Diego, CA) and PMOD (PMOD Technologies Ltd., Zürich, Switzerland).
Acknowledgements
The authors thank the trial staff and subjects. The expert technical assistance of Arne Møller, Søren B. Hansen, Anders Rodell, and Anna Schacht at PET Center and Department of Anesthesiology, Aarhus University Hospital is gratefully acknowledged. They also thank Hans Brændgaard and Hanne Gottrup, Dementia Clinic, Department of Neurology, Aarhus University Hospital, Aarhus, Denmark for patient assessments and recruitment and Bo Martin Bibby, Department of Biostatistics, University of Aarhus for statistical counseling. This investigator-initiated and -driven trial was supported by an unrestricted research grants from Health Research Fund of Central Denmark Region, Novo Nordisk Scandinavia and Aarhus University. No funding source had any role in study design, data collection, data analysis, data interpretation or the preparation of this article. The authors had full access to all data in the study and final responsibility for the decision to submit for publication.
Author Contributions
L.E., J.R. and B.B. conceived the study. B.B., A.G., B.B. and J.R. designed the study. M.G., K.V. and A.G. did imaging data pre- and postprocessing and statistical analysis. L.E., B.B. and J.R. did patient assessments. M.G., B.B., J.R. and A.G. wrote the report and all authors approved the final version.
Competing Interests
M. Gejl: None. B. Brock: Board Member; Author; Allergan, Inc., Novo Nordisk A/S. Research Support. Speaker’s Bureau; Pfizer Inc. L. Egefjord: None. K. Vang: None J. Rungby: Advisory Panel; Merck & Co., Inc., Novo Nordisk A/S, Eli Lilly and Company, Sanofi U.S.. Employee; Spouse/Partner; Novo Nordisk A/S. Research Support; Novo Nordisk A/S, Eli Lilly and Company, Amylin Pharmaceuticals, LLC. Speaker’s Bureau; Merck & Co., Inc., Novo Nordisk A/S, Johnson & Johnson, Sanofi U.S., AstraZeneca/Bristol-Myers Squibb. A. Gjedde: Advisory panel; Executive Council, European Dana Alliance for the Brain, European Research Council. Consultant; National Expert, Horizon2020 SC1 PC Health, European Commission, Novo-Nordisk A/S. Research support; Danish Council of Independent Research, National Institutes of Health BRAIN Initiative. Speaker’s bureau; MINDexult. Stocks/shareholder; Danske Bank.
Footnotes
Publisher's note: Springer Nature remains neutral with regard to jurisdictional claims in published maps and institutional affiliations.
References
- 1.Barnes DE, Yaffe K. The projected effect of risk factor reduction on Alzheimer’s disease prevalence. Lancet Neurol. 2011;10:819–828. doi: 10.1016/S1474-4422(11)70072-2. [DOI] [PMC free article] [PubMed] [Google Scholar]
- 2.Gejl M, Rungby J, Brock B, Gjedde A. At the centennial of Michaelis and Menten, competing Michaelis-Menten steps explain effect of GLP-1 on blood-brain transfer and metabolism of glucose. Basic Clin Pharmacol Toxicol. 2014;115:162–171. doi: 10.1111/bcpt.12240. [DOI] [PubMed] [Google Scholar]
- 3.Allen A, Messier C. Plastic changes in the astrocyte GLUT1 glucose transporter and beta-tubulin microtubule protein following voluntary exercise in mice. Behav Brain Res. 2013;240:95–102. doi: 10.1016/j.bbr.2012.11.025. [DOI] [PubMed] [Google Scholar]
- 4.Choeiri C, Staines W, Miki T, Seino S, Messier C. Glucose transporter plasticity during memory processing. Neuroscience. 2005;130:591–600. doi: 10.1016/j.neuroscience.2004.09.011. [DOI] [PubMed] [Google Scholar]
- 5.Zeller K, Rahner-Welsch S, Kuschinsky W. Distribution of Glut1 glucose transporters in different brain structures compared to glucose utilization and capillary density of adult rat brains. J Cereb Blood Flow Metab. 1997;17:204–209. doi: 10.1097/00004647-199702000-00010. [DOI] [PubMed] [Google Scholar]
- 6.Patching SG. Glucose Transporters at the Blood-Brain Barrier: Function, Regulation and Gateways for Drug Delivery. Mol Neurobiol. 2016 doi: 10.1007/s12035-015-9672-6. [DOI] [PubMed] [Google Scholar]
- 7.Wilson CM, Mitsumoto Y, Maher F, Klip A. Regulation of cell surface GLUT1, GLUT3, and GLUT4 by insulin and IGF-I in L6 myotubes. FEBS Lett. 1995;368:19–22. doi: 10.1016/0014-5793(95)00589-2. [DOI] [PubMed] [Google Scholar]
- 8.Yang J, Holman GD. Comparison of GLUT4 and GLUT1 subcellular trafficking in basal and insulin-stimulated 3T3-L1 cells. J Biol Chem. 1993;268:4600–4603. [PubMed] [Google Scholar]
- 9.Zlokovic BV. Neurovascular pathways to neurodegeneration in Alzheimer’s disease and other disorders. Nat Rev Neurosci. 2011;12:723–738. doi: 10.1038/nrn3114. [DOI] [PMC free article] [PubMed] [Google Scholar]
- 10.Landau SM, et al. Amyloid deposition, hypometabolism, and longitudinal cognitive decline. Ann Neurol. 2012;72:578–586. doi: 10.1002/ana.23650. [DOI] [PMC free article] [PubMed] [Google Scholar]
- 11.Engler H, et al. Two-year follow-up of amyloid deposition in patients with Alzheimer’s disease. Brain. 2006;129:2856–2866. doi: 10.1093/brain/awl178. [DOI] [PubMed] [Google Scholar]
- 12.Nordberg A, Rinne JO, Kadir A, Langstrom B. The use of PET in Alzheimer disease. Nat Rev Neurol. 2010;6:78–87. doi: 10.1038/nrneurol.2009.217. [DOI] [PubMed] [Google Scholar]
- 13.Hunt A, et al. Reduced cerebral glucose metabolism in patients at risk for Alzheimer’s disease. Psychiatry Res. 2007;155:147–154. doi: 10.1016/j.pscychresns.2006.12.003. [DOI] [PubMed] [Google Scholar]
- 14.Mosconi L, et al. Hypometabolism exceeds atrophy in presymptomatic early-onset familial Alzheimer’s disease. J Nucl Med. 2006;47:1778–1786. [PubMed] [Google Scholar]
- 15.Mosconi L, et al. Multicenter standardized 18F-FDG PET diagnosis of mild cognitive impairment, Alzheimer’s disease, and other dementias. J Nucl Med. 2008;49:390–398. doi: 10.2967/jnumed.107.045385. [DOI] [PMC free article] [PubMed] [Google Scholar]
- 16.Samuraki M, et al. Partial volume effect-corrected FDG PET and grey matter volume loss in patients with mild Alzheimer’s disease. Eur J Nucl Med Mol Imaging. 2007;34:1658–1669. doi: 10.1007/s00259-007-0454-x. [DOI] [PubMed] [Google Scholar]
- 17.Liu Y, Liu F, Grundke-Iqbal I, Iqbal K, Gong CX. Brain glucose transporters, O-GlcNAcylation and phosphorylation of tau in diabetes and Alzheimer’s disease. J Neurochem. 2009;111:242–249. doi: 10.1111/j.1471-4159.2009.06320.x. [DOI] [PMC free article] [PubMed] [Google Scholar]
- 18.Liu Y, Liu F, Grundke-Iqbal I, Iqbal K, Gong CX. Deficient brain insulin signalling pathway in Alzheimer’s disease and diabetes. J Pathol. 2011;225:54–62. doi: 10.1002/path.2912. [DOI] [PMC free article] [PubMed] [Google Scholar]
- 19.Liu Y, Liu F, Iqbal K, Grundke-Iqbal I, Gong CX. Decreased glucose transporters correlate to abnormal hyperphosphorylation of tau in Alzheimer disease. FEBS Lett. 2008;582:359–364. doi: 10.1016/j.febslet.2007.12.035. [DOI] [PMC free article] [PubMed] [Google Scholar]
- 20.Guo X, Geng M, Du G. Glucose transporter 1, distribution in the brain and in neural disorders: its relationship with transport of neuroactive drugs through the blood-brain barrier. Biochem Genet. 2005;43:175–187. doi: 10.1007/s10528-005-1510-5. [DOI] [PubMed] [Google Scholar]
- 21.Mooradian AD, Chung HC, Shah GN. GLUT-1 expression in the cerebra of patients with Alzheimer’s disease. Neurobiol Aging. 1997;18:469–474. doi: 10.1016/S0197-4580(97)00111-5. [DOI] [PubMed] [Google Scholar]
- 22.Simpson IA, Chundu KR, Davies-Hill T, Honer WG, Davies P. Decreased concentrations of GLUT1 and GLUT3 glucose transporters in the brains of patients with Alzheimer’s disease. Ann Neurol. 1994;35:546–551. doi: 10.1002/ana.410350507. [DOI] [PubMed] [Google Scholar]
- 23.Jagust WJ, et al. Diminished glucose transport in Alzheimer’s disease: dynamic PET studies. J Cereb Blood Flow Metab. 1991;11:323–330. doi: 10.1038/jcbfm.1991.65. [DOI] [PubMed] [Google Scholar]
- 24.Piert M, Koeppe RA, Giordani B, Berent S, Kuhl DE. Diminished glucose transport and phosphorylation in Alzheimer’s disease determined by dynamic FDG-PET. J Nucl Med. 1996;37:201–208. [PubMed] [Google Scholar]
- 25.Winkler EA, et al. GLUT1 reductions exacerbate Alzheimer’s disease vasculo-neuronal dysfunction and degeneration. Nat Neurosci. 2015;18:521–530. doi: 10.1038/nn.3966. [DOI] [PMC free article] [PubMed] [Google Scholar]
- 26.Gejl M, et al. Glucagon-like peptide-1 (GLP-1) raises blood-brain glucose transfer capacity and hexokinase activity in human brain. Front Neuroenergetics. 2013;5:2. doi: 10.3389/fnene.2013.00002. [DOI] [PMC free article] [PubMed] [Google Scholar]
- 27.Gejl M, et al. In Alzheimer’s Disease, 6-Month Treatment with GLP-1 Analog Prevents Decline of Brain Glucose Metabolism: Randomized, Placebo-Controlled, Double-Blind Clinical Trial. Front Aging Neurosci. 2016;8:108. doi: 10.3389/fnagi.2016.00108. [DOI] [PMC free article] [PubMed] [Google Scholar]
- 28.Kelly P, et al. Restoration of cerebral and systemic microvascular architecture in APP/PS1 transgenic mice following treatment with Liraglutide. Microcirculation. 2015;22:133–145. doi: 10.1111/micc.12186. [DOI] [PubMed] [Google Scholar]
- 29.Kuwabara H, Evans AC, Gjedde A. Michaelis-Menten constraints improved cerebral glucose metabolism and regional lumped constant measurements with [18F]fluorodeoxyglucose. J Cereb Blood Flow Metab. 1990;10:180–189. doi: 10.1038/jcbfm.1990.33. [DOI] [PubMed] [Google Scholar]
- 30.Kuwabara H, Gjedde A. Measurements of glucose phosphorylation with FDG and PET are not reduced by dephosphorylation of FDG-6-phosphate. J Nucl Med. 1991;32:692–698. [PubMed] [Google Scholar]
- 31.Hölscher C. Glucagon-like peptide 1 and glucose-dependent insulinotropic polypeptide analogues as novel treatments for Alzheimer’s and Parkinson’s disease. Cardiovascular Endocrinology. 2016;5:93–98. doi: 10.1097/XCE.0000000000000087. [DOI] [Google Scholar]
- 32.Gjedde A, Christensen O. Estimates of Michaelis-Menten constants for the two membranes of the brain endothelium. J Cereb Blood Flow Metab. 1984;4:241–249. doi: 10.1038/jcbfm.1984.33. [DOI] [PubMed] [Google Scholar]
- 33.Fuglsang A, Lomholt M, Gjedde A. Blood-brain transfer of glucose and glucose analogs in newborn rats. J Neurochem. 1986;46:1417–1428. doi: 10.1111/j.1471-4159.1986.tb01757.x. [DOI] [PubMed] [Google Scholar]
- 34.Leybaert L. Neurobarrier coupling in the brain: a partner of neurovascular and neurometabolic coupling? J Cereb Blood Flow Metab. 2005;25:2–16. doi: 10.1038/sj.jcbfm.9600001. [DOI] [PubMed] [Google Scholar]
- 35.Lauretti E, Li JG, Di Meco A, Pratico D. Glucose deficit triggers tau pathology and synaptic dysfunction in a tauopathy mouse model. Transl Psychiatry. 2017;7:e1020. doi: 10.1038/tp.2016.296. [DOI] [PMC free article] [PubMed] [Google Scholar]
- 36.De Vivo DC, et al. Defective glucose transport across the blood-brain barrier as a cause of persistent hypoglycorrhachia, seizures, and developmental delay. N Engl J Med. 1991;325:703–709. doi: 10.1056/NEJM199109053251006. [DOI] [PubMed] [Google Scholar]
- 37.Jais A, et al. Myeloid-Cell-Derived VEGF Maintains Brain Glucose Uptake and Limits Cognitive Impairment in Obesity. Cell. 2016;165:882–895. doi: 10.1016/j.cell.2016.03.033. [DOI] [PubMed] [Google Scholar]
- 38.Xiao-Yun X, Zhao-Hui M, Ke C, Hong-Hui H, Yan-Hong X. Glucagon-like peptide-1 improves proliferation and differentiation of endothelial progenitor cells via upregulating VEGF generation. Med Sci Monit. 2011;17:BR35–41. doi: 10.12659/MSM.881383. [DOI] [PMC free article] [PubMed] [Google Scholar]
- 39.Andreozzi F, et al. The GLP-1 receptor agonists exenatide and liraglutide activate Glucose transport by an AMPK-dependent mechanism. J Transl Med. 2016;14:229. doi: 10.1186/s12967-016-0985-7. [DOI] [PMC free article] [PubMed] [Google Scholar]
- 40.Hernandez-Garzon E, et al. The insulin-like growth factor I receptor regulates glucose transport by astrocytes. Glia. 2016 doi: 10.1002/glia.23035. [DOI] [PubMed] [Google Scholar]
- 41.Garcia-Caceres C, et al. Astrocytic Insulin Signaling Couples Brain Glucose Uptake with Nutrient Availability. Cell. 2016;166:867–880. doi: 10.1016/j.cell.2016.07.028. [DOI] [PMC free article] [PubMed] [Google Scholar]
- 42.Madadi G, Dalvi PS, Belsham DD. Regulation of brain insulin mRNA by glucose and glucagon-like peptide 1. Biochem Biophys Res Commun. 2008;376:694–699. doi: 10.1016/j.bbrc.2008.09.054. [DOI] [PubMed] [Google Scholar]
- 43.Secher A, et al. The arcuate nucleus mediates GLP-1 receptor agonist liraglutide-dependent weight loss. J Clin Invest. 2014;124:4473–4488. doi: 10.1172/JCI75276. [DOI] [PMC free article] [PubMed] [Google Scholar]
- 44.Bak AM, et al. Targeting amyloid-beta by glucagon-like peptide -1 (GLP-1) in Alzheimer’s disease and diabetes. Expert Opin Ther Targets. 2011;15:1153–1162. doi: 10.1517/14728222.2011.600691. [DOI] [PubMed] [Google Scholar]
- 45.Choi IY, Lee SP, Kim SG, Gruetter R. In vivo measurements of brain glucose transport using the reversible Michaelis-Menten model and simultaneous measurements of cerebral blood flow changes during hypoglycemia. J Cereb Blood Flow Metab. 2001;21:653–663. doi: 10.1097/00004647-200106000-00003. [DOI] [PubMed] [Google Scholar]
- 46.de Graaf RA, et al. Differentiation of glucose transport in human brain gray and white matter. J Cereb Blood Flow Metab. 2001;21:483–492. doi: 10.1097/00004647-200105000-00002. [DOI] [PubMed] [Google Scholar]
- 47.Blomqvist G, et al. Facilitated transport of glucose from blood to brain in man and the effect of moderate hypoglycaemia on cerebral glucose utilization. Eur J Nucl Med. 1991;18:834–837. doi: 10.1007/BF00175064. [DOI] [PubMed] [Google Scholar]
- 48.Brooks DJ, et al. Glucose transport across the blood-brain barrier in normal human subjects and patients with cerebral tumours studied using [11C]3-O-methyl-D-glucose and positron emission tomography. J Cereb Blood Flow Metab. 1986;6:230–239. doi: 10.1038/jcbfm.1986.36. [DOI] [PubMed] [Google Scholar]
- 49.Feinendegen LE, Herzog H, Wieler H, Patton DD, Schmid A. Glucose transport and utilization in the human brain: model using carbon-11 methylglucose and positron emission tomography. J Nucl Med. 1986;27:1867–1877. [PubMed] [Google Scholar]
- 50.Brooks DJ, et al. Regional cerebral glucose transport in insulin-dependent diabetic patients studied using [11C]3-O-methyl-D-glucose and positron emission tomography. J Cereb Blood Flow Metab. 1986;6:240–244. doi: 10.1038/jcbfm.1986.37. [DOI] [PubMed] [Google Scholar]
- 51.Gutniak M, et al. D-[U-11C]glucose uptake and metabolism in the brain of insulin-dependent diabetic subjects. Am J Physiol. 1990;258:E805–812. doi: 10.1152/ajpendo.1990.258.5.E805. [DOI] [PubMed] [Google Scholar]
- 52.Hertz MM, Paulson OB. Transfer across the human blood-brain barrier: evidence for capillary recruitment and for a paradox glucose permeability increase in hypocapnia. Microvasc Res. 1982;24:364–376. doi: 10.1016/0026-2862(82)90023-1. [DOI] [PubMed] [Google Scholar]
- 53.Hertz MM, Paulson OB, Barry DI, Christiansen JS, Svendsen PA. Insulin increases glucose transfer across the blood-brain barrier in man. J Clin Invest. 1981;67:597–604. doi: 10.1172/JCI110073. [DOI] [PMC free article] [PubMed] [Google Scholar]
- 54.Gjedde, A. in Handbook of Experimental Pharmacology Ch. 6a, 65–115 (Springer-Verlag, Berlin Heidelberg, 1992).
- 55.Ross JM, et al. High brain lactate is a hallmark of aging and caused by a shift in the lactate dehydrogenase A/B ratio. Proc Natl Acad Sci USA. 2010;107:20087–20092. doi: 10.1073/pnas.1008189107. [DOI] [PMC free article] [PubMed] [Google Scholar]
- 56.Bergersen LH, Gjedde A. Is lactate a volume transmitter of metabolic states of the brain? Front Neuroenergetics. 2012;4:5. doi: 10.3389/fnene.2012.00005. [DOI] [PMC free article] [PubMed] [Google Scholar]
- 57.Gordon GR, Choi HB, Rungta RL, Ellis-Davies GC, MacVicar BA. Brain metabolism dictates the polarity of astrocyte control over arterioles. Nature. 2008;456:745–749. doi: 10.1038/nature07525. [DOI] [PMC free article] [PubMed] [Google Scholar]
- 58.Beach TG, Monsell SE, Phillips LE, Kukull W. Accuracy of the clinical diagnosis of Alzheimer disease at National Institute on Aging Alzheimer Disease Centers, 2005-2010. J Neuropathol Exp Neurol. 2012;71:266–273. doi: 10.1097/NEN.0b013e31824b211b. [DOI] [PMC free article] [PubMed] [Google Scholar]
- 59.Egefjord L, et al. Effects of liraglutide on neurodegeneration, blood flow and cognition in Alzheimer s disease - protocol for a controlled, randomized double-blinded trial. Dan Med J. 2012;59:A4519. [PubMed] [Google Scholar]
- 60.Gejl M, et al. Glucagon-like peptide-1 decreases intracerebral glucose content by activating hexokinase and changing glucose clearance during hyperglycemia. J Cereb Blood Flow Metab. 2012;32:2146–2152. doi: 10.1038/jcbfm.2012.118. [DOI] [PMC free article] [PubMed] [Google Scholar]
- 61.Hilsabeck RC, et al. The Brief Cognitive Status Examination (BCSE): Comparing Diagnostic Utility and Equating Scores to the Mini-Mental State Examination (MMSE) Arch Clin Neuropsychol. 2015;30:458–467. doi: 10.1093/arclin/acv037. [DOI] [PubMed] [Google Scholar]
- 62.Hasselbalch SG, Madsen PL, Knudsen GM, Holm S, Paulson OB. Calculation of the FDG lumped constant by simultaneous measurements of global glucose and FDG metabolism in humans. J Cereb Blood Flow Metab. 1998;18:154–160. doi: 10.1097/00004647-199802000-00005. [DOI] [PubMed] [Google Scholar]
- 63.Gjedde A. Calculation of cerebral glucose phosphorylation from brain uptake of glucose analogs in vivo: a re-examination. Brain Res. 1982;257:237–274. doi: 10.1016/0165-0173(82)90018-2. [DOI] [PubMed] [Google Scholar]
- 64.Eadie GS. On the evaluation of the constants Vm and Km in enzyme reactions. Science. 1952;116:688. doi: 10.1126/science.116.3025.688. [DOI] [PubMed] [Google Scholar]
- 65.Gejl, M. & Gjedde A. Brain glucose metabolism [internet]. 2014 Oct 29; Diapedia 5105374816 rev. no. 10. 10.14496/dia.5105374816.10.
- 66.Hofstee BH. Graphical analysis of single enzyme systems. Enzymologia. 1956;17:273–278. [PubMed] [Google Scholar]