Abstract
Although the genome is generally thought to be transcriptionally silent during mitosis, technical limitations have prevented sensitive mapping of transcription during mitosis and mitotic exit. Thus, the means by which the interphase expression pattern is transduced to daughter cells have been unclear. We used 5-ethynyluridine to pulse-label transcripts during mitosis and mitotic exit and find that many genes exhibit transcription during mitosis, as confirmed by FITC-UTP labeling, RNA FISH, and RT-qPCR. The first round of transcription immediately following mitosis primarily activates genes involved in the growth and rebuilding of daughter cells, rather than cell type-specific functions. We propose that the cell’s transcription pattern is largely retained at a low level through mitosis, whereas the amplitude of transcription observed in interphase is re-established during mitotic exit.
During mitosis, chromatin condenses (1), gene regulatory machinery is largely evicted from chromatin (2–4), and transcription is thought to be silenced (5–7). Yet reactivation of a specific gene expression program is needed to maintain cell identity during exit from mitosis. Long-distance interactions across the genome are lost during mitosis (8), as is hypersensitivity at distal enhancers, but not at promoters (9). “Bookmarking” transcription factors remain bound in mitosis to a subset of their interphase sites (10–15). Knock-down of these factors during mitosis delays reactivation of target genes (10, 11, 13), though the proper transcriptome is eventually regenerated. Thus the basis for identity maintenance during mitosis remains unclear, and the hierarchy by which genes are reactivated during mitotic exit is not understood.
Because of nuclear envelope breakdown in mitosis and hence the inability to isolate nuclei for direct labeling of transcripts (16), genome-wide studies during mitotic exit used RNA Polymerase II (RNAP2) cross-linking to assess active transcription (4, 17) and found a burst in RNAP2 binding to promoters approximately 60–90 minutes after release from mitotic arrest (17). However, the dynamic range of antibody-based methods is much less than from direct measurements of nascent transcription and crosslinking artifactually causes protein exclusion from mitotic chromatin (14, 18). Transcription elongation inhibition of prometaphase HeLa cells elicits paused RNAP2 at promoters, suggesting the presence of elongating enzyme, even though elongating RNAP2 was not detected directly (19). The study also mapped non-polyadenylated, chromatin-associated RNAs from prometaphase cells, but it was unclear whether these RNAs were transcribed during mitosis or, as suggested by the authors, at the G2/M transition. A study of pulse-labeled transcripts in arrested MCF-7 human breast cancer cells used nuclear isolation for BrUTP labeling and hence did not appear to be assessing mitotic cells (20).
To define the timing of transcription events during mitotic exit, we used the cell-permeable 5-ethynyluridine (EU) to pulse-label nascent transcripts (21) in intact HUH7 human hepatoma cells during nocodazole-induced mitotic arrest, mitotic exit, and in asynchronous cells. Importantly, arrested cells, enriched by mitotic shake-off, were highly pure (fig. S1A–D) and re-enter G1 (fig. S1E–K). Previously, we labeled transcripts with EU during mitotic exit in HUH7 cells and attached azide-fluorophore, discovering that bulk global transcription initiates approximately 80′ after nocodazole wash-out (11). Based on this assessment of global reactivation, here we pulse-labeled transcripts at 0, 40, 80, 105, 165, and 300 minutes after nocodazole wash-out in HUH7 cells, but instead conjugated azide-biotin to the EU-RNA to measure the relative changes between over time (fig. 1A). The addition of biotin allowed us to use streptavidin beads to isolate EU-labeled transcripts from total RNA and generate cDNA libraries on the beads for sequencing (fig. S2A–E, S3A, table 1). For direct comparison of transcription in asynchronous vs. mitotic cells, we designed and generated biotinylated RNAs to add as spike-in controls (fig. S2C, F–H, tables S2–4).
Fig 1.
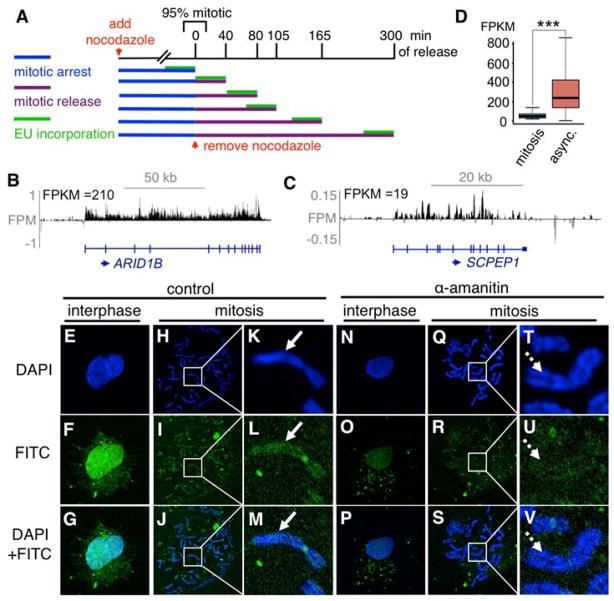
EU-RNA-Seq and direct FITC-UTP labeling reveal extensive transcription in mitosis. (A) Pulse-labeling during mitosis and mitotic exit. (B) Reads span exons and introns, not intergenic regions; y-axis = FPM. (C) A representative transcript with an FPKM of 19. (D) FPKMs of mitotically-expressed transcripts, in mitosis and in async. bar = mean, whiskers = quartiles, p < 0.001, n=8,074. Interphase (E–G) or mitotic (H–M) cells labeled with FITC-UTP; white box magnified in (K–M). Interphase (N–P) or mitotic (Q–V) cells treated with α-amanitin and labeled with FITC-UTP; white box magnified in (Q–S), arrow = RNA signal, arrowhead = no RNA signal.
EU-RNA-Seq maps primary transcripts with high coverage (fig. S3B), as reads span introns and exons of annotated transcripts and are largely absent from intergenic regions (fig. 1B–C, S3C), with reproducibility (fig. S3D). The distribution of asynchronous FPKMs (fig. S4A) and wide dynamic range helps distinguish genes that can be reliably be detected (FPKM ≥ 19) (fig. 1C, S4B) from those that cannot (FPKM < 19) (fig. S4C). Reads from non-specific RNA, not transcribed during the pulse (“NoEU”), primarily mapped to exons of highly abundant, stable mRNAs, such as for ALB (fig. S4D), and were removed from all samples without impacting asynchronous FPKMs compared to microarray data (fig. S4E). We conclude that EU-RNA-Seq is a robust and reliable method for mapping the nascent transcriptome.
With three spike-in replicates, we observed 8,074 transcripts (3,689 genes) (fig. S5A) consistently expressed in mitosis (fig. S5B, table S5). The mean decrement in expression was five-fold, with a much narrower range in expression compared to that in asynchronous cells (fig. 1D). Ninty seven percent of the mitotic transcripts are expressed above 5% of their asynchronous level (fig. S5C) and the different relative rank expression profiles (fig. S5D) indicates that the mitotic transcriptome is distinct from that in asynchronous cells. Furthermore, 3,329 mitotically-expressed genes are expressed higher in mitosis than can be attributed to the approximately 3% contaminating asynchronous cells, based on co-alignment of the mitotic and asynchronous reads with those from 222 adult human liver RNA-Seq studies (fig. S5E, table S6). Thus, the low level transcription seen in the mitotic population cannot be explained by contaminating interphase cells.
We quantified FITC-UTP incorporation in mitotic HUH7 cells with or without the transcriptional inhibitor, α-amanitin, which has detected transcription at centromeres (22). Nascent RNA signals were evident across chromosome arms in metaphase spreads and were significantly reduced by the inhibitor (fig. 1E–V, S6A,B). Chromosome arm transcription was also detected in BJ fibroblasts (fig. S6C–U), further confirming that mitotic transcription is not limited to the centromere and occurs in non-transformed cells.
We used RT-qPCR to independently assess transcripts that were called to be mitotically expressed or not, using intron-directed primers. Primer sets were confirmed to detect nascent transcripts, since treatment with triptolide, an RNAP2 inhibitor, diminished their signals but did not decrease signals for primer sets to GAPDH mRNA (fig. S7A). All three mitotically-expressed primary transcripts were detected in mitotic cells (fig. S7B) and were triptolide-sensitive (fig. S7C), demonstrating the dependence of their expression on RNAP2.
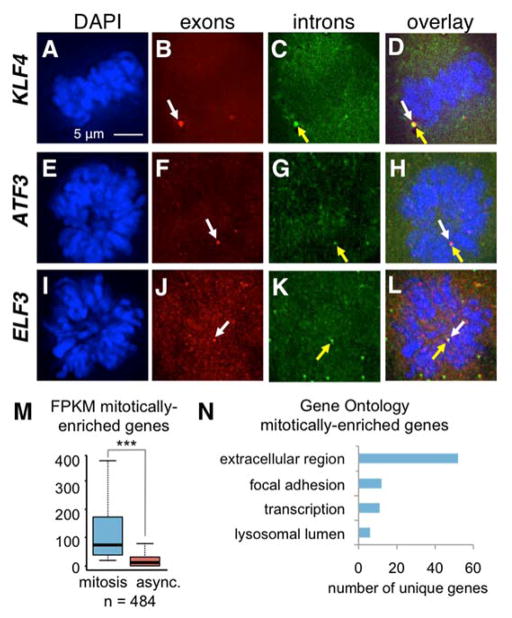
To test for expression of mitotically-expressed genes in naturally occurring mitotic cells, we performed RNA FISH in asynchronous cells (fig. 2A–L). Exon and intron probes were used, since colocalization, together with chromatin, is indicative of a transcriptional event. We detected a significant occurrence of primary transcripts in mitosis for all three genes tested (fig. S7D). We also found 789 transcripts (484 genes) that were higher in mitosis than in asynchronous cells (fig. 2M, table S7). The genes were enriched for those involved in extracellular structure and transcription (fig. 2N, table S8) and were not specific to G2 or other non-mitotic phases (23) (table S9).
Fig 2.
Markedly active genes in mitosis. Naturally-occurring mitotic cells in an async. population stained for DAPI (A, E, I) and exonic (B, F, J) and intronic (C, G, K) RNA. Colocalization at primary transcripts (D, H, L); white arrows = exon, yellow arrows = intron. (M) FPKMs of mitotically-enriched genes in mitotic and async. cells; bar = mean, whiskers = quartiles, p < 0.001, n=484. (N) Representative GO categories for mitotically-enriched genes.
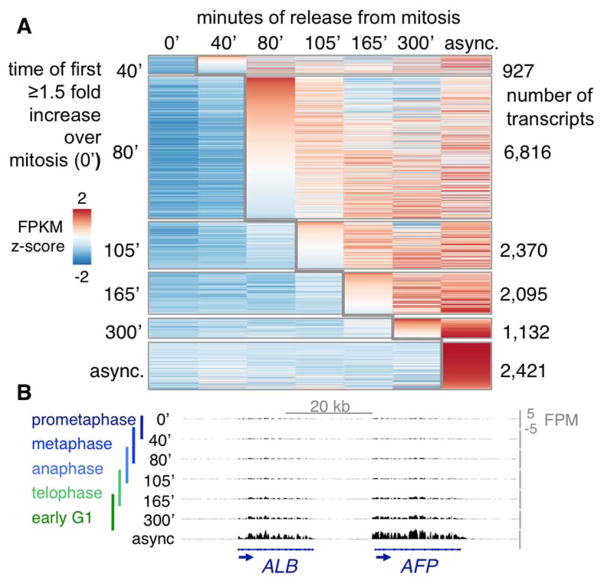
To assess whether there is a hierarchy of reactivation during mitotic exit, all transcripts expressed in asynchronous cells were parsed by the time at which their FPKM first increased 1.5 fold over that in mitosis (fig. S8A, fig. 3A, tables S10–15). The largest number of transcripts first increased at 80′ (fig. S8B, table S11) and were reactivated with the largest amplitude (fig. S9A), as seen previously (11, 17). Of the transcripts first activated at 80′ in hepatoma cells, 55% maintain their transcription rate for the duration of mitotic exit (fig. S9B), similar to that seen in erythroblasts (fig. S9C) (17). Yet the sensitivity of our approach allowed for the identification of additional waves of reactivation following the initial burst (fig. 3, table S12–14). More importantly, EU-labeling affords the sensitivity to detect 927 transcripts that first increase at only 40′ (fig. 3, table S10), well before bulk transcription reactivation seen by EU-fluorophore labeling or RNAP2 antibody staining and ChIP (11, 17).
Fig. 3.
Transcription reactivation during mitotic exit. (A) Z-scores of transcripts (rows) that first increase ≥1.5 fold over mitosis, rank ordered within each time point (columns). (B) Liver genes during mitotic exit; y-axis = FPM, colored bars to the left indicate mitotic or mitotic exit stages generally observed at each time point.
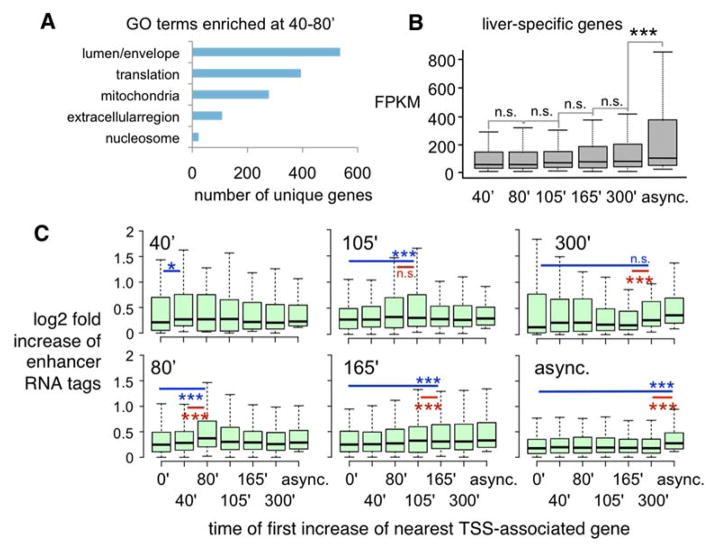
The first genes to increase have functions in lumen and envelope formation and translation (fig. 4A, table S16–17)(24, 25). Therefore, genes that reconstitute basic cell structure and growth are prioritized immediately following mitosis, expanding on the ribosomal and metabolic genes seen elsewhere (26). The next wave of reactivation is enriched for adhesion genes, consistent with the epithelial nature of HUH7 cells (table S18–19). Finally, the last transcripts to first increase are involved in cell cycle and DNA replication (table S20–21), as the cells are preparing for S phase. To determine when liver-specific genes are first activated, we analyzed the time at which the 149 liver-specific genes (27) expressed in HUH7 cells, a number similar to that seen in cultured hepatocytes (28), first increases over mitosis. Although liver-specific genes are expressed throughout mitotic exit, most are re-activated at later stages (fig. 4B, S10A). Thus, HUH7 cells initially activate genes required for building daughter cells at the beginning of mitotic exit and then later activate cell type-specific genes.
Fig. 4.
Basic cell functions are prioritized over cell specificity during mitotic exit. (A) Representative GO categories for 40–80′. (B) FPKMs of liver-specific genes; bar = mean, whiskers = quartiles, p < 0.001 from 300′ to async., n=149. (E) Increase in eRNA (29) within 100 kb of transcription start site (TSS) during mitotic exit; bar = mean, whiskers = quartiles, n.s = not significant, blue = comparison to mitosis, red = comparison to previous time point, *p<0.05, ***p<0.001.
Although the first transcripts to increase are among the shortest (fig. S10B), the longest early genes are still activated before the shortest late genes (fig. S10C). GO analysis of the longest genes to come up at 40 and 80 minutes reveals basic cell functions (fig. S10C,D), as observed when considering all genes (fig. 4A). Analysis of the shortest liver-specific genes indicates that they increase at later time points (fig. S10E–F). Thus, the times of activation of gene classes relates to their function and not primarily to gene size.
We also assessed eRNA dynamics as a surrogate for enhancer activity. We curated all intergenic human enhancers (29) for detectable eRNAs in asynchronous HUH7 cells and found them significantly down-regulated in mitosis (fig. S11A). The majority of eRNAs increased at the early time points during mitotic release (fig. S11B), as did genes (fig. 3A). Curating for the enhancer subset within 100 kb of the nearest TSS, we found that eRNAs first increase around the same time as their putative targets (fig. 4C). In conclusion, enhancer and putative target gene re-activation appear concordant during mitotic exit.
We applied a sensitive approach to measuring the transcriptome during mitosis and mitotic exit. We found extensive residual transcription in mitosis and waves of transcription reactivation during exit. RNA polymerases have long been known to be stable in chromatin, persisting during salt-washes of nuclei that cause loss of transcription factors (30). Thus, a low level of transcribing RNAP2 could contribute to the inheritance of a cell’s specific transcriptome pattern, through mitosis. Since DNase hypersensitivity also persists at promoters in mitosis, whereas hypersensitivity at enhancers (9) and long-range interactions generally do not (8), we suggest that in mitosis, the promoter and its gene create rudimentary Mitotic Expression Units (MEUs). MEUs retain residual activity and function along the general constraints of genes in yeast, which lack enhancers and long-range interactions. The MEU model posits that the transcription pattern is largely retained through mitosis by MEUs, whereas the amplitude of transcription observed in interphase is re-established during mitotic exit.
Supplementary Material
Acknowledgments
We thank J. Lerner, G. Blobel, C. Hsiung, and M. Capelson for their comments on the manuscript, training grant T32GM00812 to K.C.P. and NIH grants 2P20GM103629 (COBRE) to H.L. and GM36477 to K.S.Z. All genomic data is accessible at GSE87476.
References
- 1.Antonin W, Neumann H. Chromosome condensation and decondensation during mitosis. Curr Opin Cell Biol. 2016;40:15–22. doi: 10.1016/j.ceb.2016.01.013. [DOI] [PubMed] [Google Scholar]
- 2.Gottesfeld JM, Forbes DJ. Mitotic repression of the transcriptional machinery. Trends Biochem Sci. 1997;22:197–202. doi: 10.1016/s0968-0004(97)01045-1. [DOI] [PubMed] [Google Scholar]
- 3.Martinez-Balbas MA, Dey A, Rabindran SK, Ozato K, Wu C. Displacement of sequence-specific transcription factors from mitotic chromatin. Cell. 1995;83:29–38. doi: 10.1016/0092-8674(95)90231-7. [DOI] [PubMed] [Google Scholar]
- 4.Prasanth KV, Sacco-Bubulya PA, Prasanth SG, Spector DL. Sequential entry of components of the gene expression machinery into daughter nuclei. Mol Biol Cell. 2003;14:1043–1057. doi: 10.1091/mbc.E02-10-0669. [DOI] [PMC free article] [PubMed] [Google Scholar]
- 5.Parsons GG, Spencer CA. Mitotic repression of RNA polymerase II transcription is accompanied by release of transcription elongation complexes. Mol Cell Biol. 1997;17:5791–5802. doi: 10.1128/mcb.17.10.5791. [DOI] [PMC free article] [PubMed] [Google Scholar]
- 6.Prescott DM, Bender MA. Synthesis of RNA and protein during mitosis in mammalian tissue culture cells. Exp Cell Res. 1962;26:260–268. doi: 10.1016/0014-4827(62)90176-3. [DOI] [PubMed] [Google Scholar]
- 7.Taylor JH. Nucleic acid synthesis in relation to the cell division cycle. Ann N Y Acad Sci. 1960;90:409–421. doi: 10.1111/j.1749-6632.1960.tb23259.x. [DOI] [PubMed] [Google Scholar]
- 8.Naumova N, et al. Organization of the mitotic chromosome. Science. 2013;342:948–953. doi: 10.1126/science.1236083. [DOI] [PMC free article] [PubMed] [Google Scholar]
- 9.Hsiung CC, et al. Genome accessibility is widely preserved and locally modulated during mitosis. Genome Res. 2015;25:213–225. doi: 10.1101/gr.180646.114. [DOI] [PMC free article] [PubMed] [Google Scholar]
- 10.Kadauke S, et al. Tissue-Specific Mitotic Bookmarking by Hematopoietic Transcription Factor GATA1. Cell. 2012;150:725–737. doi: 10.1016/j.cell.2012.06.038. [DOI] [PMC free article] [PubMed] [Google Scholar]
- 11.Caravaca JM, et al. Bookmarking by specific and nonspecific binding of FoxA1 pioneer factor to mitotic chromosomes. Genes Dev. 2013;27:251–260. doi: 10.1101/gad.206458.112. [DOI] [PMC free article] [PubMed] [Google Scholar]
- 12.Liu Y, et al. Widespread Mitotic Bookmarking by Histone Marks and Transcription Factors in Pluripotent Stem Cells. Cell Rep. 2017;19:1283–1293. doi: 10.1016/j.celrep.2017.04.067. [DOI] [PMC free article] [PubMed] [Google Scholar]
- 13.Deluz C, et al. A role for mitotic bookmarking of SOX2 in pluripotency and differentiation. Genes Dev. 2016;30:2538–2550. doi: 10.1101/gad.289256.116. [DOI] [PMC free article] [PubMed] [Google Scholar]
- 14.Teves SS, et al. A dynamic mode of mitotic bookmarking by transcription factors. Elife. 2016;5 doi: 10.7554/eLife.22280. [DOI] [PMC free article] [PubMed] [Google Scholar]
- 15.Festuccia N, et al. Mitotic binding of Esrrb marks key regulatory regions of the pluripotency network. Nat Cell Biol. 2016;18:1139–1148. doi: 10.1038/ncb3418. [DOI] [PubMed] [Google Scholar]
- 16.Core LJ, Waterfall JJ, Lis JT. Nascent RNA sequencing reveals widespread pausing and divergent initiation at human promoters. Science. 2008;322:1845–1848. doi: 10.1126/science.1162228. [DOI] [PMC free article] [PubMed] [Google Scholar]
- 17.Hsiung CC, et al. A hyperactive transcriptional state marks genome reactivation at the mitosis-G1 transition. Genes Dev. 2016;30:1423–1439. doi: 10.1101/gad.280859.116. [DOI] [PMC free article] [PubMed] [Google Scholar]
- 18.Lerner J, et al. Human mutations affect the epigenetic/bookmarking function of HNF1B. Nucleic Acids Res. 2016;44:8097–8111. doi: 10.1093/nar/gkw467. [DOI] [PMC free article] [PubMed] [Google Scholar]
- 19.Liang K, et al. Mitotic Transcriptional Activation: Clearance of Actively Engaged Pol II via Transcriptional Elongation Control in Mitosis. Mol Cell. 2015;60:435–445. doi: 10.1016/j.molcel.2015.09.021. [DOI] [PMC free article] [PubMed] [Google Scholar]
- 20.Liu Y, et al. Transcriptional landscape of the human cell cycle. Proc Natl Acad Sci U S A. 2017;114:3473–3478. doi: 10.1073/pnas.1617636114. [DOI] [PMC free article] [PubMed] [Google Scholar]
- 21.Jao CY, Salic A. Exploring RNA transcription and turnover in vivo by using click chemistry. Proc Natl Acad Sci U S A. 2008;105:15779–15784. doi: 10.1073/pnas.0808480105. [DOI] [PMC free article] [PubMed] [Google Scholar]
- 22.Liu H, et al. Mitotic Transcription Installs Sgo1 at Centromeres to Coordinate Chromosome Segregation. Mol Cell. 2015;59:426–436. doi: 10.1016/j.molcel.2015.06.018. [DOI] [PubMed] [Google Scholar]
- 23.Singh AM, et al. Cell-cycle control of developmentally regulated transcription factors accounts for heterogeneity in human pluripotent cells. Stem Cell Reports. 2013;1:532–544. doi: 10.1016/j.stemcr.2013.10.009. [DOI] [PMC free article] [PubMed] [Google Scholar]
- 24.Huang da W, Sherman BT, Lempicki RA. Systematic and integrative analysis of large gene lists using DAVID bioinformatics resources. Nat Protoc. 2009;4:44–57. doi: 10.1038/nprot.2008.211. [DOI] [PubMed] [Google Scholar]
- 25.Huang da W, Sherman BT, Lempicki RA. Bioinformatics enrichment tools: paths toward the comprehensive functional analysis of large gene lists. Nucleic Acids Res. 2009;37:1–13. doi: 10.1093/nar/gkn923. [DOI] [PMC free article] [PubMed] [Google Scholar]
- 26.Fukuoka M, et al. Identification of preferentially reactivated genes during early G1 phase using nascent mRNA as an index of transcriptional activity. Biochem Biophys Res Commun. 2013;430:1005–1010. doi: 10.1016/j.bbrc.2012.12.048. [DOI] [PubMed] [Google Scholar]
- 27.Liu X, Yu X, Zack DJ, Zhu H, Qian J. TiGER: a database for tissue-specific gene expression and regulation. BMC Bioinformatics. 2008;9:271. doi: 10.1186/1471-2105-9-271. [DOI] [PMC free article] [PubMed] [Google Scholar]
- 28.Olsavsky KM, et al. Gene expression profiling and differentiation assessment in primary human hepatocyte cultures, established hepatoma cell lines, and human liver tissues. Toxicol Appl Pharmacol. 2007;222:42–56. doi: 10.1016/j.taap.2007.03.032. [DOI] [PMC free article] [PubMed] [Google Scholar]
- 29.Leung D, et al. Integrative analysis of haplotype-resolved epigenomes across human tissues. Nature. 2015;518:350–354. doi: 10.1038/nature14217. [DOI] [PMC free article] [PubMed] [Google Scholar]
- 30.Derman E, et al. Transcriptional control in the production of liver-specific mRNAs. Cell. 1981;23:731–739. doi: 10.1016/0092-8674(81)90436-0. [DOI] [PubMed] [Google Scholar]
- 31.Langmead B, Salzberg SL. Fast gapped-read alignment with Bowtie 2. Nat Methods. 2012;9:357–359. doi: 10.1038/nmeth.1923. [DOI] [PMC free article] [PubMed] [Google Scholar]
- 32.Leinonen R, et al. The European Nucleotide Archive. Nucleic Acids Res. 2011;39:D28–31. doi: 10.1093/nar/gkq967. [DOI] [PMC free article] [PubMed] [Google Scholar]
- 33.Dobin A, et al. STAR: ultrafast universal RNA-seq aligner. Bioinformatics. 2013;29:15–21. doi: 10.1093/bioinformatics/bts635. [DOI] [PMC free article] [PubMed] [Google Scholar]
- 34.Mortazavi A, Williams BA, McCue K, Schaeffer L, Wold B. Mapping and quantifying mammalian transcriptomes by RNA-Seq. Nat Methods. 2008;5:621–628. doi: 10.1038/nmeth.1226. [DOI] [PubMed] [Google Scholar]
- 35.Raj A, van den Bogaard P, Rifkin SA, van Oudenaarden A, Tyagi S. Imaging individual mRNA molecules using multiple singly labeled probes. Nat Methods. 2008;5:877–879. doi: 10.1038/nmeth.1253. [DOI] [PMC free article] [PubMed] [Google Scholar]
Associated Data
This section collects any data citations, data availability statements, or supplementary materials included in this article.


