

Key Points
Transferrin receptor 2 drives lysosomal delivery of transferrin in erythroid progenitors.
Erythroid mitochondria specifically associate with lysosomes and are regulated by transferrin receptor 2.
Abstract
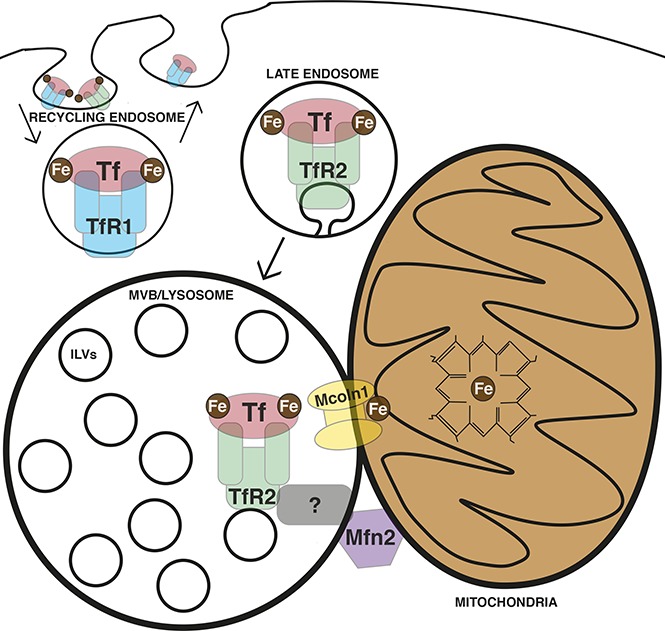
Erythroid progenitors are the largest consumers of iron in the human body. In these cells, a high flux of iron must reach the mitochondrial matrix to form sufficient heme to support hemoglobinization. Canonical erythroid iron trafficking occurs via the first transferrin receptor (TfR1)-mediated endocytosis of diferric-transferrin into recycling endosomes, where ferric iron is released, reduced, and exported to the cytosol via DMT1. However, mice lacking TfR1 or DMT1 demonstrate residual erythropoiesis, suggesting additional pathways for iron use. How iron moves from endosomes to mitochondria is incompletely understood, with both cytosolic chaperoning and “kiss and run” interorganelle transfer implicated. TfR2, in contrast to its paralog TfR1, has established roles in iron sensing, but not iron uptake. Recently, mice with marrow-selective TfR2 deficiency were found to exhibit microcytosis, suggesting TfR2 may also contribute to erythroid hemoglobinization. In this study, we identify alternative trafficking, in which TfR2 mediates lysosomal transferrin delivery. Imaging studies reveal an erythroid lineage-specific organelle arrangement consisting of a focal lysosomal cluster surrounded by a nest of mitochondria, with direct contacts between these 2 organelles. Erythroid TfR2 deficiency yields aberrant mitochondrial morphology, implicating TfR2-dependent transferrin trafficking in mitochondrial maintenance. Human TFR2 shares a lineage- and stage-specific expression pattern with MCOLN1, encoding a lysosomal iron channel, and MFN2, encoding a protein mediating organelle contacts. Functional studies reveal these latter factors to be involved in mitochondrial regulation and erythroid differentiation, with Mfn2 required for mitochondrial-lysosomal contacts. These findings identify a new pathway for erythroid iron trafficking involving TfR2-mediated lysosomal delivery followed by interorganelle transfer to mitochondria.
Visual Abstract
Introduction
Erythroid cells use the major share of absorbed and recycling iron, approximately 25 mg daily, primarily in the synthesis of heme.1 For heme synthesis, iron must reach the mitochondrial matrix, where it is inserted into protoporphyrin IX.2 The major route of cellular iron uptake occurs through the internalization of diferric holo-transferrin via its interaction with the first transferrin receptor, TfR1. Iron is then released from transferrin–TfR1 complexes, and apo-transferrin is recycled to the cell surface. Although intracellular iron trafficking has been studied at length,3 specific mechanisms of iron delivery from endosome to mitochondrial matrix have remained incompletely understood.4 Current models include chaperone-guided cytosolic transit and direct interorganellar transfer through transient interaction (“kiss and run”).5,6
Prior findings indicate additional, noncanonical iron trafficking mechanisms in erythropoiesis. For example, TfR1 null murine embryos exhibit circulating erythroid cells and are largely indistinguishable from wild-type littermates during early embryogenesis. Yolk sac hematopoietic precursors from these animals can be expanded and stained for hemoglobin, indicating heme synthesis in the absence of TfR1.7 Further, TfR1+/− adult mice demonstrate increased reticulocytes and red blood cell counts without any change in erythropoietin levels.8 Slc11a2 −/− mice, which lack the divalent metal transporter (DMT1) mediating export of iron from endosomes, are viable and demonstrate erythropoiesis.9 Finally, in a human patient and in mice with DMT1 deficiency, erythropoietin treatment ameliorated anemia.10 This erythropoietin responsiveness, usually lost under conditions of iron restriction, implies the existence of a DMT1-independent pathway of iron trafficking in erythroid cells.
An additional mediator of iron-transferrin uptake is the second transferrin receptor, TfR2, a paralog of TfR1 with expression restricted mainly to hepatocytes and erythroid progenitors.11 TfR2 can mediate iron uptake,12,13 but its binding affinity for diferric transferrin is 25-30 times lower than that of TfR1,14 leading to the notion that it functions in iron sensing, rather than delivery. Consistent with its role as an iron sensor, hepatic TfR2 regulates production of hepcidin, the primary hormone regulating circulating iron levels,15,16 and erythroid TfR2 mediates differentiation blockade in response to low iron, possibly through its interaction with the erythropoietin receptor.17-19 However, recent findings raise the possibility that TfR2 may also contribute to mitochondrial iron delivery. In a murine marrow transplant model, TfR2 null donor cells yield microcytic red cells, suggestive of defective hemoglobinization.17 This finding is further supported in humans by genome-wide association study linkage of red cell mean corpuscular volume to the TFR2 locus.20 Second, ectopic expression of TfR2 in HEK293 cells selectively increases uptake of radiolabeled iron in mitochondria, as opposed to cytosol.21
TfR2 endocytosis and intracellular trafficking employ pathways distinct from those of TfR1. Specifically, a significant fraction of TfR2 is routed to the lysosome through a TSG101-dependent ESCRT pathway, leading to its enhanced turnover compared with TfR1. This lysosomal trafficking is further enhanced by deprivation of its ligand, holo-transferrin.22 The functional significance, mechanistic basis, and extent of ligand cotrafficking associated with TfR2 lysosomal transport remain unknown. However, emerging data support involvement of the lysosomal compartment in intracellular iron use. For example, mobilization of storage iron requires lysosomal catabolism of ferritin through an autophagic pathway.23 In addition, a pathway for iron export from lysosomes has been identified, involving the cationic transporter Mucolipin-1.24
Our results using primary human progenitors reveal an erythroid-specific pathway of transferrin delivery to the lysosome dependent on TfR2. In addition, we identify specialized multiorganelle structures containing a core of aggregated lysosomes closely surrounded by a shell of mitochondria. At an ultrastructural level, these structures displayed frequent lysosomal–mitochondrial membrane contact sites, junctions previously implicated in transfer of ions25-28 and metabolites.29-31 Finally, a cohort of factors is found that is developmentally coregulated with TfR2 and that participates in lysosomal biogenesis (cathepsin B), lysosomal iron transport (Mucolipin-1), and mitochondrial membrane contact site assembly (Mitofusin-2). Loss of function studies for Mucolipin-1 and Mitofusin-2 uncovered critical roles in erythroid differentiation. The process by which erythroid cells deliver extracellular iron to heme is known to be extremely rapid and efficient,6 but evidence for a specific mitochondrial guidance system has hitherto proven elusive. These findings offer the first evidence for such a system and illustrate its participation in the erythroid differentiation program.
Methods
Cell culture
Purified normal human donor CD34+ progenitors derived from granulocyte colony-stimulating factor–mobilized peripheral blood mononuclear cells were purchased from Fred Hutchinson Cancer Research Center (Seattle, WA). On thawing, cells were cultured 72 hours in prestimulation medium consisting of Iscove’s modified Dulbecco’s medium (IMDM; Gibco, Gaithersburg, MD) with BIT 9500 supplement (Stem Cell Technologies; Vancouver, Canada), and a cytokine mix of 100 ng/mL human stem cell factor (SCF; PeproTech, Rocky Hill, NJ), 100 ng/mL human Feline McDonough Sarcoma–like tyrosine kinase 3 ligand (PeproTech), 100 ng/mL human thrombopoietin (PeproTech), and 20 ng/mL human interleukin 3 (IL-3; PeproTech). Cells were moved to erythroid or granulocytic medium after 72 hours of prestimulation. Erythroid medium consisted of IMDM with 2 mM l-glutamine (Gibco), Chelex-100 (Sigma-Aldrich, St. Louis, MO) stripped 0.05% bovine serum albumin (Sigma-Aldrich), insulin-transferrin-selenium supplement (Stem Cell Technologies), 0.0012% 1-thioglycerol (Sigma-Aldrich), recombinant human erythropoietin at 4.5 U/mL (Procrit, Beerse, Belgium), and 25 ng/mL human SCF. Granulocytic medium consisted of IMDM with 2 mM l-glutamine, Chelex-100 stripped 0.05% bovine serum albumin, insulin-transferrin-selenium supplement, 0.0012% 1-thioglycerol, 10 ng/mL granulocyte colony-stimulating factor (PeproTech), 10 ng/mL IL-3, and 25 ng/mL SCF. For all experiments, cells underwent analysis after 3 days in erythroid or granulocytic culture medium. For heme studies, Bafilomycin (Sigma-Aldrich) or dimethyl sulfoxide control were added to 3-day erythroid cultures for 16 hours before analysis. HUDEP-2 cells were cultured in StemSpan Serum-Free Expansion Medium (Stem Cell Technologies) with 50 ng/mL human SCF, 3 U/mL Epo (Procrit), 1 µM dexamethasone (Sigma-Aldrich), and 1 µg/mL doxycycline (Sigma-Aldrich). K562 cells (ATCC, Manassas, VA) were grown in RPMI medium (Gibco) with 10% fetal bovine serum (Gibco), 2 mM l-glutamine (Gibco), and Anti-Anti antibiotic supplement (Gibco). HEK293T cells (ATCC) were grown in Dulbecco’s modified Eagle medium (Gibco) with 10% fetal bovine serum (Gibco), 2 mM l-glutamine (Gibco), and Anti-anti (Gibco).
Transferrin uptake assays
Analysis of transferrin internalization was performed using fluorochrome- and gold-conjugated holotransferrin, as described in the supplemental Data.
Cell extraction and immunoblot
For sodium dodecyl sulfate-polyacrylamide gel electrophoresis of whole-cell lysates, cell pellets were combined with equal volumes of 2× Laemmli sample buffer (60 mM Tris⋅HCl at pH 6.8, 2% sodium dodecyl sulfate, 100 µM DTT, 10% glycerol, 0.01% bromophenol blue) supplemented with cOmplete Protease Inhibitors (11836170001, Roche Diagnostics, Indianapolis, IN) and PhosSTOP Phosphatase Inhibitors (04906845001, Roche Diagnostics), followed by DNA shearing using tuberculin syringes and boiling for 5 minutes. After electrophoresis and transfer, nitrocellulose membranes were probed overnight at 4°C with primary antibodies at a 1:1000 dilution in Tris-buffered saline with 0.1% Tween 20 (TBS-T) with 1% nonfat dried milk. Horseradish peroxidase–conjugated secondary antibodies (Bethyl Labs, Montgomery, TX) were applied for 1 hour at a 1:5000 dilution. Horseradish peroxidase detection was performed using chemiluminescent SuperSignal West Pico substrate (ThermoFisher Scientific, Waltham, MA) and SuperSignal West Femto Maximum Sensitivity Substrate (ThermoFisher Scientific). Cell surface biotinylation experiments are described in detail in the supplemental information.
Primary antibodies consisted of mouse monoclonal anti-human TfR2 (sc-32271 from Santa Cruz Biotechnology, Santa Cruz, CA), rabbit polyclonal anti-TfR1 (sc-9099 from Santa Cruz Biotechnology), mouse monoclonal anti-TfR1 (sc-32272 from Santa Cruz Biotechnology), mouse monoclonal anti-Tubulin (clone DM1A, #T9026 from Sigma-Aldrich), rabbit polyclonal anti-MFN2 (ab56889 from Abcam, Cambridge, UK), and mouse anti-Rab7 (ab50533 from Abcam).
Flow cytometry and Amnis ImageStream analysis
Flow cytometry and Amnis ImageStream analysis experiments are described in detail in the supplemental Data.
Heme content
Total cellular heme was detecting according to previously described methods.32-34 Cells were lysed at a density of 106/mL in 2 M oxalic acid (Sigma Aldrich). Lysates were heated to 100°C for 30 minutes and fluorometrically read at excitation/emission wavelengths of 400/662 nm (SpectraMAX Gemini EM; Molecular Devices, Sunnyvale, CA).
Transfections and transduction
pLKO.1 shRNA vectors were cotransfected with pCMV-dR8.74 (GAG/POL/TAT/REV) and pMD2.G (VSV-G) in HEK293T cells to generate replication-defective lentivirus. Transduction of cells and puromycin selection was performed as previously described.35 Experimental details of overexpression, lentiviral packaging, reagents, and packaging plasmids are described in supplemental Data.
Murine models
All animal experiments were approved by the University of Virginia Institutional Animal Care and Use Committee. The Tfr2Y245X mutant strain was developed in the Fleming laboratory, as described.36 Mcoln1−/− mice (B6.Cg-Mcoln1tm1Sasl/J) were purchased from Jackson Laboratories (Bar Harbor, ME). Age- and sex-matched littermates were used for all studies. Retroorbital bleeds into EDTA-coated collection tubes were analyzed for complete blood counts on a Hemavet 950 hematology system (Drew Scientific Group, Miami Lakes, FL).
Microscopy
Details of immunofluorescence, gross microscopy, and transmission electron microscopy are described in the supplemental Data.
Statistics
All statistical analysis was performed with Prism 6 (GraphPad Software, La Jolla, CA). Graphs are displayed as mean of 3 or more independent experiments ± standard error of the mean. Data were analyzed by a 2-tailed Student t test, 1-way ANOVA, or 2-way ANOVA, as indicated. Post hoc analysis was performed using Dunnett’s multiple comparisons test for 1-way ANOVA and Sidak’s multiple comparisons test for 2-way ANOVA.
Results
Transferrin traffics to the lysosome in erythroid progenitors
The molecular mechanisms underlying erythroid iron delivery to mitochondria, and particularly whether lineage-specific pathways exist for transferrin trafficking, remain unclear. To address these issues, initial experiments examined the uptake of transferrin in erythroid vs granulocytic progenitors. Using unilineage cultures of primary human CD34+ hematopoietic progenitors,37 cells of each lineage (supplemental Figure 1) were incubated with diferric transferrin conjugated with a pH-sensitive fluorochrome (pHrodo RED) to assess transferrin trafficking into acidic compartments. By fluorescence microscopy, erythroid progenitors demonstrated evidence of enhanced transferrin uptake, consistent with their increased intracellular iron demands (Figure 1A). Intracellular distribution in most erythroid progenitors was nonuniform and characterized by clustering of vesicles within a discrete perinuclear compartment (Figure 1A-B, arrows).
Figure 1.

Lysosomal trafficking of transferrin in erythroid progenitors. (A) Fluorescence microscopy of human erythroid and granulocytic progenitors undergoing pHrodo Red-transferrin uptake (confocal image obtained with 20× objective). (B) Fluorescence microscopy at higher magnification of erythroid progenitors undergoing pHrodo Red-transferrin uptake (confocal image with 63× objective; arrows denote perinuclear clustered vesicles). (C) Fluorescence microscopy for colocalization of Alexa Fluor 594-transferrin with endogenous Lamp1 in erythroid progenitors (confocal image with 63× oil objective). Yellow denotes merge between separate red and green channels. (D) Transmission electron microscopy of erythroid progenitors undergoing 10 nm gold-conjugated transferrin uptake, with boxed regions expanded to highlight MVB/lysosomal accumulation of transferrin particles (arrows denote representative gold-conjugated transferrin particles).
To determine the location of these clustered vesicles, erythroid progenitors were incubated with fluorophore-conjugated diferric transferrin and then costained for Lamp1, a marker of multivesicular bodies (MVB) and lysosomes. The transferrin-containing vesicles extensively colocalized with discrete perinuclear Lamp1+ aggregates (Figure 1C), consistent with transferrin trafficking to MVB/lysosomes. To further resolve the subcellular localization of transferrin in erythroblasts, cells were incubated with transferrin conjugated to 10-nm gold particles for uptake and subjected to electron microscopy. Transferrin was largely concentrated adjacent to intraluminal vesicles inside MVB/lysosomes, suggesting specificity of lysosomal entry via back-fusion of maturing endosomes (Figure 1D).38 These findings were confirmed using transferrin conjugates with 30-nm gold particles, which can be visualized at lower magnifications (supplemental Figure 2A), as well as biotin-conjugated transferrin followed by streptavidin-gold staining (supplemental Figure 2B-C). One of the receptors for transferrin, TfR1, traffics predominantly in the recycling endosomal compartment with minimal localization in MVB/lysosomes.39 To further characterize erythroid patterns of transferrin distribution, progenitors were loaded with fluorochrome-conjugated transferrin followed by immunodetection of TfR1. Unexpectedly, transferrin showed relatively low colocalization with TfR1 in erythroid cells, a finding confirmed with 2 independent antibodies (Figures 2A-B; supplemental Figure 3). In stark contrast, granulocytic progenitors showed extensive colocalization of internalized transferrin with TfR1+ vesicles (Figures 2A-B). These findings reveal that the fundamental process of intracellular transferrin trafficking may vary dramatically on the basis of cellular lineage.
Figure 2.

TfR2 is required for the lysosomal trafficking of transferrin. (A) Fluorescence microscopy for colocalization of Alexa Fluor 594-transferrin with TfR1 in erythroid progenitors (top left: confocal image with 63× oil objective; top right: inset of image depicting higher magnification) and granulocytic progenitors (bottom left: confocal image with 63× oil objective; bottom right: inset of image depicting higher magnification). Yellow denotes merge between separate red and green channels. (B) Colocalization of Alexa Fluor 594-transferrin and TfR1, as measured by Pearson’s correlation coefficient (left) and percentage of Alexa Fluor 594-transferrin+ vesicles co-occupied by TfR1 (right) (number of cells analyzed = 27-58 per group; ***P < .001). (C) Immunoblot of surface-biotinylated proteins from progenitors in erythroid medium with diferric transferrin, with indicated duration of culture in hours postbiotinylation (left). Densitometry for TfR2 vs TfR1 fold decline over the course of 3 hours postbiotinylation (right) (n = 4; *P < .05). (D) Fluorescence microscopy of human erythroid progenitors transduced with lentiviral shRNA constructs and subjected to Alexa Fluor 594-transferrin uptake (confocal image with 10× objective, insets with 63× objective). (E) Transmission electron microscopy of erythroid progenitors transduced with lentiviral shRNA constructs and subjected to 10 nm gold-conjugated transferrin uptake highlighting MVB/lysosomal accumulation (top) and endosomal accumulation (bottom) of transferrin particles. (F) Summary of transmission electron microscopy studies as in panel E showing the number of lysosomal transferrin particles per cell section with indicated lentiviral shRNA transduction (left); number of endosomal transferrin particles per cell section with indicated lentiviral shRNA transduction (middle); and ratio of lysosomal to endosomal localization of transferrin (right) (number of cells counted = 44-45 per group; ***P < .001). (G) Fluorescence microscopy for colocalization of Alexa Fluor 594-transferrin with TfR1 in erythroid progenitors transduced with lentiviral shRNA constructs (confocal image with 63× oil objective). Yellow denotes merge between separate red and green channels. (H) Colocalization of Alexa Fluor 594-transferrin and TfR1 as measured by Pearson’s correlation coefficient (top) and percentage of Alexa Fluor 594-transferrin+ vesicles co-occupied by TfR1 (bottom) (number of cells analyzed = 12-23 per group; **P < .01, ***P < .001).
TfR2 is required for the lysosomal trafficking of transferrin in erythroblasts
TfR2 is a paralog of TfR1, with strong extracellular homology and 30 times lower binding affinity for holotransferrin.14,40 Clearly involved in iron sensing, a role for TfR2 in transferrin internalization has remained poorly understood. Studies in hepatocytes have shown that TfR2 undergoes lysosomal trafficking, which is enhanced by ligand deprivation.39 To compare the disposition of TfR2 and TfR1 in erythroid progenitors, we monitored the stability of a cohort of surface-labeled proteins in iron-replete culture conditions. Consistent with its extensive recycling, TfR1 showed minimal decline at 3 hours after labeling. In contrast, surface-labeled TfR2 displayed a major decline at 1 hour and almost complete disappearance at 3 hours, consistent with extensive lysosomal trafficking even in the presence of holo-transferrin (Figure 2C).
To determine the contribution of TfR2 to lysosomal trafficking of transferrin, erythroid progenitors subjected to lentiviral shRNA knockdowns (supplemental Figure 4) were loaded with labeled transferrin and imaged by fluorescence microscopy and electron microscopy. In these experiments, knockdown of TfR2 dramatically changed the distribution of fluorochrome-tagged transferrin from peri-nuclear clustered vesicles to nonclustered vesicles distributed uniformly throughout the cell (Figure 2D). Ultrastructural characterization of gold-transferrin localization revealed a shift from MVB/lysosomes to the endosomal compartment in association with TfR2 knockdown (Figure 2E-F). To characterize this shift further, transduced cells loaded with fluorochrome-labeled transferrin underwent immunostaining for TfR1. In these experiments, TfR2 knockdown in erythroblasts enhanced the colocalization of transferrin vesicles with TfR1 (Figure 2G-H). Thus, TfR2 exerts an influence on the intracellular trafficking of transferrin and, in erythroid cells, promotes pathway redirection from the recycling endosome to MVB/lysosome.
Lysosomal interaction with mitochondria is a feature of the erythroid lineage
Based on the evidence for lysosomal iron transport in erythroid progenitors, we used multiple imaging techniques to examine the relationship of lysosomes with mitochondria, the principal site of iron delivery during erythropoiesis. Amnis ImageStream analysis of erythroid progenitors colabeled for markers of surface lineage and internal organelles identified distinct nesting of mitochondria around a central lysosomal cluster (Figure 3A). These structures were not observed in similarly analyzed granulocytic progenitors (supplemental Figure 5A). Quantitative comparisons between the 2 lineages confirmed erythroid cells to have more tightly clustered lysosomes (decreased Lamp1 area), more asymmetry in mitochondrial and lysosomal distribution (increase in XY δ-centroid with respect to nucleus), and greater proximity of mitochondria to lysosomes (decrease in XY δ-centroid) (supplemental Figure 5B-D). Confocal fluorescence microscopy further highlighted the mitochondrial nesting around lysosomal clusters present in erythroid, but not in granulocytic, progenitors (Figure 3B). In addition, the images revealed signal overlap at the interface between the 2 organelle zones in erythroid cells, suggesting potential sites of interorganellar contact.
Figure 3.

Direct membrane contacts sites between erythroid mitochondria and lysosomes. (A) Imaging flow cytometry showing bright field (BF), glycophorin A (GPA), mitochondria (Mito), nuclei (DAPI), and Lamp1 (L1) in erythroid progenitors. (B) Fluorescence microscopy for Lamp1 and MitoTracker Deep Red FM in erythroid and granulocytic progenitors (confocal image with 63× oil objective, subjected to additional magnification). (C) Transmission electron microscopy of erythroid progenitors. (D) Transmission electron microscopy of erythroid progenitors. Arrow denotes contorted mitochondrion in direct contact with 2 MVB/lysosomes. (E) Quantification of membrane contacts observed by transmission electron microscopy of erythroid progenitors as in (D) (number of cells counted = 48 per group; ***P < .001). (F) Transmission electron microscopy of erythroid progenitors subjected to 10 nm gold-conjugated transferrin uptake, with micrograph depicting mitochondria in direct contact with transferrin-laden MVB/lysosome. (G) Total heme content in erythroid progenitors ± overnight treatment with 2 nM Bafilomycin (BAF; n = 4 per group; **P < .01). (H) Transmission electron microscopy of erythroid and granulocytic progenitors highlighting proximity of mitochondria to MVB/lysosome. (I) Quantification of mitochondria-MVB/lysosome membrane contacts observed by transmission electron microscopy of erythroid and granulocytic progenitors as in (H) (number of cells counted = 48-53 per group; *P < .05).
Electron microscopy confirmed the specialized mitochondrial and lysosomal organization in erythroid progenitors (Figure 3C). Higher-magnification images confirmed direct contacts between mitochondria and lysosomes, with evidence of mitochondrial distortion at sites of contact (Figure 3D, arrow). The frequency of these contacts, an average of 1.5/70-nm cell section, significantly exceeded that of mitochondrial–mitochondrial contacts, suggesting their specificity (Figure 3E). Analysis of cells loaded with gold-labeled transferrin as in Figure 2 further highlighted the direct contact of functional lysosomes with mitochondria (Figure 3F). Emphasizing the importance of lysosomal transport in the delivery of mitochondrial iron, total heme content was significantly reduced in erythroid progenitors treated with bafilomycin, an inhibitor of lysosomal transport and function (Figure 3G). A caveat of these experiments is that bafilomycin may affect TfR1-mediated transport as well. Importantly, an ultrastructural comparison of erythroid and granulocytic progenitors revealed the mitochondria-lysosomal contacts to be enriched in the erythroid lineage (supplemental Figure 3H-I).
TfR2 influences erythroid mitochondrial structure
Prior studies have shown impaired mitochondrial iron uptake to be associated with decreased organelle size.41 To examine the influence of TfR2 on mitochondria morphology, the erythroid cell line K562 underwent shRNA knockdown followed by Amnis ImageStream quantitative analysis. In these studies, TfR2 knockdown clearly reduced mitotracker staining of cells, consistent with TfR2 regulation of mitochondrial mass (Figure 4A). Ultrastructural studies of marrow cells from wild-type and Tfr2Y245X murine strains further confirmed that TfR2 loss resulted in erythroid cells with reduced mitochondria size (Figure 4B-C). In contrast, granulocytes from Tfr2Y245X mice were unaffected in mitochondrial size, suggesting the erythroid defects are TfR2-dependent (Figure 4B-C).
Figure 4.

TfR2 is required for erythroid mitochondrial integrity. (A) Summary of imaging flow cytometry studies showing relative MitoTracker Deep Red FM mean fluorescence intensities in lentiviral-transduced K562 cells (n = 4; *P < .05). (B) Transmission electron microscopy of bone marrow from adult wild-type and Tfr2Y245X mutant mice, depicting erythroid progenitors (top) and granulocytic progenitors (bottom). (C) Ultrastructural quantitation of mean mitochondrial size in erythroid and granulocytic progenitors from wild-type and Tfr2Y245X bone marrow as in (B) (number of cells analyzed = 15-23 per group; ***P < .001; ns, not significant). (D) Transmission electron microscopy of erythroid progenitors transduced with lentiviral shRNA constructs. (E) Ultrastructural enumeration of electron-dense foci per mitochondrion in transduced erythroid progenitors as in (D) (number of cells analyzed = 10-13 per group; *P < .05). (F) Total heme content in erythroid progenitors transduced with lentiviral shRNA constructs (n = 3 per group; **P < .01). EV, empty vector.
An ultrastructural hallmark of intramitochondrial iron stored in mitoferritin consists of electron-dense foci within the mitochondrial matrix.42-48 In human hematopoietic progenitors, such foci were readily identified in erythroid mitochondria (Figure 4D). Notably, TfR2 knockdown in erythroblasts reduced the number of foci per mitochondria (Figure 4D-E). To assess the contribution of TfR2 and TfR1 to mitochondrial iron uptake, erythroid progenitors were subjected to either TfR2 or TfR1 knockdown (supplemental Figure 6A) and analyzed for total heme content. Transduced cells showed no significant difference in CD36 and GPA expression, markers of earlier and later erythroid differentiation (supplemental Figure 6B). Both TfR2 and TfR1 knockdown significantly reduced total heme content (Figure 4F). Thus, TfR2 in erythroid cells showed an influence on multiple mitochondrial parameters including size, matrix deposits, and heme content.
Erythroid roles for lysosomal and mitochondrial factors coregulated with TfR2
Our results have implicated the lysosomal compartment as an intermediate in erythroid iron flux, suggesting the existence of downstream pathway elements involved in lysosomal–mitochondrial iron transfer. Notably, the lysosomal divalent cation channel Mucolipin-1 has recently been demonstrated to mediate lysosomal iron efflux.24 To assess the role of Mucolipin-1 in erythropoiesis in vivo, heterozygous intercrosses were used to generate Mcoln1−/− mice. As compared with littermate controls, Mcoln1−/− mice displayed reductions in red blood cell counts, hemoglobin levels, and hematocrit (Figure 5A). Their anemia was associated with evidence of decreased marrow erythropoiesis, including gross pallor of the femur and increased proportion of marrow myeloid progenitors, as assessed by hematoxylin and eosin stain (Figure 5B-C). Flow cytometry of the marrow further demonstrated decreased erythropoiesis (Figure 5D-E). Electron microscopy on bone marrow revealed smaller mitochondria in erythroblasts from Mcoln1−/− mice (Figure 5F-G). This defect was erythroid-specific, as granulocytes from Mcoln1−/− mice demonstrated larger mitochondria than those in wild-type granulocytes.
Figure 5.

The lysosomal iron channel Mucolipin-1 contributes to erythropoiesis and mitochondrial integrity. (A) Circulating red blood cell counts, hemoglobin concentration (Hb), and hematocrit (Hct) in littermate adult wild-type, Mcoln1+/−, and Mcoln1−/− mice (n = 9 per group; *P < .05, **P < .01). (B) Femur images from adult wild-type and Mcoln1−/− mice. (C) Light micrographs of hematoxylin and eosin–stained bone marrow from adult wild-type and Mcoln1−/− mice (40× objective). (D) Flow cytometry of wild-type and Mcoln1−/− bone marrow erythroid progenitors to assess erythroid differentiation. (E) Summary of flow cytometry studies as in panel D, showing decrease in percentage of Ter119+ cells in low SSC-gated Mcoln1−/− bone marrow (n = 4-8 per group; *P < .05). (F) Transmission electron microscopy of bone marrow depicting marrow erythroid progenitors from adult wild-type (left) and Mcoln1−/− (right) mice; arrows denote mitochondria. (G) Ultrastructural quantitation of mean mitochondrial size in erythroid and granulocytic progenitors from wild-type and Mcoln1−/− bone marrow as in (F) (number of cells analyzed = 10 per group; ***P < .001; **P < .01).
Similar expression patterns of genes can provide insight into cooperative functions. In the BloodSpot (http://servers.binf.ku.dk/bloodspot) normal human hematopoiesis (differentiation map [DMAP]) database, transcripts of MCOLN1 show dynamic lineage- and stage-specific modulation identical to that of TFR2 (Figure 6A).49 CTSB, the gene encoding the lysosomal cathepsin B protease, and SLC11A2, the gene encoding DMT1, demonstrated similar modulation of expression (supplemental Figure 7A), supporting the existence of a cohort of coregulated lysosomal and mitochondrial genes involved in stage-specific events in erythropoiesis. To identify additional candidate factors involved in erythroid mitochondrial iron delivery, we used the BloodSpot Gene Correlations function, which calculates the Pearson’s correlation of all gene signatures, to identify the top genes that correlated in expression pattern with MCOLN1.49 The top 2 genes were MFN2, encoding Mitofusin-2, a mitochondrial outer membrane protein involved in mitochondria-endoplasmic reticulum contacts,50 and ATPV0C, a V-ATPase that contributes to vesicular acidification and lysosomal activity51 (Figure 6B).49 Visualizing MFN2 expression on a hierarchical differentiation tree heat map revealed an expression pattern identical to those of TFR2 and MCOLN1, with dramatic upregulation in the intermediate-stage CD34− CD71+ GPA− erythroid progenitors, followed by strong downregulation in later-stage CD34− CD71lo GPA+ erythroid cells (supplemental Figure 7B).
Figure 6.

Mitofusin-2 mediates mitochondria-lysosomal membrane contacts and is required for erythropoiesis. (A) BloodSpot expression profiles for TFR2 and MCOLN1, using DMAP dataset. (B) BloodSpot expression correlation analysis from DMAP dataset listing expression correlation coefficients for the most correlated genes to MCOLN1. (C) Immunoblot documentation of Mitofusin-2 knockdown in erythroid progenitors transduced with lentiviral shRNA constructs. (D) Transmission electron microscopy of erythroid progenitors transduced with lentiviral shRNA constructs (arrows denote mitochondria in direct contact with MVB/lysosomes). (E) Ultrastructural quantitation of mitochondria-MVB/lysosome membrane contacts in transduced erythroid progenitors as in (D) (total cells counted = 15 per group; *P < .05. (F) Total heme content in erythroid progenitors (top), K562 cells (middle), and HUDEP-2 cells (bottom) transduced with lentiviral shRNA constructs (top) (n = 4 per group; **P < .01, ***P < .001). (G) Flow cytometry (left) of progenitors transduced as in (D) and cultured 4 days in erythroid medium; summary of flow cytometry experiments on transduced progenitors (right) (n = 3; *P < .05).
Prior implication of Mitofusin-2 in mitochondrial contacts with the endoplasmic reticulum50 and lysosomal fusion with autophagosomes52 suggested a potential role in the formation of mitochondria–lysosomal contacts in erythroblasts. To examine this possibility, lentiviral shRNA knockdowns were performed on primary human erythroid progenitors (Figure 6C), followed by ultrastructural analysis. In these experiments, Mitofusin-2 knockdown reduced the numbers of direct contacts between mitochondria and lysosomes (Figure 6D-E). Analysis of total heme content in these cells demonstrated reduced heme with Mitofusin-2 knockdown (Figure 6F). Further, knocking down Mitofusin-2 in stage-fixed K562 and HUDEP-2 cells similarly reduced total heme content (Figure 6F). Flow cytometry of transduced progenitors differentiated down the erythroid lineage demonstrated impaired upregulation of GPA and CD36 with MFN-2 knockdown, suggesting blockade of erythroid differentiation (Figure 6G).
We sought to examine the potential for a physical interaction between TfR2, MFN2, and Rab7, a lysosome-associated protein. Analyzing lysates from K562 cells, we observed coimmunoprecipitation between endogenous TfR2 and Rab7, also observing some immunoprecipitation of TfR2 with Mitofusin-2 (supplemental Figure 7C). Immunoprecipitation of tagged recombinant TfR2 verified the physical interaction with Rab7 (supplemental Figure 7D). Antibody limitations precluded the study of endogenous MCOLN1.
Discussion
Intracellular trafficking of iron and transferrin has been extensively studied, with many of the critical pathway components identified. Erythroid cells, however, display unique requirements for high-efficiency mitochondrial iron delivery to support rapid and abundant heme synthesis while minimizing exposure to oxidative stress. A key aspect of this specialized “pipeline” appears to consist of interorganellar transfer, in which iron transits from endosomes to mitochondria while bypassing exposure to the chelatable cytosolic compartment.4 An erythroid role for the canonical TfR1-mediated recycling endosomal pathway has been supported by the profound anemias associated with mutations in Tfrc, Slc11a2, Steap3, or Sec15l1.53 However, the molecular basis for directed transfer of iron from endosomes to mitochondria remains unclear, and erythroid-specific participants in this process have hitherto not been identified. Furthermore, the residual erythropoiesis present in animals lacking TfR1 (Tfrc) or DMT1 (Slc11a2) supports the existence of additional noncanonical pathways for erythroid mitochondrial iron delivery.7,9
Results from this study identify an erythroid-specific, TfR2-dependent route for transferrin uptake and lysosomal delivery. Others have described TfR2-dependent trafficking of transferrin to the lysosome in nonerythroid cells.13,21,39 These findings are consistent with the distinguishing characteristics of TfR2 as a tissue-specific receptor that undergoes rapid lysosomal trafficking, in contrast to the ubiquitously expressed TfR1 that undergoes obligate recycling.54 Our data also identify an erythroid-specific organelle configuration involving mitochondrial clustering around a central lysosomal core with frequent membrane contact sites between the 2 organelle types. Although the pathway may involve additional steps of iron trafficking between the lysosome and mitochondria, these structures may offer a dedicated direct pathway for mitochondrial iron transfer via lysosomal transit. Further supporting the lineage specificity of such a pathway is the dynamic coregulation with TfR2 of a cohort of factors involved in lysosome function, lysosomal iron export, and mitochondrial contact formation: ATP6V0C, Cathepsin-B, Mucolipin-1, and Mitofusin-2. Specifically, transcripts encoding these factors show highly restricted and coordinated expression in human erythroblasts at the CD34− CD71+ GPA+ stage of development (Figure 6). Prior studies in reticulocytes have identified brief, transient endosomal contacts with mitochondria as a potential means of interorganellar iron delivery.5 Whether this “kiss and run” mechanism pertains to trafficking in polychromatophilic erythroblasts during peak iron flux remains undetermined. The random and sporadic endosomal–mitochondrial contacts associated with “kiss and run” make this mechanism unfit solely to meet all demands associated with high-amplitude heme biosynthesis. Assembly of stable lysosomal-mitochondrial contacts at the stage of peak iron flux provides an erythroid-specific support mechanism to assist in efficient and accurate mitochondrial iron delivery.
Although TfR2 expression is dispensable for erythropoiesis, mice with bone marrow knockout of Tfr2 have microcytic red cells, consistent with impaired iron-loading.17 Our data in human erythroid progenitors show that TfR2 affects intracellular distribution of transferrin, but not overall uptake (Figure 2), supporting the existence of multiple distinct but overlapping pathways for iron use in this lineage. The strong influence of TfR2 on erythroid transferrin trafficking may seem paradoxical in light of its low ligand-binding affinity as compared with TfR1.14 However, ligand internalization may also be influenced by surface receptor abundance and internalization rates. Furthermore, plasma levels of circulating holotransferrin are approximately 100 times higher than the dissociation constant (Kd) of the TfR2-holotransferrin interaction, which likely overwhelms affinity differences between TfR2 and TfR1 and predicts full-ligand saturation of TfR2. Finally, TfR2 could regulate transferrin trafficking in an indirect manner through binding and regulating factors involved in endosomal transport.
Our study identifies MFN2 as a critical erythroid gene coregulated with TFR2 and required for differentiation. The protein product, Mitofusin-2, participates in several aspects of mitochondrial remodeling including fusion, contact formation with other organelles such as endoplasmic reticulum, and autophagy.50,52,55,56 MFN2 is downregulated in progenitors from patients with refractory anemia with ring sideroblasts,57 a myelodysplastic syndrome with mitochondrial iron overload, suggesting feedback regulation by mitochondrial iron levels. The functions of Mitofusin-2 relevant for erythroid differentiation remain unestablished. One intriguing possibility is that developing erythroblasts co-opt components of the autophagy machinery to promote assembly of lysosomal–mitochondrial networks that support differentiation. Supporting this notion, Mitofusin-2 participates in lysosomal fusion events,52,58 and additional autophagy factors, ATG7 and Nix, have been found to contribute to early stages of erythropoiesis.59,60 Importantly, our ultrastructural studies show that the lysosomal–mitochondrial contacts within proliferating erythroblasts do not represent bona fide autophagy. An autophagy-related process of holo-ferritin catabolism, ferritinophagy, has also been implicated as a route for erythroid iron trafficking.23 However, the absence of hematologic abnormalities in mice lacking ferritin heavy chain suggest this process is dispensable for erythropoiesis.61
In addition to a role in supporting heme synthesis, TfR2-mediated mitochondrial iron delivery might also provide a sensing mechanism. Extracellular iron sensing by TfR2 is known to regulate hepcidin production and erythropoiesis,17,62,63 but the molecular basis for these functions has not been identified. An established sensor highly responsive to intracellular iron fluctuation consists of mitochondrial aconitase, an iron-sulfur cluster enzyme that mediates the erythroid iron restriction response.37,64,65 Rapid and continuous mitochondrial delivery of extracellular iron via lysosomal trafficking of TfR2-transferrin would enable ongoing calibration of critical metabolic activity in accordance with extracellular environment. In this manner, TfR2 modulation of mitochondrial aconitase activity could enable dynamic responsiveness of erythropoiesis to circulating iron availability.
Supplementary Material
The full-text version of this article contains a data supplement.
Acknowledgments
The authors thank David Chan, Paul Schmidt, and Merino Zerial for providing plasmids; Joanne Lannigan and the University of Virginia Flow Cytometry Core Facility for assistance with flow cytometry; Stacey Criswell, Yalin Wang, Kelly Barford, and the University of Virginia Advanced Microscopy Facility for assistance with microscopy; and David Castle and Bettina Winckler for reviewing the manuscript.
This work was supported by grants from the National Institutes of Health, National Institute of Diabetes and Digestive and Kidney Diseases (R01 DK079924, R01 DK101550, and R01 DK095112), the Leukemia & Lymphoma Society (LLS NIA-8988-15), the University of Virginia Farrow Fellowship associated with National Institutes of Health, National Cancer Institute Cancer Center Support Grant P30 CA44579, and the Medical Scientist Training Program at the University of Virginia (5T32GM007267-38).
Authorship
Contribution: S.K. designed and performed experiments, interpreted data, and wrote the manuscript; M.H. and S.G. performed experiments, interpreted data, and edited the manuscript; R.F. provided the Tfr2Y245X mutant animals and edited the manuscript; R.K. and Y.N. developed the HUDEP-2 system; and A.G. designed experiments, interpreted the data, and wrote the manuscript.
Conflict-of-interest disclosure: R.F. has served on the scientific advisory board for Protagonist, a biotechnology company developing products to manipulate the hepcidin-ferroportin axis. The remaining authors declare no competing financial interests.
Correspondence: Adam Goldfarb, Department of Pathology, University of Virginia School of Medicine, PO Box 800904, Charlottesville, VA 22908; e-mail: ang3x@virginia.edu.
References
- 1.Ganz T, Nemeth E. Iron metabolism: interactions with normal and disordered erythropoiesis. Cold Spring Harb Perspect Med. 2012;2(5):a011668. [DOI] [PMC free article] [PubMed] [Google Scholar]
- 2.Prasad AR, Dailey HA. Effect of cellular location on the function of ferrochelatase. J Biol Chem. 1995;270(31):18198-18200. [DOI] [PubMed] [Google Scholar]
- 3.Anderson GJ, McLaren G. Iron physiology and pathophysiology in humans. New York: Humana; 2009 [Google Scholar]
- 4.Richardson DR, Lane DJ, Becker EM, et al. . Mitochondrial iron trafficking and the integration of iron metabolism between the mitochondrion and cytosol. Proc Natl Acad Sci USA. 2010;107(24):10775-10782. [DOI] [PMC free article] [PubMed] [Google Scholar]
- 5.Sheftel AD, Zhang AS, Brown C, Shirihai OS, Ponka P. Direct interorganellar transfer of iron from endosome to mitochondrion. Blood. 2007;110(1):125-132. [DOI] [PubMed] [Google Scholar]
- 6.Zhang AS, Sheftel AD, Ponka P. Intracellular kinetics of iron in reticulocytes: evidence for endosome involvement in iron targeting to mitochondria. Blood. 2005;105(1):368-375. [DOI] [PubMed] [Google Scholar]
- 7.Levy JE, Jin O, Fujiwara Y, Kuo F, Andrews NC. Transferrin receptor is necessary for development of erythrocytes and the nervous system. Nat Genet. 1999;21(4):396-399. [DOI] [PubMed] [Google Scholar]
- 8.Li H, Choesang T, Bao W, et al. . Decreasing TfR1 expression reverses anemia and hepcidin suppression in β-thalassemic mice. Blood. 2017;129(11):1514-1526. [DOI] [PMC free article] [PubMed] [Google Scholar]
- 9.Gunshin H, Fujiwara Y, Custodio AO, Direnzo C, Robine S, Andrews NC. Slc11a2 is required for intestinal iron absorption and erythropoiesis but dispensable in placenta and liver. J Clin Invest. 2005;115(5):1258-1266. [DOI] [PMC free article] [PubMed] [Google Scholar]
- 10.Horvathova M, Kapralova K, Zidova Z, Dolezal D, Pospisilova D, Divoky V. Erythropoietin-driven signaling ameliorates the survival defect of DMT1-mutant erythroid progenitors and erythroblasts. Haematologica. 2012;97(10):1480-1488. [DOI] [PMC free article] [PubMed] [Google Scholar]
- 11.Silvestri L, Nai A, Pagani A, Camaschella C. The extrahepatic role of TFR2 in iron homeostasis. Front Pharmacol. 2014;5:93. [DOI] [PMC free article] [PubMed] [Google Scholar]
- 12.Kawabata H, Yang R, Hirama T, et al. . Molecular cloning of transferrin receptor 2. A new member of the transferrin receptor-like family. J Biol Chem. 1999;274(30):20826-20832. [DOI] [PubMed] [Google Scholar]
- 13.Robb AD, Ericsson M, Wessling-Resnick M. Transferrin receptor 2 mediates a biphasic pattern of transferrin uptake associated with ligand delivery to multivesicular bodies. Am J Physiol Cell Physiol. 2004;287(6):C1769-C1775. [DOI] [PubMed] [Google Scholar]
- 14.Kawabata H, Germain RS, Vuong PT, Nakamaki T, Said JW, Koeffler HP. Transferrin receptor 2-alpha supports cell growth both in iron-chelated cultured cells and in vivo. J Biol Chem. 2000;275(22):16618-16625. [DOI] [PubMed] [Google Scholar]
- 15.Kawabata H, Fleming RE, Gui D, et al. . Expression of hepcidin is down-regulated in TfR2 mutant mice manifesting a phenotype of hereditary hemochromatosis. Blood. 2005;105(1):376-381. [DOI] [PubMed] [Google Scholar]
- 16.Nemeth E, Roetto A, Garozzo G, Ganz T, Camaschella C. Hepcidin is decreased in TFR2 hemochromatosis. Blood. 2005;105(4):1803-1806. [DOI] [PubMed] [Google Scholar]
- 17.Nai A, Lidonnici MR, Rausa M, et al. . The second transferrin receptor regulates red blood cell production in mice. Blood. 2015;125(7):1170-1179. [DOI] [PMC free article] [PubMed] [Google Scholar]
- 18.Rishi G, Secondes ES, Wallace DF, Subramaniam VN. Hematopoietic deletion of transferrin receptor 2 in mice leads to a block in erythroid differentiation during iron-deficient anemia. Am J Hematol. 2016;91(8):812-818. [DOI] [PubMed] [Google Scholar]
- 19.Wallace DF, Secondes ES, Rishi G, et al. . A critical role for murine transferrin receptor 2 in erythropoiesis during iron restriction. Br J Haematol. 2015;168(6):891-901. [DOI] [PubMed] [Google Scholar]
- 20.Ganesh SK, Zakai NA, van Rooij FJ, et al. . Multiple loci influence erythrocyte phenotypes in the CHARGE Consortium. Nat Genet. 2009;41(11):1191-1198. [DOI] [PMC free article] [PubMed] [Google Scholar]
- 21.Mastroberardino PG, Hoffman EK, Horowitz MP, et al. . A novel transferrin/TfR2-mediated mitochondrial iron transport system is disrupted in Parkinson’s disease. Neurobiol Dis. 2009;34(3):417-431. [DOI] [PMC free article] [PubMed] [Google Scholar]
- 22.Chen J, Wang J, Meyers KR, Enns CA. Transferrin-directed internalization and cycling of transferrin receptor 2. Traffic. 2009;10(10):1488-1501. [DOI] [PMC free article] [PubMed] [Google Scholar]
- 23.Mancias JD, Pontano Vaites L, Nissim S, et al. . Ferritinophagy via NCOA4 is required for erythropoiesis and is regulated by iron dependent HERC2-mediated proteolysis. eLife. 2015;4:e10308. [DOI] [PMC free article] [PubMed] [Google Scholar]
- 24.Dong XP, Cheng X, Mills E, et al. . The type IV mucolipidosis-associated protein TRPML1 is an endolysosomal iron release channel. Nature. 2008;455(7215):992-996. [DOI] [PMC free article] [PubMed] [Google Scholar]
- 25.Csordás G, Renken C, Várnai P, et al. . Structural and functional features and significance of the physical linkage between ER and mitochondria. J Cell Biol. 2006;174(7):915-921. [DOI] [PMC free article] [PubMed] [Google Scholar]
- 26.Csordás G, Várnai P, Golenár T, et al. . Imaging interorganelle contacts and local calcium dynamics at the ER-mitochondrial interface. Mol Cell. 2010;39(1):121-132. [DOI] [PMC free article] [PubMed] [Google Scholar]
- 27.Lam AK, Galione A. The endoplasmic reticulum and junctional membrane communication during calcium signaling. Biochim Biophys Acta. 2013;1833(11):2542-2559. [DOI] [PubMed] [Google Scholar]
- 28.Rizzuto R, Pinton P, Carrington W, et al. . Close contacts with the endoplasmic reticulum as determinants of mitochondrial Ca2+ responses. Science. 1998;280(5370):1763-1766. [DOI] [PubMed] [Google Scholar]
- 29.Cohen Y, Klug YA, Dimitrov L, et al. . Peroxisomes are juxtaposed to strategic sites on mitochondria. Mol Biosyst. 2014;10(7):1742-1748. [DOI] [PubMed] [Google Scholar]
- 30.Elbaz-Alon Y, Rosenfeld-Gur E, Shinder V, Futerman AH, Geiger T, Schuldiner M. A dynamic interface between vacuoles and mitochondria in yeast. Dev Cell. 2014;30(1):95-102. [DOI] [PubMed] [Google Scholar]
- 31.Hönscher C, Mari M, Auffarth K, et al. . Cellular metabolism regulates contact sites between vacuoles and mitochondria. Dev Cell. 2014;30(1):86-94. [DOI] [PubMed] [Google Scholar]
- 32.Nie G, Chen G, Sheftel AD, Pantopoulos K, Ponka P. In vivo tumor growth is inhibited by cytosolic iron deprivation caused by the expression of mitochondrial ferritin. Blood. 2006;108(7):2428-2434. [DOI] [PubMed] [Google Scholar]
- 33.Sassa S. Sequential induction of heme pathway enzymes during erythroid differentiation of mouse Friend leukemia virus-infected cells. J Exp Med. 1976;143(2):305-315. [DOI] [PMC free article] [PubMed] [Google Scholar]
- 34.Doty RT, Phelps SR, Shadle C, Sanchez-Bonilla M, Keel SB, Abkowitz JL. Coordinate expression of heme and globin is essential for effective erythropoiesis. J Clin Invest. 2015;125(12):4681-4691. [DOI] [PMC free article] [PubMed] [Google Scholar]
- 35.Elagib KE, Rubinstein JD, Delehanty LL, et al. . Calpain 2 activation of P-TEFb drives megakaryocyte morphogenesis and is disrupted by leukemogenic GATA1 mutation. Dev Cell. 2013;27(6):607-620. [DOI] [PMC free article] [PubMed] [Google Scholar]
- 36.Fleming RE, Ahmann JR, Migas MC, et al. . Targeted mutagenesis of the murine transferrin receptor-2 gene produces hemochromatosis. Proc Natl Acad Sci USA. 2002;99(16):10653-10658. [DOI] [PMC free article] [PubMed] [Google Scholar]
- 37.Bullock GC, Delehanty LL, Talbot AL, et al. . Iron control of erythroid development by a novel aconitase-associated regulatory pathway. Blood. 2010;116(1):97-108. [DOI] [PMC free article] [PubMed] [Google Scholar]
- 38.Traub LM. The reverse logic of multivesicular endosomes. EMBO Rep. 2010;11(2):79-81. [DOI] [PMC free article] [PubMed] [Google Scholar]
- 39.Johnson MB, Chen J, Murchison N, Green FA, Enns CA. Transferrin receptor 2: evidence for ligand-induced stabilization and redirection to a recycling pathway. Mol Biol Cell. 2007;18(3):743-754. [DOI] [PMC free article] [PubMed] [Google Scholar]
- 40.West AP Jr, Bennett MJ, Sellers VM, Andrews NC, Enns CA, Bjorkman PJ. Comparison of the interactions of transferrin receptor and transferrin receptor 2 with transferrin and the hereditary hemochromatosis protein HFE. J Biol Chem. 2000;275(49):38135-38138. [DOI] [PubMed] [Google Scholar]
- 41.Davuluri G, Song P, Liu Z, et al. . Inactivation of 3-hydroxybutyrate dehydrogenase 2 delays zebrafish erythroid maturation by conferring premature mitophagy. Proc Natl Acad Sci USA. 2016;113(11):E1460-E1469. [DOI] [PMC free article] [PubMed] [Google Scholar]
- 42.Knight SA, Sepuri NB, Pain D, Dancis A. Mt-Hsp70 homolog, Ssc2p, required for maturation of yeast frataxin and mitochondrial iron homeostasis. J Biol Chem. 1998;273(29):18389-18393. [DOI] [PubMed] [Google Scholar]
- 43.Martelli A, Puccio H. Dysregulation of cellular iron metabolism in Friedreich ataxia: from primary iron-sulfur cluster deficit to mitochondrial iron accumulation. Front Pharmacol. 2014;5:130. [DOI] [PMC free article] [PubMed] [Google Scholar]
- 44.Miranda CJ, Makui H, Soares RJ, et al. . Hfe deficiency increases susceptibility to cardiotoxicity and exacerbates changes in iron metabolism induced by doxorubicin. Blood. 2003;102(7):2574-2580. [DOI] [PubMed] [Google Scholar]
- 45.Pereira SM, Williams SR, Murray P, Taylor A. MS-1 magA: revisiting its efficacy as a reporter gene for MRI [published online ahead of print 26 April 2016]. Mol Imaging. doi:10.1177/1536012116641533. [DOI] [PMC free article] [PubMed] [Google Scholar]
- 46.Rouault TA, Tong WH. Iron-sulphur cluster biogenesis and mitochondrial iron homeostasis. Nat Rev Mol Cell Biol. 2005;6(4):345-351. [DOI] [PubMed] [Google Scholar]
- 47.Santambrogio P, Erba BG, Campanella A, et al. . Over-expression of mitochondrial ferritin affects the JAK2/STAT5 pathway in K562 cells and causes mitochondrial iron accumulation. Haematologica. 2011;96(10):1424-1432. [DOI] [PMC free article] [PubMed] [Google Scholar]
- 48.Bessis MC, Breton-Gorius J. Iron metabolism in the bone marrow as seen by electron microscopy: a critical review. Blood. 1962;19:635-663. [PubMed] [Google Scholar]
- 49.Bagger FO, Sasivarevic D, Sohi SH, et al. . BloodSpot: a database of gene expression profiles and transcriptional programs for healthy and malignant haematopoiesis. Nucleic Acids Res. 2016;44(D1):D917-D924. [DOI] [PMC free article] [PubMed] [Google Scholar]
- 50.de Brito OM, Scorrano L. Mitofusin 2 tethers endoplasmic reticulum to mitochondria. Nature. 2008;456(7222):605-610. [DOI] [PubMed] [Google Scholar]
- 51.Mangieri LR, Mader BJ, Thomas CE, et al. . ATP6V0C knockdown in neuroblastoma cells alters autophagy-lysosome pathway function and metabolism of proteins that accumulate in neurodegenerative disease. PLoS One. 2014;9(4):e93257. [DOI] [PMC free article] [PubMed] [Google Scholar]
- 52.Zhao T, Huang X, Han L, et al. . Central role of mitofusin 2 in autophagosome-lysosome fusion in cardiomyocytes. J Biol Chem. 2012;287(28):23615-23625. [DOI] [PMC free article] [PubMed] [Google Scholar]
- 53.Pantopoulos K, Porwal SK, Tartakoff A, Devireddy L. Mechanisms of mammalian iron homeostasis. Biochemistry. 2012;51(29):5705-5724. [DOI] [PMC free article] [PubMed] [Google Scholar]
- 54.Kawabata H, Tong X, Kawanami T, et al. . Analyses for binding of the transferrin family of proteins to the transferrin receptor 2. Br J Haematol. 2004;127(4):464-473. [DOI] [PubMed] [Google Scholar]
- 55.Chen H, Detmer SA, Ewald AJ, Griffin EE, Fraser SE, Chan DC. Mitofusins Mfn1 and Mfn2 coordinately regulate mitochondrial fusion and are essential for embryonic development. J Cell Biol. 2003;160(2):189-200. [DOI] [PMC free article] [PubMed] [Google Scholar]
- 56.Leal NS, Schreiner B, Pinho CM, et al. . Mitofusin-2 knockdown increases ER-mitochondria contact and decreases amyloid β-peptide production. J Cell Mol Med. 2016;20(9):1686-1695. [DOI] [PMC free article] [PubMed] [Google Scholar]
- 57.Nikpour M, Pellagatti A, Liu A, et al. . Gene expression profiling of erythroblasts from refractory anaemia with ring sideroblasts (RARS) and effects of G-CSF. Br J Haematol. 2010;149(6):844-854. [DOI] [PubMed] [Google Scholar]
- 58.Hailey DW, Rambold AS, Satpute-Krishnan P, et al. . Mitochondria supply membranes for autophagosome biogenesis during starvation. Cell. 2010;141(4):656-667. [DOI] [PMC free article] [PubMed] [Google Scholar]
- 59.Sandoval H, Thiagarajan P, Dasgupta SK, et al. . Essential role for Nix in autophagic maturation of erythroid cells. Nature. 2008;454(7201):232-235. [DOI] [PMC free article] [PubMed] [Google Scholar]
- 60.Zhang J, Randall MS, Loyd MR, et al. . Mitochondrial clearance is regulated by Atg7-dependent and -independent mechanisms during reticulocyte maturation. Blood. 2009;114(1):157-164. [DOI] [PMC free article] [PubMed] [Google Scholar]
- 61.Ferreira C, Santambrogio P, Martin ME, et al. . H ferritin knockout mice: a model of hyperferritinemia in the absence of iron overload. Blood. 2001;98(3):525-532. [DOI] [PubMed] [Google Scholar]
- 62.Goswami T, Andrews NC. Hereditary hemochromatosis protein, HFE, interaction with transferrin receptor 2 suggests a molecular mechanism for mammalian iron sensing. J Biol Chem. 2006;281(39):28494-28498. [DOI] [PubMed] [Google Scholar]
- 63.Herbison CE, Thorstensen K, Chua AC, et al. . The role of transferrin receptor 1 and 2 in transferrin-bound iron uptake in human hepatoma cells. Am J Physiol Cell Physiol. 2009;297(6):C1567-C1575. [DOI] [PubMed] [Google Scholar]
- 64.Richardson CL, Delehanty LL, Bullock GC, et al. . Isocitrate ameliorates anemia by suppressing the erythroid iron restriction response. J Clin Invest. 2013;123(8):3614-3623. [DOI] [PMC free article] [PubMed] [Google Scholar]
- 65.Talbot AL, Bullock GC, Delehanty LL, Sattler M, Zhao ZJ, Goldfarb AN. Aconitase regulation of erythropoiesis correlates with a novel licensing function in erythropoietin-induced ERK signaling. PLoS One. 2011;6(8):e23850. [DOI] [PMC free article] [PubMed] [Google Scholar]
Associated Data
This section collects any data citations, data availability statements, or supplementary materials included in this article.