

Key Points
CNAs can be detected as part of CHIP.
Abstract
Recent studies have revealed that clonal hematopoiesis of indeterminate potential (CHIP) is an important risk factor for therapy-related myeloid neoplasms (t-MNs). CHIP is currently defined as a clonal hematopoietic population carrying somatic point mutations in 1 of the leukemia-associated genes. Patients with t-MNs often present with chromosomal abnormalities in addition to somatic point mutations. It remains unclear whether chromosomal abnormalities can cooccur with point mutations as part of CHIP. Here we report that 3 of 14 patients with t-MNs had low amplitude but detectable chromosome arm-level copy number alterations (CNAs) in the peripheral blood samples that were taken at the time of their primary cancer diagnosis and before exposure to therapy. These CNAs were the same CNAs seen in t-MN bone marrow samples and affected the same allele, suggesting the same clonal origin. These data suggest that not only somatic point mutations but also chromosome arm-level CNAs are detectable as CHIP and preexist before patients’ exposure to chemotherapy and/or radiation therapy. These data suggest that screening of both somatic point mutations and CNAs might allow more complete ascertainment of CHIP.
Visual Abstract
Introduction
Chromosomal abnormalities are 1 of the hallmarks of therapy-related myeloid neoplasms (t-MNs). More than 70% of patients with t-MNs present with abnormal cytogenetics.1,2 However, clonal origin and the timing of these chromosomal abnormalities relative to other point mutations are not well understood.
We and other investigators recently reported that the clonal origin of t-MN driver mutations can be detected in peripheral blood (PB) as clonal hematopoiesis of indeterminate potential (CHIP)3 at the time of the primary cancer diagnosis and before exposure to chemotherapy/radiation therapy.4-6 We showed that CHIP can be detected in 70% of patients with cancer who subsequently developed t-MNs and that CHIP is an independent risk factor for t-MNs.4
Chromosome-arm level structural variations (SVs) or copy number alterations (CNAs) have also been reported as clonal mosaicism in the blood of healthy adults, and detection of these abnormalities has been linked to an increased risk of hematologic malignancy.7,8 Because none of the studies have analyzed both point mutations and SVs/CNAs at the same time, it is unclear whether arm-level SVs/CNAs cooccur with the point mutations as CHIP and whether they precede or are acquired after the point mutations.
To address this question, we performed targeted capture sequencing of 295 genes (295-gene panel) with 967 cyto–single nucleotide polymorphism (SNP) coverage or whole-exome sequencing (WES) on paired samples obtained at 2 different time points from 14 patients with cancer who developed t-MNs. These 2 samples were derived from PB obtained at the time of primary cancer diagnosis and before exposure to chemotherapy/radiation therapy and from bone marrow (BM) samples obtained at the time of t-MN diagnosis. These patients are those patients whom we previously studied for the association between driver gene mutations, CHIP, and t-MN risk.4 In the prior study, we used molecular barcode sequencing of 32 genes to detect low variant allele frequency (VAF) mutations, and because of the limited coverage of the genome, we were unable to detect arm-level CNAs. In the current study, by sequencing a wider portion of genomes, we aimed to detect arm-level CNAs in the prior PB samples and compared these with CNAs detected in t-MN BM samples.
Methods
Studied patients
We previously described the patient selection and the clinical characteristics of 14 patients with cancers who developed t-MNs.4 Written informed consent for sample collection and analysis was obtained from all patients. The study protocol adhered to the Declaration of Helsinki and was approved by the Institutional Review Board at MD Anderson (PA15-0400).
DNA sequencing
All PB samples obtained at the time of cancer diagnosis were subject to 295-gene panel sequencing as previously described (supplemental Table 1).4 For t-MN BM samples, 13 of them were sequenced by 295-gene panel, and 1 was sequenced by WES as previously described.9 The 295-gene panel included 967 cytoSNPs that were evenly distributed throughout the genome, allowing us to infer genome-wide CNAs (supplemental Table 2).
Detection of CNAs
We estimated CNAs from the data of WES or 295-gene panel as previously described.10 Because CNAs in the prior PB samples were expected to be low amplitude, we identified statistically significant CNAs by calculating a z score for each arm as previously described.11 Briefly, after removing duplication, reads with mapping quality scores of ≥30 were extracted. The genomic representation score (GR) of each arm was calculated by dividing the number of reads mapped to a given arm by the total number of reads in the sample. The z scores were then calculated as follows: 
A threshold of z score >1.96 or < −1.96 (P < .05) was used to identify statistically significant CNAs in the prior PB samples, where minus and plus indicate loss and gain, respectively.
The model of clonal evolution was inferred by using R package fishplot.12 Briefly, for each CNA, clonal fraction was inferred based on the following formula and was fit into the model. To simplify the calculation, only 1 copy gain or loss was considered: 
Results
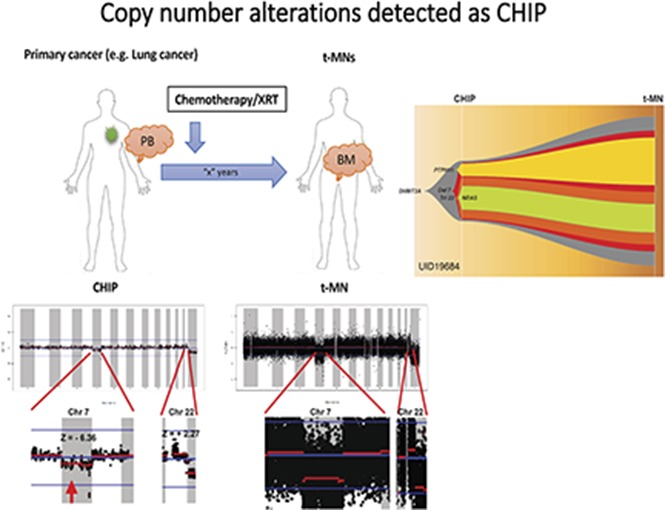
Table 1 summarizes the cytogenetic profiles of 14 t-MN BM as well as point mutations that were detected in t-MN BM and in prior matched PB as CHIP. Consistent with t-MN characteristics, 11 of 14 patients (79%) had abnormal karyotypes. Arm-level CNAs of t-MN BM reflected most of the findings from cytogenetic studies (UID49278 was noninformative because of poor sequencing quality; supplemental Figure 1). We then analyzed CNAs in prior PB. Most of the prior PB had no statistically significant CNAs, but in samples from 3 patients (UID984, UID36491, and UID19684), we detected CNAs that were likely the origin of CNAs detected in the matched t-MN BM (Figure 1A). Patient UID984 had loss of chromosome 7 and 9q in the t-MN BM. Low-amplitude loss of chromosome 7 (z score: −4.09) was detected in the prior PB from this patient. This patient did not have detectable known cancer gene point mutations in either the t-MN BM or the prior PB. Patient UID36491 had a monosomal karyotype involving del(7q), −16, and −18, among others. In the patient’s matching prior PB, we detected low-amplitude loss of 7q (z score: −2.53), 16 (z score: −2.33), and 18 (z score: −2.58). Patient UID19684 had monosomy 7 and trisomy 22 in the t-MN BM. In the prior PB, we also detected loss of chromosome 7 (z score: −6.36) and low-amplitude gain of chromosome 22 (z score: +2.27). By analyzing SNP haplotype in the affected arm, these CNAs detected in the prior PB and t-MN BM occurred in the same allele, further supporting the same clonal origin. For these 3 informative cases, we then inferred the model of clonal evolution from CHIP to t-MNs (Figure 1B).
Table 1.
Cytogenetic findings and mutation characteristics of 14 patients with t-MNs
| Patient ID | t-MN type | Cytogenetic findings | Gene | Amino acid change | VAF CHIP, % | VAF t-MN, % | Detected CNA in CHIP | Clonal fraction, % |
|---|---|---|---|---|---|---|---|---|
| UID12766 | t-AML | Normal | WT1 | p.S381X | ND | 14.75 | ND | |
| UID984 | t-MDS | 46∼47,XY,+X,del(7)(q11.2),r(7),add(9)(q12) | ND | ND | ND | Chr 7 loss | 18 | |
| UID10164 | t-MDS | 46, XX, +1, der(1;7)(q10;p10) | RUNX1 | p.L98fs | 3.69 | 23.27 | ND | |
| UID6982 | t-AML | 46, XY, del(5)(q15q33) | IDH2 | p.R140Q | 15.83 | 45.51 | ND | |
| SRSF2 | p.P95delinsRP | 13.76 | 25.32 | |||||
| UID488 | t-MDS | Normal | DNMT3A | p.R882P | 19.93 | 33.14 | ND | |
| IDH2 | p.R172K | ND | 15.46 | |||||
| UID36491 | t-MDS | 42, X, −Y, del(1)(q21), del(7)(q11.2q31), del(14)(q12q21), −16, −18, 21, −22, −22, +2mar[11], 44, X, −Y, del(1)(q21), del(7)(q11.2q31), del(14)(q12q21), −18, −21, +mar[5], 46, XY[4] | TP53 | p.H193R | 22.31 | 73.09 | Chr 7 loss | 14 |
| Chr 16 loss | 12 | |||||||
| Chr 18 loss | 18 | |||||||
| UID4473 | t-MDS | Normal | TET2 | p.L1212X | 5.29 | 45.34 | ND | |
| UID17285 | t-MDS | 45, XY, add(2)(p12), −5, −7, t(11;17)(q13;p11.2), +mar | TET2 | p.Y1255X | 8.45 | 18.06 | ND | |
| TP53 | p.Y205C | 8.57 | 22.31 | |||||
| U2AF1 | p.Q157P | 3.92 | 11.73 | |||||
| UID19684 | t-MDS | 46, XY, −7, +22 | DNMT3A | p.R882C | 18.85 | 47.06 | Chr 7 loss | 36 |
| NRAS | p.G13V | 7.65 | 8.82 | Chr 22 gain | 26 | |||
| PTPN11 | p.G60V | 4.31 | 14.81 | |||||
| UID7393 | t-AML | 46, XY, del(5)(q13q33), 46, XY, der(3;5)(q10;p10), +8 | KRAS | p.G12A | ND | 10.28 | ND | |
| NRAS | p.G13R | ND | 17.1 | |||||
| TP53 | p.Y107X | 0.92 | 97.16 | |||||
| UID49278 | t-AML | 45, X, −Y | FLT3 | p.D593delinsEAPGEVD | 0.98 | 22.45 | ND | |
| GNB1 | p.K57E | 28.53 | 37.79 | |||||
| KDM6A | p.R658X | 1.19 | 72.12 | |||||
| RAD21 | p.E553X | ND | 41.2 | |||||
| RUNX1 | p.G165fs | ND | 20.66 | |||||
| RUNX1 | p.R204X | 0.68 | 30.67 | |||||
| SRSF2 | p.P85H | 36.92 | 33.58 | |||||
| UID12484 | t-AML | 45, XY, der(7;17)(p10;q10) | TP53 | p.L194H | ND | 41.97 | ND | |
| UID19304 | t-MDS | 46, XX, inv(3)(q21q26.2) | GATA2 | p.Y322_M325delinsW | ND | 33.7 | ND | |
| UID31000 | t-AML | 44, XY, del(5)(q13), add(7)(q11.2), −11, −12, −17, −17, +r, +mar | TET2 | p.H1380Y | 8.74 | 21.21 | ND |
Chr, chromosome; ND, not detected; t-AML, therapy-related acute myeloid leukemia; t-MDS, therapy-related myelodysplastic syndrome.
Figure 1.

Analysis of CNAs in 3 patients with t-MNs. (A) CNAs detected in t-MN BM samples and matching prior PB samples from each patient. Vertical axis represents log2 ratio of copy number, and horizontal axis represents each chromosome. Y chromosome is not shown because 295-gene panel sequencing does not have enough coverage to analyze CNA in the chromosome. Each chromosome area that showed statistically significant CNA is magnified below, and z score is indicated. (B) Inferred model of clonal architecture and evolution from CHIP to t-MNs. Model was generated based on the estimated clonal fraction of CNAs and point mutations. Chr 7, chromosome 7.
Discussion
t-MNs were historically considered to arise as a result of cumulative genotoxic insult from chemotherapy/radiation therapy.13 However, recent evidence from our studies and others has revealed that t-MN driver mutations preexist as CHIP before patients are exposed to chemotherapy/radiation therapy.4-6 The current data provide additional evidence that t-MN–associated CNAs can also preexist as CHIP. In 1 patient (UID984) who did not have a detectable point mutations in known leukemia driver genes in the t-MN sample, CNAs were the only abnormalities detected as CHIP. These data would suggest that, in addition to screening for point mutations, CNA analysis may be useful in detecting CHIP. In the other 2 cases, point mutations (TP53 and DNMT3A) had a larger estimated clonal fraction than CNAs. Furthermore, that point mutations were more prevalent as CHIP (10 of 14 [71%]) than CNAs (3 of 14 [21%]) suggests that, in most cases, point mutations could be the earlier events in the development of t-MNs. Analysis of both point mutations and CNA in larger cohort is needed to fully understand the prevalence and significance of CHIP with CNA and its interaction with point mutations.
In summary, our data suggest that CHIP is not solely defined by the presence of somatic point mutations, but CNAs can also be part of CHIP, and screening for both point mutations and CNAs might allow for more complete ascertainment of CHIP. Our data also provide preliminary evidence that point mutations may precede chromosomal aberrations during the development of t-MNs.
Supplementary Material
The full-text version of this article contains a data supplement.
Acknowledgments
The authors thank Erica Goodoff for her professional input on the manuscript.
This study was supported by the Cancer Prevention Research Institute of Texas grant R120501 (P.A.F.), the Welch Foundation grant G-0040 (P.A.F.), the University of Texas System Science and Technology Acquisition and Retention Award grant PS100149 (P.A.F.), the Red and Charline McCombs Institute for the Early Detection and Treatment of Cancer Award (K.T.), an Institutional Research Grant at The MD Anderson Cancer Center (K.T.), National Cancer Institute Leukemia Specialized Program in Research Excellence Career Enhancement Program (K.T.), Khalifa Scholar Award (K.T.), National Institutes of Health, National Cancer Institute through The MD Anderson Cancer Center Support grant P30 CA016672, and generous philanthropic contributions to MD Anderson’s MDS/AML Moon Shot Program (K.T., H.K., G.G.-M., and P.A.F.).
Authorship
Contribution: K.T. designed the study, analyzed data, and wrote the manuscript; F.W., X.S., and J.Z. performed bioinformatics analysis and wrote the manuscript; C.G., L.L., S.T., and R.T. performed sequencing; C.B.-R. and K.P. performed pathological diagnosis; K.P., S.N., and X.W. provided samples; C.D.D., F.R., H.K., and G.G.-M. treated patients and contributed to sample collection; P.A.F. provided leadership, supervised all of the research, and edited the manuscript; and all authors read and approved the manuscript.
Conflict-of-interest disclosure: The authors declare no competing financial interests.
Correspondence: Koichi Takahashi, 1515 Holcombe Blvd, Unit 428, Houston TX 77030; e-mail: ktakahashi@mdanderson.org; and P. Andrew Futreal, 1515 Holcombe Blvd, Unit 1954, Houston TX 77030; e-mail: afutreal@mdanderson.org.
References
- 1.Smith SM, Le Beau MM, Huo D, et al. . Clinical-cytogenetic associations in 306 patients with therapy-related myelodysplasia and myeloid leukemia: the University of Chicago series. Blood. 2003;102(1):43-52. [DOI] [PubMed] [Google Scholar]
- 2.Kayser S, Döhner K, Krauter J, et al. ; German-Austrian AMLSG. The impact of therapy-related acute myeloid leukemia (AML) on outcome in 2853 adult patients with newly diagnosed AML. Blood. 2011;117(7):2137-2145. [DOI] [PubMed] [Google Scholar]
- 3.Steensma DP, Bejar R, Jaiswal S, et al. . Clonal hematopoiesis of indeterminate potential and its distinction from myelodysplastic syndromes. Blood. 2015;126(1):9-16. [DOI] [PMC free article] [PubMed] [Google Scholar]
- 4.Takahashi K, Wang F, Kantarjian H, et al. . Preleukaemic clonal haemopoiesis and risk of therapy-related myeloid neoplasms: a case-control study. Lancet Oncol. 2017;18(1):100-111. [DOI] [PMC free article] [PubMed] [Google Scholar]
- 5.Gillis NK, Ball M, Zhang Q, et al. . Clonal haemopoiesis and therapy-related myeloid malignancies in elderly patients: a proof-of-concept, case-control study. Lancet Oncol. 2017;18(1):112-121. [DOI] [PMC free article] [PubMed] [Google Scholar]
- 6.Wong TN, Ramsingh G, Young AL, et al. . Role of TP53 mutations in the origin and evolution of therapy-related acute myeloid leukaemia. Nature. 2015;518(7540):552-555. [DOI] [PMC free article] [PubMed] [Google Scholar]
- 7.Jacobs KB, Yeager M, Zhou W, et al. . Detectable clonal mosaicism and its relationship to aging and cancer. Nat Genet. 2012;44(6):651-658. [DOI] [PMC free article] [PubMed] [Google Scholar]
- 8.Laurie CC, Laurie CA, Rice K, et al. . Detectable clonal mosaicism from birth to old age and its relationship to cancer. Nat Genet. 2012;44(6):642-650. [DOI] [PMC free article] [PubMed] [Google Scholar]
- 9.Takahashi K, Patel K, Bueso-Ramos C, et al. . Clinical implications of TP53 mutations in myelodysplastic syndromes treated with hypomethylating agents. Oncotarget. 2016;7(12):14172-14187. [DOI] [PMC free article] [PubMed] [Google Scholar]
- 10.Zhang J, Fujimoto J, Zhang J, et al. . Intratumor heterogeneity in localized lung adenocarcinomas delineated by multiregion sequencing. Science. 2014;346(6206):256-259. [DOI] [PMC free article] [PubMed] [Google Scholar]
- 11.Leary RJ, Sausen M, Kinde I, et al. . Detection of chromosomal alterations in the circulation of cancer patients with whole-genome sequencing. Sci Transl Med. 2012;4(162):162ra154. [DOI] [PMC free article] [PubMed] [Google Scholar]
- 12.Miller CA, McMichael J, Dang HX, et al. . Visualizing tumor evolution with the fishplot package for R. BMC Genomics. 2016;17(1):880. [DOI] [PMC free article] [PubMed] [Google Scholar]
- 13.Bhatia S. Therapy-related myelodysplasia and acute myeloid leukemia. Semin Oncol. 2013;40(6):666-675. [DOI] [PMC free article] [PubMed] [Google Scholar]
Associated Data
This section collects any data citations, data availability statements, or supplementary materials included in this article.