Key Points
BM niches differentially support T-ALL.
BM niches differentially protect T-ALL cells from chemotherapy.
Abstract
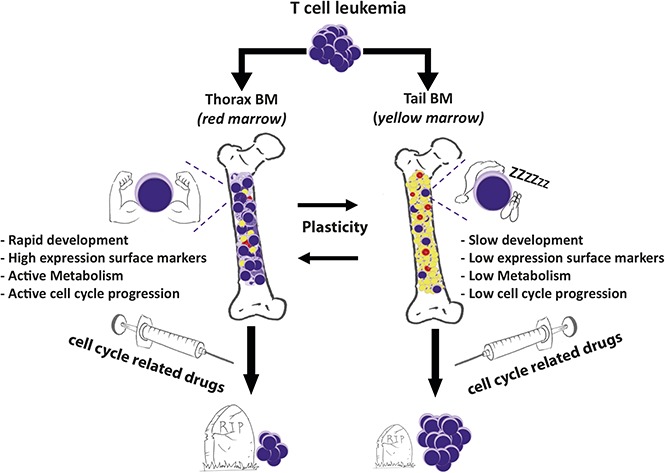
T-cell acute lymphoblastic leukemia (T-ALL) expands in various bone marrow (BM) sites of the body. We investigated whether different BM sites could differently modulate T-ALL propagation using in vivo animal models. We observed that mouse and human T-ALL develop slowly in the BM of tail vertebrae compared with the BM from thorax vertebrae. T-ALL recovered from tail BM displays lower cell-surface marker expression and decreased metabolism and cell-cycle progression, demonstrating a dormancy phenotype. Functionally, tail-derived T-ALL exhibit a deficient short-term ex vivo growth and a delayed in vivo propagation. These features are noncell-autonomous because T-ALL from tail and thorax shares identical genomic abnormalities and functional disparities disappear in vivo and in prolonged in vitro assays. Importantly tail-derived T-ALL displays higher intrinsic resistance to cell-cycle–related drugs (ie, vincristine sulfate and cytarabine). Of note, T-ALL recovered from gonadal adipose tissues or from cocultures with adipocytes shares metabolic, cell-cycle, and phenotypic or chemoresistance features, with tail-derived T-ALL suggesting adipocytes may participate in the tail BM imprints on T-ALL. Altogether these results demonstrate that BM sites differentially orchestrate T-ALL propagation stamping specific features to leukemic cells such as quiescence and decreased response to cell-cycle–dependent chemotherapy.
Visual Abstract
Introduction
T-cell acute lymphoblastic leukemia (T-ALL) is a disease of T-cell progenitors that mainly affects children and young adults. Numerous genomic alterations, such as NOTCH1/FBXW7 mutations, TLX1/3 overexpression, or SIL-TAL1 deletion, are known to induce survival, proliferation, and differentiation block in T-ALL cells.1 Interactions between leukemic cells and their microenvironment also contribute to T-ALL pathogenesis. Cell–cell contacts such as Delta-Like/Jagged-Notch1, integrin LFA1/ICAM1 and secreted factors such as interleukin 7 and 18 or CXCL12 are key players in T-ALL development.2-7 In the course of the disease, T-ALL cells settle in various environments such as thymus, blood, bone marrow (BM), pleura, or lymph nodes, which differ in terms of cell content, extracellular matrix, and secreted factors. To which extent these distinct niches imprint niche-specific features on T-ALL cells is not well understood.
BM microenvironment consists of numerous cellular components such as osteoblasts, endothelial sinusoidal cells, and mesenchymal stromal/stem cells (MSCs) but also hematopoietic cells. BM also contains adipocytes, which are differentiated cells dedicated to store triglycerides. Adipocytes can be found in various areas of the body.8 The extramedullary adipose tissue is schematically separated into white adipose tissue involved in energy storage, endocrine secretion and mechanical protection, and brown adipose tissue, dedicated to thermogenesis. In BM, adipocyte-poor and adipocyte-rich niches, also called red and yellow marrow, respectively, are commonly described.9 The adipocyte-poor BM is a primary site for hematopoiesis. Conversely, the adipocyte-rich BM inhibits hematopoiesis and secretes hormones such as adiponectin.10,11 The adipocyte-rich BM is a dynamic tissue that increases following various injuries such as starvation, irradiation, or chemotherapy.12,13 The adipocyte-rich BM appears around birth and develops during the first weeks of life in the distal skeleton including hands, feet, and distal tibia in humans and tail vertebrae in rodents, giving rise to constitutive marrow adipose tissue.14 Later, during childhood and early adulthood, BM adipocytes develop at the expense of adipocyte-poor BM, thus inducing regulated marrow adipose tissue.14
In recent years, the interplay between adipocytes and solid cancer has been revealed, with adipocytes promoting the growth of breast, ovarian, and prostate cancer.15-17 Concerning the relationships between adipocytes and hematological malignancies, Nalm6 B-cell ALL (B-ALL) and Molm13 AML5b cell lines preferentially engraft into ectopic adipocyte enriched BM, whereas the white adipose tissue protects B-ALL from chemotherapy.13,18-21
Here we investigated how different BM sites control T-ALL development. We focused on constitutive adipocyte-rich or -poor (and inversely hematopoiesis-poor and -rich) BM10 and asked whether T-ALL cells exhibit niche-specific genomic, phenotypic, and proliferative features. Using mouse thoracic vertebrae vs tail vertebrae as respective BM models of constitutive adipocyte-poor and -rich BM, we demonstrate that these 2 BM microenvironments imprint niche-specific characteristics on T-ALL cells, associated with modified cell-cycle and metabolism-related chemoresistance.
Materials and methods
hT-ALL samples and murine ICN1 overexpressing T-ALL cells
Blood samples from patients with human (h)T-ALL were collected at diagnosis at Hôpital Trousseau, Hôpital Robert Debré (Paris, France), or Hôpitaux Civils de Lyon (Lyon, France). Informed consent was obtained in accordance with the Declaration of Helsinki. The ethics committee and the Institutional Review Board of INSERM approved the study of hT-ALL (number 13-105-1). Blood mononuclear cells were isolated using Ficoll and subsequently frozen in fetal bovine serum containing 10% dimethyl sulfoxide. Primary hT-ALL samples were used, unless otherwise stated. Patients’ characteristics are described in supplemental Table 1. J. Ghysdael kindly provided mouse CD45.2 leukemic cells expressing Notch1 intracellular domain 1 (ICN1).22
Mice
Nonobese diabetic/severe combined immunodeficiency /interleukin-2Rγ null mice (NSG, The Jackson Laboratory, Bar Harbor, ME) are produced in pathogen-free animal facilities (Commissariat à l’énergie Atomique et aux Energies Alternatives [CEA], Fontenay-aux-Roses, France). Leukemic cells from human blood samples were injected intravenously through the retro-orbital sinus of NSG mice without any prior irradiation (106 viable cells/mouse). Similarly, CD45.1 C57BL/6 mice (The Jackson Laboratory) received 105 viable CD45.2 ICN1 cells/mouse. T-ALL was regularly monitored in femur using BM samplings after anesthesia (7.5 mg/mL ketamine and 0.05% xylazine) and analgesia (3 µg/mL buprenorphine). All experimental procedures were performed in compliance with French regulations for animal experimentation (animal facility registration number A920322).
Isolation of thoracic or tail vertebrae
After anesthesia and analgesia, mice underwent transcardial perfusion with phosphate-buffered saline and heparin sulfate (10 U/mL, Sigma-Aldrich, St. Louis, MO) before sacrifice. Thoracic or tail vertebrae starting from the fourth tail segment were removed and carefully cleaned.10 For standard histology, each thoracic or tail vertebra was fixed in 4% paraformaldehyde for 24 hours, decalcified, dehydrated, embedded in paraffin, cut in 5-µm sections with a microtome, and further stained with standard hematoxylin and eosin. Otherwise, each thoracic or tail vertebra (3 to 6 segments per site) were minced with scissors in phosphate-buffered saline. Triglyceride content was determined in the upper phase using an enzymatic-based colorimetric assay (PAP150, BioMérieux, Craponne, France). Whenever needed, hT-ALL cells from thoracic or tail vertebrae were purified using anti-hCD45-PE antibody (eBioscience), anti-PE microbeads, large-size columns, and QuadroMACS separator (all from Miltenyi Biotec).
Kinetic analysis of T-ALL engraftment into thoracic or tail vertebrae
NSG mice injected with hT-ALL or C57BL/6 CD45.1 mice injected with murine ICN1 cells were analyzed sequentially (2 mice/time point) over time until they showed clinical signs of illness (ruffled hair, hunched back, weight loss). Cells from thoracic or tail vertebrae were recovered and analyzed using flow cytometry to detect hCD45+/hCD7+ T-ALL within Ter119− cells. In ICN1-injected C57BL/6 mice, CD45.2+/CD45.1− ICN1 leukemic cells were assessed in Ter119− cells from thoracic or tail vertebrae.
In vitro cocultures of T-ALL cells with stromal/hMSC/MS5 or stromal/hMSC/MS5-derived adipocytes
Thorax- or tail-derived hT-ALL cells were cocultured with Delta-like 1 expressing MS5 cells (MS5-DL1).6 A total of 2 × 10⁵ T-ALL cells from thoracic or tail BM niches were plated with MS5-DL1 cells in “T-ALL medium,” as previously described.6 Short-term (7 days) and long-term (28 days) cultures were done.
MS5-derived adipocytes and MSC-derived adipocytes were obtained as described in the supplemental Methods and the cocultures were initiated after the MS5/hMSC was differentiated in adipocytes in differentiating adipocyte medium. T-ALL cells were cocultured with MS5/hMSC or MS5/hMSC-derived adipocytes during a 7-day (short term) or a 28-day period (long term).6,23 Briefly, 2 × 10⁵ T-ALL cells/well were suspended in T-ALL medium and plated in triplicate on MS5/hMSC or MS5/hMSC-derived adipocytic stromas in 24-well plates. The medium was changed every other day. Every 7-day culture period, T-ALL cells were harvested and the number of hCD45+/hCD7+ leukemic cells was evaluated using flow cytometry. T-ALL cells (2 × 10⁵ cells/well) were thereafter replated on new MS5/hMSC or MS5/hMSC-derived adipocytic stromas in fresh T-ALL medium.
Engraftment of thoracic- or tail BM–derived T-ALL cells in secondary mice
hT-ALL cells were isolated from thoracic or tail vertebrae and the same number of T-ALL cells from each condition was injected into secondary nonirradiated NSG mice. T-ALL engraftment was monitored in femur BM until engraftment was >90% or mice displayed any sign of illness.
T-ALL sensitivity to chemotherapy
T-ALL cells were cocultured with MS5 or MS5-derived adipocytes for 3 days in T-ALL medium.6 Vincristine sulfate (0, 1, or 10 nM), cytarabine (500 nM), or dexamethasone (200 nM) (Sigma-Aldrich) were subsequently added to the coculture during a 72-hour period. Cells were harvested and apoptosis was evaluated among hCD45+/hCD7+ cells using Annexin V-Hoechst staining. Vincristine-induced apoptosis represents apoptosis (Annexin V+ cells) with vincristine minus spontaneous apoptosis (no vincristine) in the same territory.
The intrinsic sensitivity of adipocyte-rich and adipocyte-poor T-ALL cells to chemotherapy was studied with hT-ALL isolated from thoracic and tail vertebrae and grown for 72 hours without stromal cells in T-ALL medium containing vincristine sulfate, cytarabine, and dexamethasone.6 Apoptosis was evaluated using flow cytometry in thorax- or tail-derived hCD45+/hCD7+ cells. Results are expressed in fold increase of apoptosis (% Annexin V+ cells) with vincristine compared with spontaneous apoptosis (no vincristine).
Cellular respiration and glycolysis
Oxygen consumption rate (OCR) and extracellular acidification rate (ECAR) were measured using an XFp Extracellular Flux Analyzer (Seahorse Bioscience, North Billerica, MA). Detailed information is provided in the supplemental material.
Quantification of mitochondria mass and membrane potential
Leukemic cells were incubated with 50 nM Mitotracker Green (MTG, M7514, ThermoFisher Scientific) and 100nM TetraMethylRhodamine methyl Ester (TMRE, T669, ThermoFisher Scientific) for 30 minutes at 37°C. Control negative cells are MTG+TMRE–treated cells incubated with carbonyl cyanide 4-(trifluoromethoxy) phenylhydrazone (2920, Sigma-Aldrich) at 50 µM 15 minutes before the end of the staining process. Analyses were done using a FACSCanto (BD Bioscience). The corrected values correspond to mean fluorescence intensity (MFI) of treated cells minus MFI of carbonyl cyanide 4-(trifluoromethoxy) phenylhydrazone–negative control. Other methods are provided in the supplemental material.
Results
T-ALL development depends on the studied BM niche
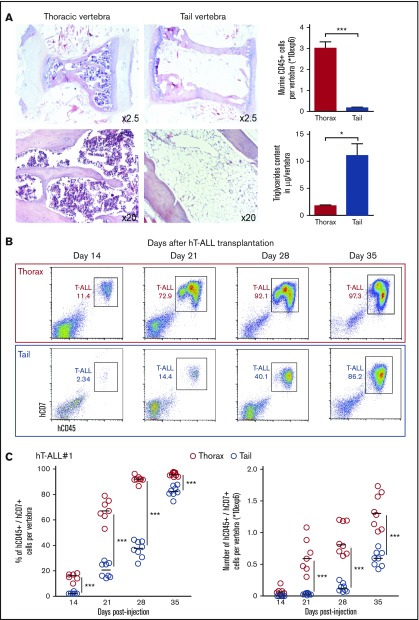
We compared leukemic infiltration in vertebrae localized at 2 distinct levels (thoracic and tail) of the mouse vertebral column that displays a craniocaudal adipocyte gradient.10 In accordance with the literature, we observed in noninjected NSG mice that the thoracic vertebrae are filled with many hematopoietic mCD45+ cells and have low triglyceride content, whereas tail vertebrae contain only few mCD45+ cells and high triglycerides (Figure 1A). As a comparison, thoracic BM cell content resembles the femur BM (supplemental Figure 1A). T-ALL development was measured using sequential tail and thorax BM analyses after hT-ALL cell injection into NSG mice (Figure 1B-C; supplemental Figure 1B-C). Both the percentage and the absolute number of leukemic cells were significantly lower in tail compared with thoracic segments (Figure 1B-C), highlighting a delayed T-ALL cell infiltration in the tail niche. To avoid any misleading conclusion drawn from the xenograft model, T-ALL cell infiltration was also monitored in thoracic and tail BM using murine ICN1-induced T-ALL cells injected into syngeneic C57BL/6 mice (supplemental Figure 1D). Although ICN1 cells could develop in tail BM, the tail infiltration was significantly decreased and delayed compared with thoracic BM. Overall, T-ALL cells infiltrate all BM sites, but T-ALL expansion is strikingly delayed in the adipocyte-rich/hematopoiesis-poor tail BM compared with the other studied BM site, irrespective of the human/mouse T-ALL model.
Figure 1.
Kinetics of hT-ALL#1 engraftment in thoracic and tail vertebrae BM. (A, left) Hematoxylin and eosin histology staining of thoracic or tail vertebrae from NSG mice. (A, right) Absolute number of murine CD45+ hematopoietic cells per thoracic or tail vertebra (n = 15 per site) and triglyceride content of thoracic or tail vertebra (n = 4 per site). (B) Flow cytometry plots of hT-ALL#1 engraftment in thoracic or tail vertebrae as a function of time. (C) Kinetic analysis of hT-ALL#1 engraftment in thoracic or tail BM after injection of 106 primary hT-ALL cells per mice. (Left) Percent of leukemic cells. (Right) Absolute leukemic cell numbers. Two mice (3 to 6 vertebrae per niche and per mice) were euthanized per time point until signs of illness were observed. hT-ALL infiltration was evaluated among Ter119− cells. Other kinetic analyses are provided in supplemental Figure 1B-C. Statistics are calculated according to nonparametric Mann-Whitney U test (*P < .05; ***P < .001).
T-ALL cells display niche-specific cell-surface phenotype but similar genomic abnormalities in thoracic and tail BM
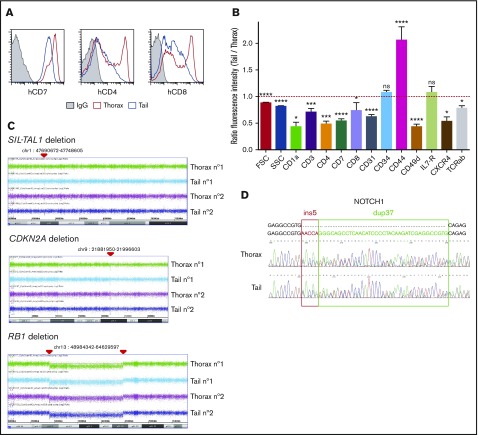
We next characterized T-ALL cells from thoracic, femur, and tail niches in terms of cell-surface markers. hT-ALL cells displayed a distinct cell-surface phenotype in thoracic and tail BM, whereas femur- and thorax-derived cells were similar. Leukemic cells from the tail BM had a decreased forward and side scatter and expressed significantly lower CD7, CD1a, CD3, TCRαβ, CD4, CD8, CD49d, CXCR4, and CD31 surface expression but increased CD44 surface expression compared with thoracic BM (Figure 2A-B; supplemental Figure 2A-B), whereas thorax- and femur-derived T-ALL had comparable cell-surface marker levels (supplemental Figure 2C). Similar results were observed in the murine ICN1 model: the tested cell-surface marker expression was different in thoracic and tail BM-derived cells (supplemental Figure 2D).
Figure 2.
Phenotype and genomic analyses of tail- and thorax-derived T-ALL. (A) Phenotype comparison of human CD45+ T-ALL isolated from thorax (red line) and tail (blue line) vertebrae from hT-ALL#1. Shown are results from a representative mouse. Other examples are shown in supplemental Figure 2. (B) Ratio fluorescence intensity (RFI) in hT-ALL from tail- vs thorax-derived BM. RFI was calculated using the MFI of tail-derived hT-ALL divided by the MFI of thorax-derived hT-ALL cells. Five hT-ALL (#1-#5) tested, 16 to 20 mice per cell-surface marker. Mean values (± standard error of the mean [SEM]) are indicated. (C) CGH arrays of purified thorax- or tail-derived hT-ALL#1 cells. A 58-kb SIL-TAL1 deletion on 1p32 and 1p33 loci, homozygous CDKN2A deletion on 9p21.3 locus, and homozygous RB1 deletion followed by an heterozygous 54-Mb deletion between 13q14 and 13q21 loci. Representative of 2 mice. CGH arrays of hT-ALL#2 and #4 are provided in supplemental Table 3. (D) Sanger sequencing of NOTCH1 (exon 27) in thorax- and tail-derived hT-ALL#1 (list of primers provided in supplemental Table 2). NOTCH1 mutations of hT-ALL#2 and #4 are provided in supplemental Figure 3. *P < .05; ***P < .001; ****P < .0001; ns, not significant (Mann-Whitney U test).
These niche-specific T-ALL characteristics may either be induced by the distinct microenvironment in tail/thoracic BM (noncell autonomous) or result from the selection of distinct clones in those niches (cell autonomous). To distinguish between these 2 hypotheses, we performed comparative genomic hybridization (CGH) analysis of T-ALL cells isolated from thoracic and tail BM. In hT-ALL#1, leukemic cells exhibited the same SIL-TAL1, CDKN2A, and RB1 deletions in thoracic and tail niches (Figure 2C). Similarly, cytogenetic defects of hT-ALL#2 and #4 were perfectly matched in thoracic and tail BM (supplemental Table 3). NOTCH1 mutations were also identical in hT-ALL cells isolated from thoracic and tail niches (Figure 2D; supplemental Figure 3); no FBXW7 mutation were detected in hT-ALL#1, #2, or #4, whatever their BM origin (data not shown).1 These similar genomic results were confirmed for the hT-ALL#1 sample using whole exome sequencing (WES; data not shown). Altogether, these data indicate that T-ALL cells from thoracic or tail BM are phenotypically different but genomically similar, questioning the impact of the BM sites on T-ALL characteristics.
Tail-derived T-ALL phenotype and growth features fade away during ex vivo cultures
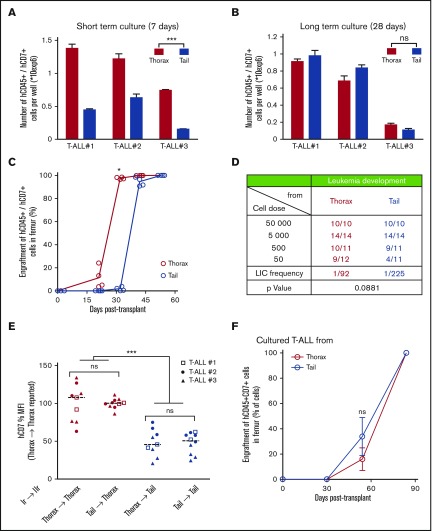
To track down the role of the microenvironment in T-ALL development, thoracic- and tail-derived hT-ALL cells were isolated and their growth studied in identical ex vivo conditions using cocultures with MS5-DL1 stromal cells.5,23 In short-term cocultures (ie, evaluated 7 days after starting the assay), the ex vivo production of leukemic cells from tail-derived hT-ALL was significantly lower than that obtained from thorax-derived hT-ALL cultures (Figure 3A), suggesting a short-term, niche-specific imprints on T-ALL growth. When the ex vivo growth of hT-ALL cells was extended for 3 additional weeks (ie, up to day 28), thoracic- and tail BM-derived hT-ALL cells produced similar numbers of cells (Figure 3B). Moreover, the phenotype of thoracic and tail BM T-ALL cells also became similar after the 28-day ex vivo period, contrasting with the niche-specific T-ALL phenotypes observed when the cells had been recovered from mouse BM (supplemental Figure 4). Interestingly, a comparable phenotype between thorax- and tail-derived T-ALL cells was observed as early as day 12 after the start of the ex vivo coculture for one tested T-ALL (supplemental Figure 4C), indicating the phenotype switch occur rapidly in a permissive microenvironment.
Figure 3.
T-ALL characteristics are under BM niches influence. (A) Leukemic cell production starting from freshly purified hT-ALL cells derived from thoracic or tail vertebrae BM after short-term (left; day 7) or (B) long-term (right; day 28) coculture with MS5-DL1 stromal cells. Shown are means ± SEM of triplicate cultures. (C) Kinetic of leukemia development in secondary mice after transplantation of 500 hT-ALL#1 cells recovered from thorax (red) and tail (blue) vertebrae. Secondary transplantations of hT-ALL#2 and hT-ALL#3 are provided in supplemental Figure 3. (D) Limiting dilution transplantation of 3 hT-ALL (#1-#3) isolated from thoracic or tail BM into secondary mice (from 5 × 10⁴ cells to 50 cells per mouse). T-ALL development was monitored using iterative femur samplings. Positive mice contain more than 90% hCD45+/hCD7+ T-ALL cells. (E) Human hCD7 cell-surface expression of hT-ALL recovered in tail and thorax vertebrae from secondary mice (IIr, 19 mice) transplanted with hT-ALL isolated from primary (Ir) mouse tail and thorax. (F) Thorax- and tail-derived hT-ALL#1 cells were grown in coculture with MS5-DL1 cells for 12 days before transplantation into secondary mice (500 cells/mouse, 4 mice/niche). Kinetic of hT-ALL engraftment in the femurs of mice is shown. Representative of 2 experiments. Mean data (± SEM) are indicated. Statistics are calculated according to nonparametric Mann-Whitney U test (*P < .05; ***P < .001).
Niche-dependent T-ALL features are recapitulated after secondary transplants
The question of the niche imprints on T-ALL phenotype and growth was further explored after secondary transplants of xenografted cells isolated from the primary tail and thorax vertebrae. We observed that both thorax- and tail-derived T-ALL cells could infiltrate tail and thorax vertebrae and femurs (Figure 3C-E). A kinetic of femur BM samplings indicated that tail-derived cells have a delayed infiltration ability compared with thorax-derived cells and a limiting dilution analysis showed a twofold, albeit not significant, diminished ability to invade secondary BM femur (Figure 3C-D; supplemental Figure 5A). These characteristics resulted in prolonged survival of mice transplanted with tail-derived T-ALL (supplemental Figure 5B). When analyzing T-ALL cells from thorax and tail vertebra in secondary mice, we found that the phenotype of cells was independent of the primary BM of origin but rather relied on the secondary BM site to which the cells had migrated. As an example, hCD7 expression measured on tail-derived T-ALL cells was always lower than the one measured on thorax-derived T-ALL cells whatever thoracic- or tail-primary site the cells originated from (Figure 3E; supplemental Figure 5C). Importantly, when secondary transplants were done with thorax- and tail-derived cells precultured 12 days in contact with MS5-DL1 stromal cells, leukemia development and mouse survival were no longer different whatever BM sites the cells came from (Figure 3F; supplemental Figure 5D), indicating that the original BM imprint on growth and phenotype of T-ALL was gradually lost upon immersion in a permissive microenvironment. Thus, T-ALL niche-specific growth and phenotype are noncell-autonomous features induced by the BM microenvironment.
T-ALL recovered from different BM niches display niche-specific metabolism and cell cycle
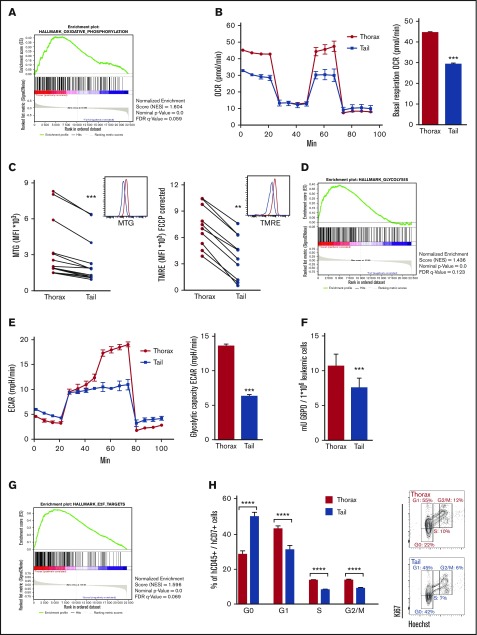
Thorax- and tail-derived hT-ALL was next characterized in terms of gene expression using human-specific Affymetrix gene arrays (supplemental Figure 6). Of the different activated pathways, there was a significant enrichment for oxidative phosphorylation (OXPHOS) in hT-ALL from thorax BM (Figure 4A). Because OXPHOS includes the mitochondria electron transport chain, we measured OCR in T-ALL from thorax and tail. Results show very similar OCR profiles in T-ALL recovered from both BM sites, although the basal OXPHOS was significantly lower in tail compared with thorax-derived hT-ALL (Figure 4B), suggesting tail-derived cells are resting. These results were related to lower mitochondrial mass as shown using MTG accumulation in mitochondrial matrix (Figure 4C, left), but also to weaker activity or weak polarization of mitochondria membrane in tail vs thorax-derived hT-ALL (Figure 4C, right). Interestingly, microarray analyses also pointed to glycolysis differences in T-ALL from thorax and tail BM (Figure 4D). These results were confirmed by measuring the glycolytic capacity of the BM-derived T-ALL, with the glycolytic reserve being absent from tail-derived T-ALL, whereas their basal glycolysis looks normal (Figure 4E). Moreover, the enzymatic activity of G6PD, a major enzyme implicated in the pentose phosphate pathway and one of the top differentially expressed genes of the glycolysis signature, was diminished in tail- vs thorax-derived hT-ALL (Figure 4F). Finally, gene array analyses indicated an enrichment of E2F targets in thorax- vs tail-derived hT-ALL, suggesting cell-cycle modifications in thorax and tail hT-ALL (Figure 4G), which were further confirmed by enhanced E2F1 expression levels in thorax compared with tail hT-ALL (supplemental Figure 7A) and cell-cycle progression profiles. Thorax-derived cells were actively proliferating, whereas tail-derived cells were more frequently in the G0 state of the cell cycle (Figure 4H; supplemental Figure 7B-C). Last, microarrays highlighted an increased activated apoptotic pathway in the tail-derived niche. MCL1 expression levels and Hoechst/Annexin V labeling confirmed this higher apoptosis in tail-derived hT-ALL even though the survival remained >80% in both territories (supplemental Figure 8). Altogether, these results show that BM niches impinge differently on proliferation and metabolism of leukemic cells with tail/adipocyte-rich BM-derived hT-ALL being low cycling and metabolically less active cells. As expected from the results presented previously, the tail-derived impact on T-ALL was reversible during cocultures with MS5-DL1 stromal cells (supplemental Figure 9), further supporting the microenvironment imprints on leukemic cell growth.
Figure 4.
Microarray expression analyses reveal the low mitochondrial respiration, low glycolysis, and delayed cell-cycle progression of tail-derived hT-ALL. Microarrays of thorax- or tail-derived hT-ALL were performed in 3 hT-ALL (#1, #3, #10). (A) Gene set enrichment analysis (GSEA) (Affymetrix arrays) for hallmark oxidative phosphorylation in thorax- or tail-derived hT-ALL. (B, left) OCR measured in thorax- and tail-derived hT-ALL#1 using XFp Analyzer (Seahorse Bioscience). (B, right) Basal respiration (OCR) for 4 experiments. (C, left) Comparison between MFI of MTG from thorax- and tail-derived hT-ALL (4 hT-ALL, 14 mice). (C, right) Comparison between MFI of TMRE from thorax-derived and tail-derived hT-ALL (2hT-ALL, 10 mice). (D) GSEA for Hallmark glycolysis in thorax-derived or tail-derived hT-ALL. (E, left) ECAR measured in thorax-and tail-derived hT-ALL#1 using XFp Analyzer. (E, right) Glycolytic capacity (ECAR) for 2 hT-ALL. (F) Comparison between G6PD activity in thorax- and tail-derived hT-ALL#3 for 3 mice. (G) GSEA for hallmark E2F targets in thorax- or tail-derived hT-ALL. (H, left) Leukemic cells in G0, G1, S, and G2/M phases across hT-ALL samples (6 hT-ALL, 20 mice). (H, right) Ki67-Hoechst cell-cycle analysis by flow cytometry for thorax- or tail-derived hT-ALL#1. Statistics are calculated according to nonparametric Wilcoxon or Mann-Whitney U test (**P < .01; ***P < .001; ****P < .0001). FDR, false discovery rate.
T-ALL recovered from tail and thorax BM niches have different chemoresistance
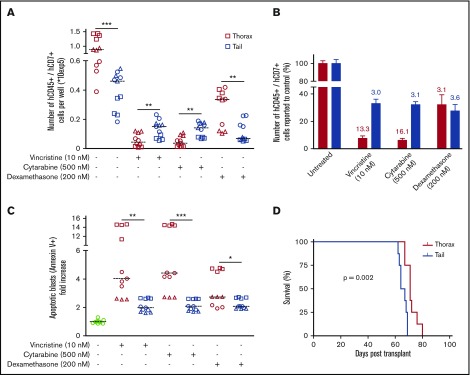
Because tail-derived hT-ALL cells display a decreased cell-cycle progression and a low metabolism, we speculated that their intrinsic sensitivity to drugs might be different compared with thorax-derived hT-ALL cells. Leukemic cells isolated from thoracic or tail vertebrae were maintained 72 hours in complete medium containing 10 nM vincristine sulfate, 500 nM cytarabine, or 200 nM dexamethasone. We observed that tail-derived hT-ALL cells display a lower sensitivity to cell-cycle–related vincristine and cytarabine drugs compared with thorax-derived hT-ALL cells. Such results were not observed for dexamethasone. Indeed, significantly higher cell numbers were recovered from the vincristine and cytarabine conditions in the case of tail- compared with thorax-derived hT-ALL (Figure 5A-B) as well as lower drug-induced apoptosis (Figure 5C) although these levels remained low (<15%), as documented previously (supplemental Figure 8). When thorax- and tail-derived T-ALL cells were grown 72 hours in 10 nM vincristine and transplanted at equal numbers in secondary immunodeficient mice, (1) tail- and thorax-derived treated hT-ALL cells were able to r-initiate leukemia in vivo and (2) mice receiving vincristine-treated tail-derived cells succumbed 10 days before those injected with thorax-derived cells (Figure 5D), indicative of lower tail-derived hT-ALL sensitivity to vincristine. Altogether, the effect of vincristine sulfate was more drastic on thorax-derived hT-ALL cells compared with tail-derived hT-ALL cells, indicating tail BM protects hT-ALL from chemotherapy.
Figure 5.
BM niches influence chemosensitivity of hT-ALL. (A) Absolute numbers of hT-ALL recovered after in vitro treatment of thorax- and tail-derived T-ALL during 72 hours with 10 nM vincristine, 500 nM cytarabine, or 200 nM dexamethasone. Results are from 3 hT-ALL (#1-#3) individually cultured as tri- or quadruplicates. The line shows median cell numbers. (B) Same results calculated as fold decrease compared with untreated conditions. (C) Apoptosis levels in T-ALL cells treated (+) or not (−) with vincristine, cytarabine, or dexamethasone. Shown are apoptotic cell increases (in fold) relative to untreated thorax- or tail-derived hT-ALL cells. (D) Survival of secondary mice transplanted with 1300 to 13 000 cells/mouse following 72 hours in vitro treatment with 10 nM vincristine. Results are from 8 mice/group, hT-ALL#1. Statistics are calculated according to log-rank (Mantel-Cox) test (D) or nonparametric Mann-Whitney U test (*P < .05; **P < .01; ***P < .001).
T-ALL isolated from other adipocyte niches share common features with tail-derived hT-ALL including drug-resistance
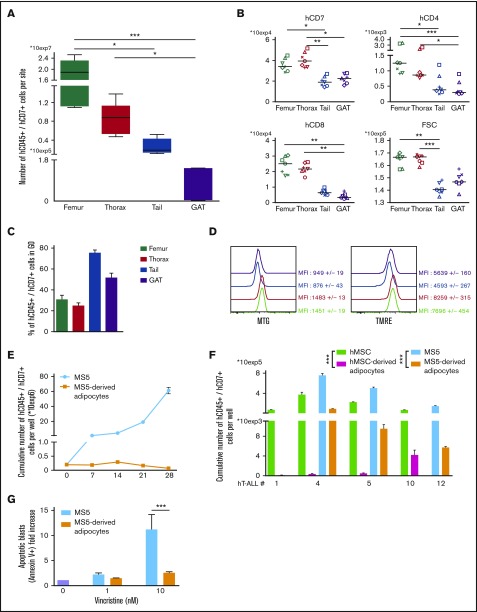
With tail vertebrae being full of adipocytes (Figure 1A), we investigated whether another adipocyte niche would similarly imprint on T-ALL. We studied T-ALL infiltration in the gonadal adipose tissue (GAT) and observed that, as in tail BM, few leukemic cells are detected compared with any of the studied BM sites (Figure 6A). Phenotype analysis outlined similar decreased surface marker expression in GAT- and tail-derived hT-ALL cells that differ from femur- and thorax-derived hT-ALL (Figure 6B). This was observed although BM and GAT adipocytes are not strictly similar: BM adipocytes share characteristics of white and brown adipocytes and GAT is a white adipocyte tissue.24 Importantly, cell cycle and the metabolic state of GAT- and tail-derived hT-ALL cells were similarly altered compared with the other BM sites (Figure 6C-D). These results show that GAT-derived hT-ALL share many characteristics with tail-derived hT-ALL. We also explored the adipocyte influence on leukemic cell behavior during T-ALL cocultures in the presence of adipocytes derived from the differentiation of mouse stromal MS5 cells or of human MSC. We observed that T-ALL cells poorly grow upon cocultures with adipocytes, either from murine or human origin, albeit the rich cytokine containing T-ALL medium6 was added to the cultures (Figure 6E-F). T-ALL grown in such conditions had variable cell-cycle progression and did not differ in phenotype compared with cocultures with undifferentiated MS5 cells (supplemental Figure 10A-B), suggesting that in vitro conditions do not faithfully recapitulate the in vivo niche situation. Because BM adipocytes might protect hT-ALL from chemotherapy, we assessed T-ALL sensitivity to 1 and 10 nM of vincristine during cocultures with MS5 or MS5-derived adipocytes. Vincristine-mediated apoptosis was lower when leukemic cells were grown with MS5-derived adipocytes compared with MS5 cells (Figure 6G), thus demonstrating that BM adipocytes may take part in hT-ALL chemoresistance observed in the adipocyte-rich tail BM.
Figure 6.
hT-ALL from gonadal adipose tissue and recovered from cocultures with adipocytes share similar features with tail-derived hT-ALL. (A) Leukemic cell numbers recovered from femur, thorax vertebrae, tail vertebrae, and GAT <2 months after hT-ALL#1 transplantation. Shown are boxplots ±SEM of 7 mice receiving 5 × 10⁴ leukemic cells. (B) Levels of cell-surface expression of hCD7, hCD4, and hCD8 markers on hT-ALL#1 recovered from femurs, thorax, tail, and GAT of NSG engrafted mice. Statistics are calculated according to nonparametric Friedman test (*P < .05; **P < .01; ***P < .001). (C) Cell-cycle analysis and (D) metabolism status ([left] MTG; [right] TMRE labeling panels) of hT-ALL#1 leukemic cells recovered from the different tested sites. Data are from 3 mice. (E) Cumulative growth of hT-ALL#10 cells during cocultures with MS5 and MS5-derived adipocytes. (F) Histograms are mean values (± SEM) of hT-ALL (#1, #4, #5, #10, #12) cells cocultures during 7 days on MS5, hMSC, MS5-derived, and hMSC-derived adipocytes. All cocultures were performed in triplicate. (G) Apoptosis levels of hT-ALL during cocultures with MS5 (blue) or MS5-derived adipocytes (orange) in presence of 1 to 10 nM vincristine. Histograms provide vincristine-induced apoptosis (calculated as ratio of % Annexin V+ cells with vincristine over the spontaneous apoptosis [ie, without vincristine]). Shown are results from 3 experiments performed with 2 hT-ALL samples tested in triplicate. Statistics in panel G are calculated according to nonparametric Mann-Whitney U test; ***P < .001.
Discussion
Here we demonstrate that different BM sites induce specific survival, metabolism, cell-cycle progression, and phenotype in T-ALL, resulting in a decreased chemosensitivity of tail-derived T-ALL cells. Tail BM is a constitutive marrow adipose tissue in rodents resembling adipocyte-rich BM found in hands, feet, or distal tibia in humans.14 Besides, thoracic BM mirrors classical adipocyte-poor BM and T-ALL features are highly similar in thoracic and femoral BM in mice. Studying leukemia propagation in those BM sites, we show that the timing of T-ALL growth is niche specific. The decreased proliferation and/or increased quiescence in adipocyte-rich BM are likely to explain this delayed development. The distal localization of constitutive adipocyte-rich BM and/or a specific vascularization of this territory may also play a role, at least in the early steps. In this respect, distal constitutive adipocyte-rich BM resembles metastatic areas found in solid cancers, in which circulating cancer cells display a low survival but an increased quiescence during latent metastasis.25 Data obtained in vitro using cocultures and in vivo in GAT suggest that adipocyte-rich tail BM is an inhospitable niche for T-ALL cells, where adipocytes could influence T-ALL features. Whether there are negative signals mediated through secreted molecules/cytokines or high nutriment uptake by adipocytes remains to be addressed. It could also be argued that adipocytes lack positive signals, such as IL7, Notch activation, or glucose deprivation, and/or that other T-ALL supportive cells (MSC, endothelial cells) are missing or different from thorax BM sites, resulting in a low stimulation of T-ALL. For instance, vascular or perivascular niche may differently influence T-ALL propagation in the thorax and tail BM; future experiments will have to address this point. Meanwhile, and contrary to in vitro results, T-ALL develops in tail BM, suggesting that T-ALL somehow overcomes the niche situation in the course of T-ALL propagation.25
Our results show that T-ALL genomic profiles are identical in leukemic cells isolated from thoracic and tail niches. And even though the latter techniques may have failed to detect any niche-specific mutation, thorax- and tail-derived leukemic cells exhibit similar growth after long term ex vivo coculture. Also, the entire thoracic and tail leukemic populations, but not subpopulations, recover identical expression of several cell-surface markers as early as day 12, further arguing against any ex vivo clonal selection. Last, propagation into secondary mice becomes similar when thorax- and tail-derived T-ALL cells are grown for 12 days in the same ex vivo environment. Altogether, these results strongly support that the BM microenvironment provides a cell-extrinsic education of the leukemic cells independently of their cell-intrinsic genetics.26 In everyday medical practice, leukemic infiltration and molecular and phenotypic characteristics are usually inferred from leukemic cells sampled from blood, sternum, or iliac crest BM. Our data clearly show that proliferative and phenotypic data obtained from these specific environments cannot be generalized to all niches. Although our genomic data suggest that sternal/iliac crest molecular features can be generalized to slow-cycling niches, we cannot exclude intronic differences not detected by the WES technique. Also, xenografting human leukemia selects cells, sometimes in the minority at diagnosis, share genomic or transcriptomic characteristics with relapse cells.27 Whether the clonal architecture is strictly identical in human slow-cycling and high-cycling BM niches remains to be proven, especially in more oligoclonal samples.28
Genomic alterations induce a T-cell differentiation block and genome-specific cell-surface phenotype.29 In our study, we show that the niche also promotes a specific cell-surface phenotype. The T-ALL cell-surface phenotype is therefore the complex result of genomic and niche parameters, indicating a high plasticity of blast cells in response to the in vivo or in vitro microenvironment.30 Although hCD7+/hCD34+ or hCD7+/hCD1a− T-ALL cell fractions are enriched in hT-ALL initiating capacity,31,32 it is likely that the microenvironment in which T-ALL cells are immersed before transplantation may contribute to the leukemia initiating capacity, bringing into question the fidelity of surface markers to universally identify hT-ALL initiating capacity.
Finally, our data demonstrate that constitutive slow-cycling BM reduces T-ALL sensitivity to chemotherapy. Various cell-autonomous and noncell-autonomous mechanisms contribute to chemoresistance and relapse. Selection of chemoresistant clones, novel mutations, and promoter hypomethylation contribute to hT-ALL relapse.33 The microenvironment, notably through MSC, also participates in chemoresistance.34 Adipocytes from extramedullar white adipose tissue protect B-ALL from various chemotherapies such as vincristine, daunorubicin, nilotinib, or l-asparaginase.18-20 Our study extends previous data to constitutive BM adipocytes. It is noteworthy that CD44, a cell-surface adhesion molecule involved in T-ALL chemoresistance,35 was increased in adipocyte-rich BM-derived T-ALL. Indeed, both T-ALL cell-cycle blockage/quiescence and increased hCD44 expression may participate in T-ALL chemoresistance. Because the leukemic initiating capacity is maintained in tail-derived T-ALL cells, slow-cycling BM may therefore be a protective niche during cell-cycle targeting drug treatments, from which dormant relapse-mediated T-ALL cells emanate. In comparison with children, the increased BM adiposity found in adults, which is somehow mimicked by tail BM here, may participate in the poorer adult T-ALL outcome. Furthermore, chemotherapy increases BM adiposity.13 It may be speculated that chemotherapy-induced adipocytes further decrease cell-cycle progression and allow remaining T-ALL cells to escape from subsequent chemotherapy.
In conclusion, this study unravels the key regulatory impact of constitutive slow-cycling BM on T-ALL growth and phenotype, which translates into an increased resistance to chemotherapy in this BM territory. Understanding the molecular basis of niche-related protection will help eradicate T-ALL cells and is essential to improving T-ALL therapy.
Supplementary Material
The full-text version of this article contains a data supplement.
Acknowledgments
Mouse work was facilitated by Christophe Joubert and Julien Tilliet from the Institut de Radiobiologie Cellulaire et Moléculaire/CEA animal facility. The authors thank Julien Rucci for his technical help in experiments and Rima Haddad and Irina Naguibneva for critically reading the manuscript. Damien Roos-Weil and Olivier Bernard helped with genomic WES analyses.
This work was supported by INSERM, CEA, Université Paris Diderot, Université Paris Sud, Institut National du Cancer (INCA), Cancéropôle d’Ile de France, Région Ile de France, Ligue Nationale contre le Cancer (LNCC, équipe labellisée), and the Association Laurette Fugain and Fondation de France. X.C. and S.P. were fellows of INCA and LNCC.
Authorship
Contribution: X.C. and J.C. designed and performed experiments, analyzed data, and wrote the paper; N.P., B.C., and C.J. performed experiments and analyzed data; E.D., M.-L.A., S.P., and B.U. analyzed data and gave advices on the manuscript; J.L., P.B., A.P., T.L., A.B., J.L.-P., and F.B. provided patient samples and clinical data; and F.P. coordinated and directed the study and wrote the paper.
Conflict-of-interest disclosure: The authors declare no competing financial interests.
The current affiliation for X.C. is Institut de Duve, Brussels, Belgium.
Correspondence: Francoise Pflumio, Laboratoire des cellules Souches Hématopoïétiques et Leucémiques, Equipe labellisée Ligue contre le Cancer, IRCM, CEA, 18 route du panorama, 92260 Fontenay-aux-Roses, France; e-mail: francoise.pflumio@cea.fr; or Xavier Cahu, Laboratoire des cellules Souches Hématopoïétiques et Leucémiques, Equipe labellisée Ligue contre le Cancer, IRCM, CEA, 18 route du panorama, 92260 Fontenay-aux-Roses, France; e-mail: cahu_xavier@yahoo.fr.
References
- 1.Van Vlierberghe P, Ferrando A. The molecular basis of T cell acute lymphoblastic leukemia. J Clin Invest. 2012;122(10):3398-3406. [DOI] [PMC free article] [PubMed] [Google Scholar]
- 2.Passaro D, Irigoyen M, Catherinet C, et al. CXCR4 is required for leukemia-initiating cell activity in T cell acute lymphoblastic leukemia. Cancer Cell. 2015;27(6):769-779. [DOI] [PubMed] [Google Scholar]
- 3.Pitt LA, Tikhonova AN, Hu H, et al. CXCL12-producing vascular endothelial niches control acute T cell leukemia maintenance. Cancer Cell. 2015;27(6):755-768. [DOI] [PMC free article] [PubMed] [Google Scholar]
- 4.Silva A, Laranjeira AB, Martins LR, et al. IL-7 contributes to the progression of human T-cell acute lymphoblastic leukemias. Cancer Res. 2011;71(14):4780-4789. [DOI] [PubMed] [Google Scholar]
- 5.Uzan B, Poglio S, Gerby B, et al. Interleukin-18 produced by bone marrow-derived stromal cells supports T-cell acute leukaemia progression. EMBO Mol Med. 2014;6(6):821-834. [DOI] [PMC free article] [PubMed] [Google Scholar]
- 6.Armstrong F, Brunet de la Grange P, Gerby B, et al. NOTCH is a key regulator of human T-cell acute leukemia initiating cell activity. Blood. 2009;113(8):1730-1740. [DOI] [PubMed] [Google Scholar]
- 7.Winter SS, Sweatman JJ, Lawrence MB, Rhoades TH, Hart AL, Larson RS. Enhanced T-lineage acute lymphoblastic leukaemia cell survival on bone marrow stroma requires involvement of LFA-1 and ICAM-1. Br J Haematol. 2001;115(4):862-871. [DOI] [PubMed] [Google Scholar]
- 8.Rosen ED, Spiegelman BM. What we talk about when we talk about fat. Cell. 2014;156(1-2):20-44. [DOI] [PMC free article] [PubMed] [Google Scholar]
- 9.Tavassoli M, Crosby WH. Bone marrow histogenesis: a comparison of fatty and red marrow. Science. 1970;169(3942):291-293. [DOI] [PubMed] [Google Scholar]
- 10.Naveiras O, Nardi V, Wenzel PL, Hauschka PV, Fahey F, Daley GQ. Bone-marrow adipocytes as negative regulators of the haematopoietic microenvironment. Nature. 2009;460(7252):259-263. [DOI] [PMC free article] [PubMed] [Google Scholar]
- 11.Cawthorn WP, Scheller EL, Learman BS, et al. Bone marrow adipose tissue is an endocrine organ that contributes to increased circulating adiponectin during caloric restriction. Cell Metab. 2014;20(2):368-375. [DOI] [PMC free article] [PubMed] [Google Scholar]
- 12.Scheller EL, Rosen CJ. What’s the matter with MAT? Marrow adipose tissue, metabolism, and skeletal health. Ann N Y Acad Sci. 2014;1311:14-30. [DOI] [PMC free article] [PubMed] [Google Scholar]
- 13.Sheng X, Mittelman SD. The role of adipose tissue and obesity in causing treatment resistance of acute lymphoblastic leukemia. Front Pediatr. 2014;2:53. [DOI] [PMC free article] [PubMed] [Google Scholar]
- 14.Scheller EL, Doucette CR, Learman BS, et al. Region-specific variation in the properties of skeletal adipocytes reveals regulated and constitutive marrow adipose tissues. Nat Commun. 2015;6:7808. [DOI] [PMC free article] [PubMed] [Google Scholar]
- 15.Nieman KM, Kenny HA, Penicka CV, et al. Adipocytes promote ovarian cancer metastasis and provide energy for rapid tumor growth. Nat Med. 2011;17(11):1498-1503. [DOI] [PMC free article] [PubMed] [Google Scholar]
- 16.Manabe Y, Toda S, Miyazaki K, Sugihara H. Mature adipocytes, but not preadipocytes, promote the growth of breast carcinoma cells in collagen gel matrix culture through cancer-stromal cell interactions. J Pathol. 2003;201(2):221-228. [DOI] [PubMed] [Google Scholar]
- 17.Herroon MK, Rajagurubandara E, Hardaway AL, et al. Bone marrow adipocytes promote tumor growth in bone via FABP4-dependent mechanisms. Oncotarget. 2013;4(11):2108-2123. [DOI] [PMC free article] [PubMed] [Google Scholar]
- 18.Pramanik R, Sheng X, Ichihara B, Heisterkamp N, Mittelman SD. Adipose tissue attracts and protects acute lymphoblastic leukemia cells from chemotherapy. Leuk Res. 2013;37(5):503-509. [DOI] [PMC free article] [PubMed] [Google Scholar]
- 19.Behan JW, Yun JP, Proektor MP, et al. Adipocytes impair leukemia treatment in mice. Cancer Res. 2009;69(19):7867-7874. [DOI] [PMC free article] [PubMed] [Google Scholar]
- 20.Ehsanipour EA, Sheng X, Behan JW, et al. Adipocytes cause leukemia cell resistance to L-asparaginase via release of glutamine. Cancer Res. 2013;73(10):2998-3006. [DOI] [PMC free article] [PubMed] [Google Scholar]
- 21.Liu Z, Xu J, He J, et al. Mature adipocytes in bone marrow protect myeloma cells against chemotherapy through autophagy activation. Oncotarget. 2015;6(33):34329-34341. [DOI] [PMC free article] [PubMed] [Google Scholar]
- 22.Gachet S, Genescà E, Passaro D, et al. Leukemia-initiating cell activity requires calcineurin in T-cell acute lymphoblastic leukemia. Leukemia. 2013;27(12):2289-2300. [DOI] [PubMed] [Google Scholar]
- 23.Poglio S, Cahu X, Uzan B, et al. Rapid childhood T-ALL growth in xenograft models correlates with mature phenotype and NF-κB pathway activation but not with poor prognosis. Leukemia. 2015;29(4):977-980. [DOI] [PubMed] [Google Scholar]
- 24.Jöhrer K, Ploner C, Thangavadivel S, Wuggenig P, Greil R. Adipocyte-derived players in hematologic tumors: useful novel targets? Expert Opin Biol Ther. 2015;15(1):61-77. [DOI] [PubMed] [Google Scholar]
- 25.Massagué J, Obenauf AC. Metastatic colonization by circulating tumour cells. Nature. 2016;529(7586):298-306. [DOI] [PMC free article] [PubMed] [Google Scholar]
- 26.Miething C, Scuoppo C, Bosbach B, et al. PTEN action in leukaemia dictated by the tissue microenvironment. Nature. 2014;510(7505):402-406. [DOI] [PMC free article] [PubMed] [Google Scholar]
- 27.Clappier E, Gerby B, Sigaux F, et al. Clonal selection in xenografted human T cell acute lymphoblastic leukemia recapitulates gain of malignancy at relapse. J Exp Med. 2011;208(4):653-661. [DOI] [PMC free article] [PubMed] [Google Scholar]
- 28.Poglio S, Lewandowski D, Calvo J, et al. Speed of leukemia development and genetic diversity in xenograft models of T cell acute lymphoblastic leukemia. Oncotarget. 2016;7(27):41599-41611. [DOI] [PMC free article] [PubMed] [Google Scholar]
- 29.Ferrando AA, Neuberg DS, Staunton J, et al. Gene expression signatures define novel oncogenic pathways in T cell acute lymphoblastic leukemia. Cancer Cell. 2002;1(1):75-87. [DOI] [PubMed] [Google Scholar]
- 30.Meacham CE, Morrison SJ. Tumour heterogeneity and cancer cell plasticity. Nature. 2013;501(7467):328-337. [DOI] [PMC free article] [PubMed] [Google Scholar]
- 31.Gerby B, Clappier E, Armstrong F, et al. Expression of CD34 and CD7 on human T-cell acute lymphoblastic leukemia discriminates functionally heterogeneous cell populations. Leukemia. 2011;25(8):1249-1258. [DOI] [PubMed] [Google Scholar]
- 32.Chiu PP, Jiang H, Dick JE. Leukemia-initiating cells in human T-lymphoblastic leukemia exhibit glucocorticoid resistance. Blood. 2010;116(24):5268-5279. [DOI] [PubMed] [Google Scholar]
- 33.Kunz JB, Rausch T, Bandapalli OR, et al. Pediatric T-cell lymphoblastic leukemia evolves into relapse by clonal selection, acquisition of mutations and promoter hypomethylation. Haematologica. 2015;100(11):1442-1450. [DOI] [PMC free article] [PubMed] [Google Scholar]
- 34.Iwamoto S, Mihara K, Downing JR, Pui CH, Campana D. Mesenchymal cells regulate the response of acute lymphoblastic leukemia cells to asparaginase. J Clin Invest. 2007;117(4):1049-1057. [DOI] [PMC free article] [PubMed] [Google Scholar]
- 35.Hoofd C, Wang X, Lam S, et al. CD44 promotes chemoresistance in T-ALL by increased drug efflux. Exp Hematol. 2016;44(3):166-171. [DOI] [PubMed] [Google Scholar]
Associated Data
This section collects any data citations, data availability statements, or supplementary materials included in this article.


