

Abstract
Aims
First, to conduct a detailed exploration of the prospective relations between four commonly used anthropometric measures with incident diabetes and to examine their consistency across different population subgroups. Second, to compare the ability of each of the measures to predict five-year risk of diabetes.
Methods
We conducted a meta-analysis of individual participant data on body mass index (BMI), waist circumference (WC), waist-hip and waist-height ratio (WHtR) from the Obesity, Diabetes and Cardiovascular Disease Collaboration. Cox proportional hazard models were used to estimate the association between a one standard deviation increment in each anthropometric measure and incident diabetes. Harrell's concordance statistic was used to test the predictive accuracy of each measure for diabetes risk at five years.
Results
Twenty-one studies with 154,998 participants and 9342 cases of incident diabetes were available. Each of the measures had a positive association with incident diabetes. A one standard deviation increment in each of the measures was associated with 64-80% higher diabetes risk. WC and WHtR more strongly associated with risk than BMI (ratio of hazard ratios: 0.95 [0.92,0.99] – 0.97 [0.95,0.98]) but there was no appreciable difference between the four measures in the predictive accuracy for diabetes at five years.
Conclusions
Despite suggestions that abdominal measures of obesity have stronger associations with incident diabetes and better predictive accuracy than BMI, we found no overall advantage in any one measure at discriminating the risk of developing diabetes. Any of these measures would suffice to assist in primary diabetes prevention efforts.
Keywords: Diabetes, Body mass index, Waist circumference
1. Introduction
Diseases that are strongly related to sedentary lifestyles and overconsumption of energy dense foods are among the leading causes of morbidity and mortality, worldwide. Among these are obesity and type-2 diabetes, which have both been steadily increasing in prevalence over the last three decades. In 2014 two in five adults were estimated to be overweight or obese [1], and despite the strong causal relationships between adiposity and adverse health conditions - in particular type 2 diabetes - relative weight status is not routinely measured or monitored in general practice in some countries. For example, in a recent study in Australia only 22% of general practice patients had their body mass index (BMI) recorded and less than 5% had their waist circumference (WC) measured [2]. There are several possible reasons for this, including time constraints during clinical visits, the perceived ‘normality’ of overweight in society and controversies related to the associations of overweight with health outcomes [3–5]. In addition, the ongoing uncertainty as to which measure of body size is most important at gauging an individual's risk [6] - particularly with respect to diabetes - may also contribute to the lack of their monitoring in clinical practice.
Aside from age, excess body weight is the strongest determinant of an individual's risk of developing type 2 diabetes. Evidence from large-scale observational studies has demonstrated the direct association between body size (most notably, BMI) with risk of diabetes [7,8]. These data are supported by randomised trial evidence which has shown that moderate weight loss can reduce both the future risk of developing diabetes and, in some individuals, bring about a reversal of diabetes back to a normoglycaemic state [9,10]. In addition, measures of central obesity (such as WC and waist-hip ratio [WHR]) have been suggested to be even more strongly related to diabetes risk compared with BMI. However, whether one measure of obesity is more strongly associated with incident diabetes than other ones remains unclear and findings from two earlier meta-analyses have reached conflicting conclusions [11,12].
Given the robustness and strength of the relationship between adiposity and incident diabetes, a natural progression has been to determine how well these measures - either alone, or in combination with BMI - predict future risk of diabetes. Indeed there are several diabetes risk prediction tools that have incorporated one or more anthropometric measures into their models [13,14]. However, few prospective studies have had the ability to compare the predictive capability of easy to measure anthropometric measures to predict incident diabetes within a given time-frame. The aims of this study were, thus, twofold: first, to conduct a detailed exploration of the prospective relations between four commonly used anthropometric measures with incident diabetes and to examine their consistency across different population subgroups. The second aim was to compare the ability of each of the measures to predict five-year risk of diabetes using pooled individual-level data from prospective studies that contributed to the Obesity, Diabetes and Cardiovascular Disease Collaboration (ODCDC).
2. Materials and methods
The ODCDC is an international data pooling collaboration established to address outstanding issues of epidemiological and clinical importance regarding simple measures of obesity and risk of incident diabetes in diverse populations. The ODCDC database was developed from a cleaned and coded dataset provided by investigators of the Collaborative Study of Obesity and Diabetes in Adults (CODA) after obtaining permission of data use from investigators of each of the prospective (but not cross-sectional) studies included in CODA. Detailed information of the CODA project including characteristics of included studies has been published elsewhere [15]. Datasets from additional studies were cleaned and coded according to the CODA dataset prior to merging into a master dataset. Characteristics of all included studies are available in Supplementary Table 1.
Participants with self-reported or newly diagnosed diabetes at baseline or who lacked follow-up information on diabetes status were excluded from all analyses. BMI was calculated by dividing weight (kg) by the square of height (m). WC were measured using one of four measurement protocols (above iliac crest; midpoint between rib and iliac crest; narrowest waist; and immediately below the lowest rib; Supplementary Table 1). WHR was calculated by dividing WC (cm) by hip circumference (cm). Similarly, WHtR was calculated by dividing WC (cm) by height (cm). Participants were considered to have incident diabetes if they were free from diabetes at baseline but had fasting plasma glucose ≥7.0 mmol/L, 2 h post load plasma glucose ≥11.1 mmol/L, and/or reported having diabetes and/or use of anti-diabetic medications at follow-up. Duration of follow-up for diabetes was the time between baseline exam and last follow-up on diabetes status. Time to diabetes was calculated as the time between baseline exam and diagnosis of diabetes during a follow-up visit. For participants who self-reported having diabetes at follow-up and provided the age when diabetes was first diagnosed, time to diabetes was calculated as the difference between age at baseline and age at diagnosis of diabetes. Participants who were lost to follow-up or free from diabetes by the end of the study period were censored.
2.1. Statistical analysis
Cox proportional hazards regression models were used to regress time until diagnosis of diabetes against anthropometric measures at baseline. Tests for linear trend between each anthropometric measure and risk of diabetes were conducted by plotting hazard ratios and the respective 95% confidence intervals associated with each fifth of anthropometric measure adjusted for baseline age, sex and study centre. Tests of nonlinearity were conducted by comparing the difference in -2 log likelihood between two models and chi-square approximation. Significance was set at p < 0.05. Continuous associations between each anthropometric measure and diabetes were estimated by calculating the hazard ratios associated with one standard deviation increment. Analyses were stratified by sex and study centre, and adjusted for age, family history of diabetes, and smoking status (never, former, or current smoker). Log cumulative hazard plots were used to check the proportion hazards assumption.
The difference in log hazard ratios between two anthropometric measures was estimated using bias-corrected and accelerated bootstrapping with 2000 iterations for each study in participants with information on all four anthropometric measures. Study-specific log hazard ratios were pooled using random effects meta-analysis to obtain overall sex-specific estimate for each anthropometric measure. I2 statistics were used to quantify heterogeneity. Subgroup analyses by baseline age (<50 years and ≥ 50 years), baseline fasting plasma glucose (<5.6 mmol/L and ≥ 5.6 mmol/L), known diabetes rate (<5%, 5–10%, and >10%), and race/ethnicity (US White, US Black, US Hispanic or Mexican, US Asian or Japanese origin, and Native American) where study data were available.
Harrell's concordance statistics, stratified by study centre and sex, and adjusted for the above mentioned covariates were used to determine the predictive accuracy of each of the four anthropometric measures for risk of diabetes at five years. Participants who did not develop diabetes in the first five years from baseline were censored. Newson's method was used to compute confidence intervals of c-statistics and compare the c-statistics between two anthropometric measures [16]. Random effects meta-analyses were used to obtain pooled c-statistics for each anthropometric measure and their pooled differences between two anthropometric measures.
Analyses were repeated on participants with information on all four anthropometric measures. All statistical analyses were performed using Stata/IC 12.0 for Windows (Stata Corp LP., College Station, TX, USA).
3. Results
3.1. Characteristics of studies
Altogether, 21 studies with 154,998 participants (77% female), 9342 cases of incident diabetes and 1,522,130 person years of follow-up were available for analysis. Three studies each included only men or women; 17 studies collected information on all four anthropometric measures; and nine studies were from USA, three studies from Sweden, two studies each from Australia and Finland, and one study each from Brazil, France, Mauritius, Mexico and Nauru. Mean (standard deviation) duration of follow-up was 8.4 (4.7) years for men and 10.2 (3.2) years for women (Supplementary Table 2). Diabetes at follow-up was more common in men than in women (8.0% versus 5.5%). In addition, men were younger (mean 47.4 versus 54.2 years), more likely to be a current smoker (36.3% versus 18.9%) and with high blood pressure (38.2% versus 29.8%) than women.
3.2. Associations between anthropometric measures and incident diabetes
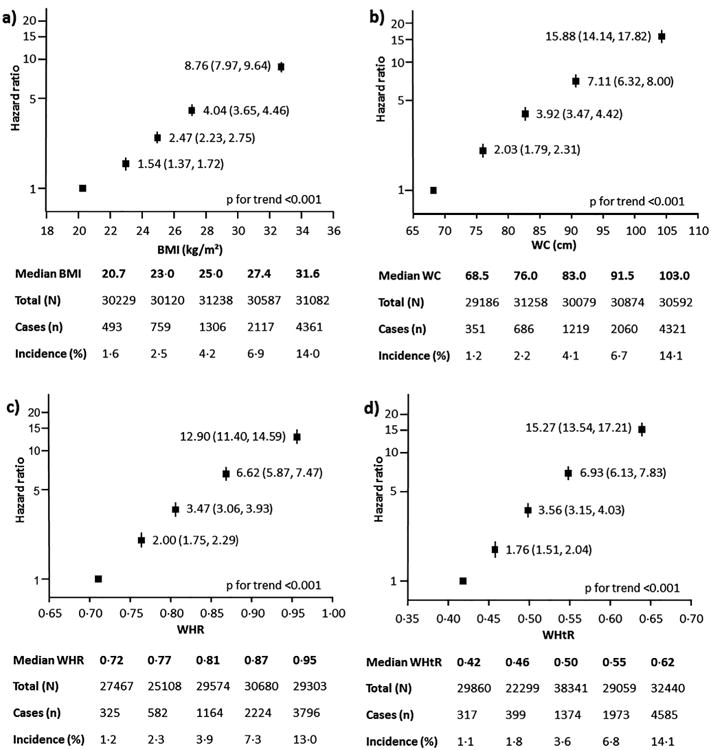
There was a clear and positive association between each of the four measures of body size with incident diabetes across a wide range of values for all measures (p for linear trend < 0.001) but the linear association seemed to plateau at high anthropometric values (p for nonlinearity < 0.04; Fig. 1). Log cumulative hazard plots showed relatively parallel lines among studies, hence, the proportional hazards assumption was not violated (data not shown). The correlation between anthropometric measures were generally high except for BMI and WHR (correlation of 0.3–0.7 in men and 0.2–0.6 in women; Supplementary Table 3).
Fig. 1. Age, sex and study adjusted hazard ratios for incident diabetes by fifths for (a) body mass index (BMI); (b) waist circumference (WC); (c) waist-hip ratio (WHR); (d) waist-height ratio (WHtR).
In men, a one standard deviation increment in each of the four measures of body size was associated with 68–84% higher risk of diabetes in the age-adjusted model (Supplementary Fig. 1a–d). Further adjustment for family history of diabetes and smoking did not materially affect the strength of the age-adjusted associations (Fig. 2a and Fig. 2b). Converting to clinically meaningful changes, each 2 kg/m2 increment in BMI was associated with 31% increment in risk of diabetes (hazard ratio for the multivariable adjusted model: 1.31 [1.24,1.40]). Similarly, each 5 cm increment in WC was associated with 36% higher risk (hazard ratio 1.36 [1.31,1.42]). Considerable heterogeneity between studies was observed for BMI (I2 = 85%) and WHR (I2 = 62%). Differences in hazard ratios between anthropometric measures were compared in participants who had information on all four anthropometric measures. The associations with incident diabetes were significantly stronger for BMI, WC, and WHtR when compared to WHR (Supplementary Table 4). A significantly stronger association was also observed for WHtR in comparison to BMI.
Fig. 2.


2a – Age, sex, family history of diabetes and smoking adjusted hazard ratios for incident diabetes associated with one standard deviation increment in each anthropometric measure by sex*, baseline age†, fasting plasma glucose, and known diabetes rate subgroups. BMI = body mass index; WC = waist circumference; WHR = waist-hip ratio; WHtR = waist-height ratio; CI = confidence intervals. *Not adjusted for sex, †Not adjusted for age.
2b – Age, sex, family history of diabetes and smoking adjusted hazard ratios for incident diabetes associated with one standard deviation increment in each anthropometric measure by race/ethnicity subgroup. BMI = body mass index; WC = waist circumference; WHR = waist-hip ratio; WHtR = waist-height ratio; CI = confidence intervals.
In women, a one standard deviation increment in each of the four measures of body size was associated with 64–80% higher risk of diabetes in the age-adjusted model (Supplementary Figs. 2a–d). Further adjustment for family history of diabetes and smoking slightly attenuated the strength of the age-adjusted associations (Fig. 2a and Fig. 2b). Each 2 kg/m2 increment in BMI was associated with a 22% higher risk of diabetes (1.22 [1.13,1.31]); and each 5 cm increment in WC was associated with a 28% higher risk (1.28 [1.18,1.37]). Moreover, substantial between study heterogeneity was present in all meta-analyses (I2 > 83%). When the associations with incident diabetes were compared between anthropometric measures in participants with information on all four measures, the association was weaker for BMI than for WC (ratio of hazard ratios: 0.97 [0.95,0.98]) and WHtR (0.96 [0.94,0.98]; Supplementary Table 4).
3.3. Subgroup analyses
Due to the high level of heterogeneity between studies for some anthropometric measures and diabetes risk, we conducted a series of subgroup analyses to explore possible sources of the heterogeneity based on age, baseline fasting plasma glucose, background rate of diabetes in the study population and race/ethnicity. There was evidence of an interaction with age; for a standard deviation increment in any of the four measures of body size, the point estimates were greater in individuals aged <50 years compared with those aged ≥50 years but 95% confidence intervals overlapped (Fig. 2a). Of note, the associations between risk of diabetes and WC and WHtR were significantly stronger in those with fasting plasma glucose (<5.6 mmol/L) at baseline compared with higher values (≥5.6 mmol/l). When grouped by the prevalence of known diabetes at baseline in the overall populations, the strength of association tended to be weaker for studies with higher rates of known diabetes (Fig. 2a). Analysis by race/ethnicity suggested greater point estimates in US Whites than other race/ethnicity subgroups (Fig. 2b). When converted to clinically meaningful changes (i.e. 2 kg/m2 for BMI; 5 cm for WC), the difference in strength of association between US Whites and US Asian/Japanese origin became less obvious for WC (1.42 [1.28,1.58] in US Whites and 1.36[1.24,1.50] in US Asian/Japanese origin). The strength of association remained weakest for Native American (1.15 [1.12,1.19]). Similar results were observed when only those participants with all four anthropometric measures were analysed (Supplementary Table 5).
3.4. Predictive accuracy of anthropometric measures for risk of diabetes at five years
The predictive accuracy for five-year risk of diabetes was similar between the four anthropometric measures, with c-statistics, adjusted for age, family history of diabetes and smoking, ranging from 0.72 to 0.74 in men and was 0.74 for all four measures in women (Table 1). The c-statistics remained unchanged following restriction to those participants who had information available for all four anthropo-metric measures (n = 82,099). When compared with BMI, there was no evidence that any other measure of body size had higher predictive accuracy for incident diabetes (the c-statistics differed by only 0.01 unit in each case).
Table 1. Random effects pooled c-statistics for predicting 5 year risk of incident diabetes by sex.
| Anthropometric measure | All participants | Participants with data on all four measures | Difference between BMI and each abdominal measure | |||
|---|---|---|---|---|---|---|
|
|
|
|
||||
| N | c-statistics (95% CI) | N | c-statistics (95% CI) | N | Difference in c-statistics (95% CI) | |
| Men | 14,994 | |||||
| BMI | 20272 | 0.73 (0.69, 0.77) | 0.72 (0.69, 0.76) | – | ||
| WC | 20296 | 0.74 (0.70, 0.77) | 0.74 (0.69, 0.78) | 20236 | 0.01 (0.00, 0.02) | |
| WHR | 15021 | 0.72 (0.67, 0.77) | 0.72 (0.67, 0.77) | 14994 | −0.01 (−0.04, 0.01) | |
| WHtR | 20298 | 0.74 (0.70, 0.78) | 0.74 (0.70, 0.78) | 20239 | 0.01 (0.00, 0.02) | |
| Women | 67,105 | |||||
| BMI | 67925 | 0.74 (0.65, 0.84) | 0.74 (0.65, 0.84) | – | ||
| WC | 68228 | 0.74 (0.64, 0.84) | 0.74 (0.64, 0.85) | 67688 | 0.00 (0.00, 0.00) | |
| WHR | 67544 | 0.74 (0.61, 0.86) | 0.74 (0.61, 0.87) | 67105 | −0.01 (−0.02, 0.01) | |
| WHtR | 68238 | 0.74 (0.65, 0.84) | 0.74 (0.65, 0.84) | 67734 | 0.00 (0.00, 0.01) | |
BMI = body mass index; WC = waist circumference; WHR = waist-hip ratio; WHtR = waist-height ratio; CI = confidence intervals
c-statistics adjusted for age, family history of diabetes and smoking.
4. Discussion
In this large individual participant data meta-analysis that included nearly 155,000 adults without diabetes at baseline and 1,522,130 person years of follow-up, each of four commonly used anthropometric measures had a direct and graded association with incident diabetes across a wide range of values. For a one standardised increment in any of the four measures the risk of developing diabetes was approximately 60–80% higher in men and women. In contrast, the InterAct Consortium, which investigated the association of BMI and WC with incident diabetes, reported stronger association for WC in women [17]. Although there was some evidence that WHtR and WC (but not WHR) were more strongly associated with incident diabetes compared with BMI - a finding consistent with an earlier meta-analysis [12] - this did not translate into higher accuracy of these measures to identify those individuals at greatest risk of incident diabetes at five years compared with BMI.
Despite no differences between the four anthropometric measures in predicting risk of diabetes in the current meta-analysis, some studies have suggested that there may be potential benefit in using information from more than one anthropometric measure rather than any one measure alone. For example, the EPIC Potsdam study compared the risk of type 2 diabetes in participants categorised by BMI-based and WC-based obesity definitions, i.e. normal weight with or without abdominal obesity, overweight with or without abdominal obesity, and obese with or without abdominal obesity [18]. The authors from that study concluded that the additional information conferred by WC was important in assessing the risk of diabetes in those classified as having normal weight (based on BMI).
Worldwide, the prevalence of diabetes is rising and is estimated to increase by 55% from 2015 to 2040 [19]; excess body weight is the single most important modifiable risk factor for incident type 2 diabetes and yet, monitoring of anthropometric measures and provision of weight loss advice where appropriate is not routinely performed in clinical practice, even in many higher-income countries. For example, a primary care study in the UK reported that 90% of overweight patients, 80% of obese patients and 60% of severely obese patients did not receive any weight management intervention [20]. Similarly, a US study reported a decrease in weight loss counselling between 1995/96 and 2003/04 despite continual increase in obesity prevalence [21]. There are a myriad of possible explanations for this which include among other reasons, poor training in weight management counselling, low awareness of the hazards of additional weight gain in those already overweight, and the perceive futility of physical activity and dietary advice on patients' weight [22,23]. Also, weight management is often not considered as a disorder that requires a use of health services. There are few health professionals that have proper skills for weight management, and many health insurance schemes do not consider weight management for reimbursement, except in morbid obesity.
Our findings have direct implications for diabetes prevention in clinical practice by supporting the continued monitoring of a patient's body size and where appropriate providing advice to either lose or maintain weight as a means of minimising future risk of diabetes. The question of how best to measure it - be it BMI, WC or WHR - appears largely irrelevant. But by not doing so, health professionals risk losing an important opportunity at providing an early diabetes prevention intervention such as referral to weight loss counselling or pharmacotherapy - to mitigate future risk of diabetes in their patients. Such interventions have been proven efficient in multiple controlled trials, and are thus evidence based.
The major strength of our study was the use of individual participant data from 21 studies around the world. Unlike a meta-analysis of published studies, we were able to standardise study-specific estimates prior to data pooling. In a traditional systematic review and meta-analysis, the level of adjustments made can differ between studies; hence, combining study-specific estimates that vary in the level of adjustment can distort the pooled estimate. Nevertheless, a limitation of our study was the high between study heterogeneity, meta-regression suggested that baseline age, BMI and fasting plasma glucose only explained the between study differences in some of the analyses (data not shown). Unlike failure times for cardiovascular disease events or death, the time to diabetes used here is approximate as there was no date at diagnosis of diabetes unless it was diagnosed during a follow-up visit. Although 37% of participants did not have information on family history of diabetes, similar results were observed when the age-adjusted analysis was repeated on those participants included in the multivariable adjusted model. In addition, our analysis by race/ethnicity subgroups was based on data from 40% of participants as the dataset obtained from CODA only included information on race/ethnicity in US studies; we included participants from the Mexico study in the US Hispanic subgroup and participants with Japanese origin from the Brazil study in the US Asian subgroup. Since previous studies have suggested that the risk of type 2 diabetes varies by ethnicity [24], we believe it is more appropriate to report results by race/ethnicity derived from 40% of participants rather than by geographical region where study data were collected. Participants were predominantly women, nevertheless, data from 35,000 male participants were used to derive sex-specific estimates. Although four different WC measurement protocols were used in the studies, results remained unchanged for WC and WHtR when WC was standardised according to WC measurement protocol [25].
In summary, the risk of developing diabetes over a five year period associated with greater level of adiposity is substantial irrespective of how these differences are measured. Despite some earlier evidence to suggest that abdominal surface measures of central adiposity have stronger associations with incident diabetes and may have better predictive accuracy than BMI, we found none of the four measures to be superior at predicting risk of diabetes. Health personnel should continue to be encouraged to include routine measurement and monitoring of their patient's adiposity status irrespective of their current body size, as part of a general diabetes preventive approach.
Supplementary Material
Acknowledgments
Funding: This work was supported by the National Health and Medical Research Council of Australia [grant number 1103242].
Study investigators: We would like to thank investigators of the following studies for contributing data to this project: Atherosclerosis Risk in Communities Study (June Stevens); Australian Diabetes, Obesity and Lifestyle Study (Jonathan E Shaw, Dianna Magliano); Coronary Artery Risk Development in Young Adults Study (Pamela Schreiner, David Jacobs); Finland MONICA (Jaakko Tuomilehto, Karri Silventoinen); Prospective Population Study of Women in Gothenburg (Lauren Lissner); Iowa Women's Health Study (Aaron Folsom); Insulin Resistance Atherosclerosis Study (Lynne Wagenknecht); Japanese American Community Diabetes Study (Edward J Boyko, Wilfred Y Fujimoto); Japanese-Brazilian Diabetes Study Group (Sandra Ferreira, Laercio Franco); The 1987 Mauritius Non-communicable Disease Study (Sudhirsen Kowlessur, Jonathan E Shaw, Paul Zimmet); Mexico City Diabetes Study (Clicerio Gonzalez); Normative Aging Study (Patricia Cassano); Nauru Study (Jonathan E Shaw, Paul Zimmet); Northern Sweden MONICA (Mats Eliasson); North West Adelaide Health Study (Anne Taylor, Robert Adams); Nurses' Health Study (Graham Colditz); Oulu 55 Study (Sirkka Keinanen-Kiukaanniemi); Paris Prospective Study I (Marie Aline Charles); Rancho Bernardo Study (Elizabeth Barrett-Connor); Strong Heart Study (Barbara Howard); Uppsala Longitudinal Study of Adult Men (Bjorn Zethelius).
The Atherosclerosis Risk in Communities (ARIC) Study is carried out as a collaborative study supported by National Heart, Lung, and Blood Institute contracts (HHSN26820 1100005C, HHSN268201100006C, HHSN268201100007C, HHS N268201100008C, HHSN268201100009C, HHSN268201100010C, HHSN268201100011C, and HHSN268201100012C). The authors thank the staff and participants of the ARIC study for their important contributions. We wish to thank the AusDiab Steering Committee for providing data from the AusDiab study (Baseline, 2005 and 2012 follow-ups). The Coronary Artery Risk Development in Young Adults Study (CARDIA) is supported by contracts HHSN268201300025C, HHSN268201300026C, HHSN2 68201300027C, HHSN268201300028C, HHSN268201300029C, and HHSN268200900041C from the National Heart, Lung, and Blood Institute and the Intramural Research Program of the National Institute on Aging. The Japanese American Community Diabetes Study was supported by NIH grants DK-031170, HL-049293, DK-002654, DK-017047, DK-035816 and RR-000037. The Mauritius NCD study was supported by the Mauritius Government and by the National Institutes of Health. The Mexico City Diabetes Study has received financial support from the National Heart, Lung & Blood Institute RO1HL 24799; The Consejo Nacional de Ciencia y Tecnologia apoyos: 14502, 2092, M9303, F677-M9407, 2005-CO1, SALUD 2010-2-151165 and 247974 MEXICO. Nurses' Health Study – Channing Division of Network Medicine, Department of Medicine, Brigham and Women's Hospital and Harvard Medical School, Boston MA. The Rancho Bernardo Study was supported by National Institutes of Health/National Institute on Aging grants AG07181 andAG028507 and the National Institute of Diabetes and Digestive and Kidney Diseases grant DK31801. This support does not represent a conflict of interest.
Footnotes
Author contribution: C.M.Y.L. analysed the data, drafted the manuscript, and is the guarantor of this work. R.R.H. conceived the design of the study, and contributed to interpretation of the data and revision of the manuscript. M.W. provided statistical oversight and contributed to interpretation of the data. N.P. conducted preliminary analysis. R.A., E.B-C., E.J.B., M.E., L.J.F., W.Y.F., C. G., B.V.H., D.R.J., S.K-K., D.M., P.S., J.E.S., J.S., A.T., J.T., L.W. provided study data. All authors contributed to the critical revision of the manuscript.
Conflict of interest: MW received personal fees from Amgen, outside the submitted work. RA received grants from National Health and Medical Research Council and the Hospital Research Foundation at The Queen Elizabeth Hospital during the conduct of the study. DM and JES received grants from Commonwealth Department of Health and Aged Care, Abbott Australasia Pty Ltd, Alphapharm Pty Ltd, AstraZeneca, Aventis Pharmaceutical, Bristol-Myers Squibb Pharmaceuticals, Eli Lilly (Aust) Pty Ltd, GlaxoSmithKline, Janssen-Cilag (Aust) Pty Ltd, Merck Lipha s.a., Merck Sharp & Dohme (Aust), Novartis Pharmaceutical (Aust) Pty Ltd, Novo Nordisk Pharmaceutical Pty Ltd, Pharmacia and Upjohn Pty Ltd, Pfizer Pty Ltd, Sanofi. Synthelabo, Servier Laboratories (Aust) Pty Ltd, the Australian Kidney Foundation, and Diabetes Australia during the conduct of the study. PS receive salary to run the CARDIA Study at the University of Minnesota, which includes activities such as publication of results. However, there is a Publications Committee that oversees all manuscripts and abstracts submitted from these data as well as NIH oversight.
Appendix A. Supplementary material: Supplementary data associated with this article can be found, in the online version, at http://dx.doi.org/10.1016/j.diabres.2017.07.022.
References
- 1.World Health Organization. Obesity and overweight fact sheet No. 311. [accessed 06.11.15]; http://www.who.int/mediacentre/factsheets/fs311/en/;
- 2.Turner LR, Harris MF, Mazza D. Obesity management in general practice: does current practice match guideline recommendations? Med J Aust. 2015;202:370–3. doi: 10.5694/mja14.00998. [DOI] [PubMed] [Google Scholar]
- 3.Flegal KM, Kit BK, Orpana H, Graubard BI. Association of all-cause mortality with overweight and obesity using standard body mass index categories. A systematic review and meta-analysis. JAMA. 2013;309:71–82. doi: 10.1001/jama.2012.113905. [DOI] [PMC free article] [PubMed] [Google Scholar]
- 4.Aune E, Sen A, Prasad M, Norat T, Janszky I, Tonstad S, et al. BMI and all cause mortality: systematic review and nonlinear dose-response meta-analysis of 230 cohort studies with 3.74 million deaths among 30.3 million participants. BMJ. 2016;353:i2156. doi: 10.1136/bmj.i2156. [DOI] [PMC free article] [PubMed] [Google Scholar]
- 5.The Global BMI Mortality Collaboration. Body-mass index and all-cause mortality: individual-participant-data meta-analysis of 239 prospective studies in four continents. Lancet. 2016;388:776–86. doi: 10.1016/S0140-6736(16)30175-1. [DOI] [PMC free article] [PubMed] [Google Scholar]
- 6.Lee CM, Huxley RR, Wildman RP, Woodard M. Indices of abdominal obesity are better discriminators of cardiovascular risk factors than BMI: a meta-analysis. J Clin Epidemiol. 2008;61:646–53. doi: 10.1016/j.jclinepi.2007.08.012. [DOI] [PubMed] [Google Scholar]
- 7.Carey VJ, Walters EE, Colditz GA, Solomon CG, Willett WC, Rosner BA, et al. Body fat distribution and risk of non-insulin-dependent diabetes mellitus in women. The Nurses' Health Study. Am J Epidemiol. 1997;145:614–9. doi: 10.1093/oxfordjournals.aje.a009158. [DOI] [PubMed] [Google Scholar]
- 8.Lipton RB, Liao Y, Cao G, Cooper RS, McGee D. Determinants of incident non-insulin-dependent diabetes mellitus among blacks and whites in a national sample. The NHANES I epidemiologic follow-up study. Am J Epidemiol. 1993;138:826–39. doi: 10.1093/oxfordjournals.aje.a116786. [DOI] [PubMed] [Google Scholar]
- 9.Tuomilehto J, Lindstrom J, Eriksson J, Valle TT, Hamalainen H, Ilanne-Parikka P, et al. Prevention of type 2 diabetes mellitus by changes in lifestyle among subjects with impaired glucose tolerance. N Engl J Med. 2001;344:1343–50. doi: 10.1056/NEJM200105033441801. [DOI] [PubMed] [Google Scholar]
- 10.Gregg EW, Chen H, Wagenknecht LE, Clark JM, Delahanty LM, Bantle J, et al. Association of an intensive lifestyle intervention with remission of type 2 diabetes. JAMA. 2012;308:2489–96. doi: 10.1001/jama.2012.67929. [DOI] [PMC free article] [PubMed] [Google Scholar]
- 11.Vazquez G, Duval S, Jacobs DR, Jr, Silventoinen K. Comparison of body mass index, waist circumference, and waist/hip ratio in predicting incident diabetes: a meta-analysis. Epidemiol Rev. 2007;29:115–28. doi: 10.1093/epirev/mxm008. [DOI] [PubMed] [Google Scholar]
- 12.Kodama S, Horikawa C, Fujihara K, Heianza Y, Hirasawa R, Yachi Y, et al. Comparisons of the strength of associations with future type 2 diabetes risk among anthropometric obesity indicators, including waist-to-height ratio: a meta-analysis. Am J Epidemiol. 2012;176:959–69. doi: 10.1093/aje/kws172. [DOI] [PubMed] [Google Scholar]
- 13.Lindstrom J, Tuomilehto J. The diabetes risk score. A practical tool to predict type 2 diabetes risk. Diabetes Care. 2003;26:725–31. doi: 10.2337/diacare.26.3.725. [DOI] [PubMed] [Google Scholar]
- 14.Chen L, Magliano DJ, Balkau B, Colagiuri S, Zimmet PZ, Tonkin AM, et al. AUSDRISK: an Australian type 2 diabetes risk assessment tool based on demographic, lifestyle and simple anthropometric measures. Med J Aust. 2010;192:197–202. doi: 10.5694/j.1326-5377.2010.tb03507.x. [DOI] [PubMed] [Google Scholar]
- 15.Duval S, Vazquez G, Baker WL, Jacobs Jr DRCODA Study Group. The Collaborative Study of Obesity and Diabetes in Adults (CODA) project: meta-analysis design and description of participating studies. Obes Rev. 2007;8:263–76. doi: 10.1111/j.1467-789X.2006.00263.x. [DOI] [PubMed] [Google Scholar]
- 16.Woodward M. Epidemiology study design and data analysis. 3rd. Boca Raton: CRC Press; 2014. pp. 631–2. [Google Scholar]
- 17.The InterAct Consortium. Long-term risk of incident type 2 diabetes and measures of overall and regional obesity: the EPIC-InterAct Case-Cohort Study. PLoS Med. 2012;9:e1001230. doi: 10.1371/journal.pmed.1001230. [DOI] [PMC free article] [PubMed] [Google Scholar]
- 18.Feller S, Boeing H, Pischon T. Body mass index, waist circumference, and the risk of type 2 diabetes mellitus. Implications for routine clinical practice. Dtsch Arztebl Int. 2010;107:470–6. doi: 10.3238/arztebl.2010.0470. [DOI] [PMC free article] [PubMed] [Google Scholar]
- 19.International Diabetes Federation. IDF Diabetes Atlas seventh edition 2015. Brussels: IDF; 2015. [Google Scholar]
- 20.Booth HP, Prevost AT, Gulliford Access to weight reduction interventions for overweight and obese patients in UK primary care: population-based cohort study. BMJ Open. 2015;5:e006642. doi: 10.1136/bmjopen-2014-006642. [DOI] [PMC free article] [PubMed] [Google Scholar]
- 21.McAlpine DD, Wilson AR. Trends in obesity-related counselling in primary care: 1995–2004. Med Care. 2007;45:322–9. doi: 10.1097/01.mlr.0000254575.19543.01. [DOI] [PubMed] [Google Scholar]
- 22.Yates EA, Macpherson AK, Kuk JL. Secular trends in the diagnosis and treatment of obesity among US adults in the primary care setting. Obesity. 2012;20:1909–14. doi: 10.1038/oby.2011.271. [DOI] [PubMed] [Google Scholar]
- 23.Ossolinski G, Jiwa M, McManus A. Weight management practices and evidence for weight loss through primary care: a brief review. Curr Med Res Opin. 2015;31:2011–20. doi: 10.1185/03007995.2015.1082993. [DOI] [PubMed] [Google Scholar]
- 24.Shai I, Jiang R, Manson JE, Stampfer MJ, Willett WC, Colditz GA, et al. Ethnicity, obesity, and risk of type 2 diabetes in women. A 20-year follow-up study. Diabetes Care. 2006;29:1585–90. doi: 10.2337/dc06-0057. [DOI] [PubMed] [Google Scholar]
- 25.Wang J, Thornton JC, Bari S, Williamson B, Gallagher D, Heymsfield SB, et al. Comparisons of waist circumferences measured at 4 sites. Am J Clin Nutr. 2003;77:379–84. doi: 10.1093/ajcn/77.2.379. [DOI] [PubMed] [Google Scholar]
Associated Data
This section collects any data citations, data availability statements, or supplementary materials included in this article.