Abstract
In recent decades, various kinds of remote sensing-based drought indexes have been proposed and widely used in the field of drought monitoring. However, the drought-related software and platform development lag behind the theoretical research. The current drought monitoring systems focus mainly on information management and publishing, and cannot implement professional drought monitoring or parameter inversion modelling, especially the models based on multi-dimensional feature space. In view of the above problems, this paper aims at fixing this gap with a component-based system named RSDMS to facilitate the application of drought monitoring by remote sensing. The system is designed and developed based on Component Object Model (COM) to ensure the flexibility and extendibility of modules. RSDMS realizes general image-related functions such as data management, image display, spatial reference management, image processing and analysis, and further provides drought monitoring and evaluation functions based on internal and external models. Finally, China’s Ningxia region is selected as the study area to validate the performance of RSDMS. The experimental results show that RSDMS provide an efficient and scalable support to agricultural drought monitoring.
1. Introduction
Drought is one of the most common natural disasters, and often causes significant environmental, agricultural, healthy, economic and social consequences, especially in developing economies [1–3]. As for scientists and researchers, detecting the occurrence and severity of the drought disaster by observing the spatio-temporal changes of nature is an important challenge [4,5]. In this field, meteorologists, hydrologists, geophysicists proposed many methods and models from different perspectives. Su et al. [6] summarized them into three categories: meteorological indexes (e.g., the Standardized Precipitation Index), process-based indexes (e.g., evaporative fraction) and satellite-based indexes (e.g., vegetation indexes). All of the above indexes are composed of geophysical parameters, e.g. land surface temperature, soil moisture, vegetation water content, surface albedo, etc. Therefore, the measurement of geophysical parameters largely determine the precision and accuracy of monitoring.
Traditional measurements of geophysical parameters are point-based, which mainly rely on fixed or mobile stations [7–11]. The interpolation methods and the representativeness of the observation points have been discussed a lot to extend the point-based observations to continuous data [12]. The rapid development of remote sensing technology in recent decades provides an effective solution to this problem [13–19], and the satellite-based drought indexes have attracted scholars’ attentions. Many effective models were proposed based on different ranges of electromagnetic spectrum to accommodate various kinds of underlying surface conditions. For instance, the thermal inertia model and the active microwave remote sensing model [20] were designed to monitor the drought over bare soils. For vegetated surfaces, the Crop Water Stress Index [21,22], the Temperature Vegetation Dryness Index [23], the Perpendicular Drought Index [24], the Shortwave Infrared Perpendicular Water Stress Index [25,26] have been widely used to monitor the drought status of the soil with different vegetation coverage. The continuous modification of the existing drought indexes and the continuous advent of new indexes are the inevitable trend of drought monitoring using remote sensing technology. Therefore, the drought monitoring systems which implement those indexes are becoming increasingly important.
The software platform is fundamental to drought monitoring services. The government agencies or organizations in many countries established drought monitoring platforms in succession, including US Drought Monitor (http://droughtmonitor.unl.edu), European Drought Observatory (edo.jrc.ec.europa.eu), Meteorological Drought Monitoring System of China (http://cmdp.ncc-cma.net/influ/dust.php), and African Flood and Drought Monitor (http://stream.princeton.edu/AWCM/WEBPAGE/interface.php) [27–32]. A few scholars and research teams also developed drought monitoring and publishing systems. Deng et al. [33] built an on-demand web service system named Global Agriculture Drought Monitoring and Forecasting System (GADMFS), which significantly improves global agriculture drought monitoring, prediction and analysis. Hao et al. [34]developed the Global Integrated Drought Monitoring and Prediction System (GIDMaPS), which provides meteorological and agricultural drought information based on multiple satellite-based and model-based precipitation and soil moisture datasets. Sheffield et al. [35]developed a drought monitoring and seasonal hydrological forecast system for sub-Saharan Africa contributes to building capacity through technology and knowledge transfer.
Although great progress has been made in drought monitoring technology, there are still work to do on the development of software and platforms. On one hand, the current drought-related platforms are often designed for a single purpose and focus mainly on information management and publishing, which cannot satisfy the advanced needs in research and professional work; On the other hand, the existing powerful remote sensing image processing software such as ENVI provide no specific module for drought monitoring, which makes a variety of complex and diverse inversion models cannot be well applied, especially the models based on multi-dimensional feature space. Furthermore, the architecture of most existing software does not allow users to incorporate new or customized models. The above limitations hinders the use of remote sensing technology in drought monitoring. Therefore, in the community of remote sensing, there is a growing need for a professional drought monitoring system with high flexibility and extendibility.
The objective of this paper is to design and develop RSDMS, a component-based remote sensing drought monitoring system. In RSDMS, the data management, image process, feature space analysis, drought monitoring and drought assessment are developed as independent and reusable components. All necessary procedures of drought monitoring can be performed conveniently, including radiometric calibration and atmospheric correction of remote sensing images, feature line extraction, parameter inversion etc., and new inversion models can be added into the system flexibly.
This paper introduces the overall system architecture, internal data structure and the module interface design (Section 2) followed by a detailed description of the development of all features (Section 3). The paper demonstrates the application of RSDMS in drought monitoring and assessment of China’s Ningxia region (Section 4) and discusses the characteristics of RSDMS and looks in to the future (Section 5).
2. Design and architecture
This section will introduce the overall architecture, internal data structure and interface design of RSDMS. RSDMS is designed and developed based on Component Object Model (COM) to ensure the flexibility and extendibility of common function modules and drought monitoring models. The component technology develops on the basis of the object-oriented technology to archive the software reuse.
2.1 Component Object Model
Component Object Model (COM) is a binary interface standard of software component designed by Microsoft Corporation in 1993. It is used to enable inter-process communication and dynamic object creation in a large range of programming languages. The essence of COM is a language-neutral way to implementing objects that can be used in environments different from the one in which they were created, even across machine boundaries. For well-authored components, COM allows reuse of objects with no knowledge of their internal implementation, as it forces component implementers to provide well-defined interfaces that are separated from the implementation.
The advantages of using COM are directly derived from the insertion or removal of the application, and the applications can evolve over time. In addition, there are some advantages of using COM to make the application more convenient and flexible, such as application customization, component library, and distributed components.
2.2 System workflow
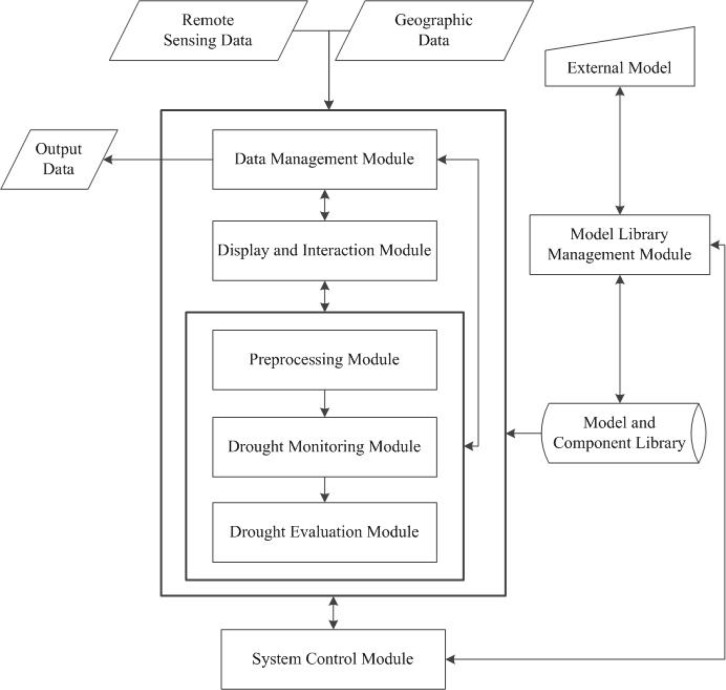
According to the conclusions of system demand analysis, this paper designs the function modules of the system as a whole, the system can be divided into data management module, display and interaction module, preprocessing module, drought monitoring module, drought evaluation module, system control module and model library management module. The system workflow of this paper as shown in Fig 1.
Fig 1. System workflow.
2.3 System architecture
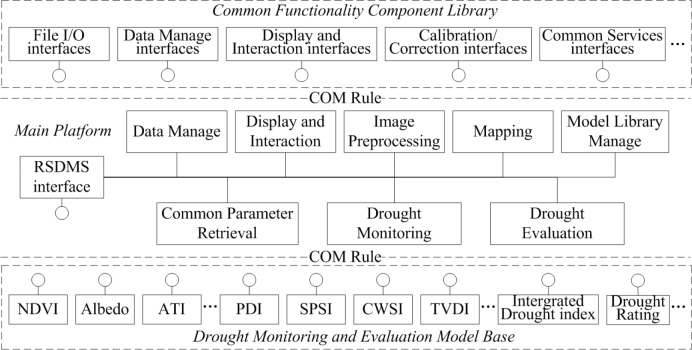
We design the architecture of RSDMS as shown in Fig 2, which is composed of three main parts: main platform, common functionality component library, and drought monitoring and evaluation model base.
Fig 2. Architecture of RSDMS [36].
2.3.1 Main platform
Instructed by the design concept of COM, RSDMS is designed to be highly reusable and scalable. The main platform provides a friendly graphic user interface (GUI) as a container of function modules, and most functions are implemented by calling the corresponding component objects according to COM rules (The rectangle attached by a circle in Fig 1 represents an independent component). Besides, part of functions are encapsulated with the main platform to archive the reusability on the software-level, and they can be externally invoked in the form of a standard interface, namely “RSDMS interface”. On the basis of this interface, users can extend the functions by incorporating other functional modules, e.g. new data format input/output (I/O) drivers and new model components.
2.3.2 Common functionality component library
The common functionality component library is the supporting infrastructure of RSDMS as a remote sensing platform. In this component library, the general image processing and display functions are grouped according to their correlations, and similar functions are encapsulated and developed as a component such as File I/O, data management (e.g. data subset, format conversions), display and user interaction, image preprocessing, and common service components as well (e.g. the progress reporting component). These modules can be flexibly assembled within RSDMS, and also be transportable across software.
2.3.3 Drought monitoring and evaluation model base
This model base is the core part of RSDMS and supports the drought monitoring and evaluation service. It is composed of a range of geophysical parameter inversion models and drought-related index models. Each index model is encapsulated as an independent component abiding by a common interface regulation. As the main platform needs, the corresponding index model is called, then receives data from the main platform, and finally returns results back after model computation. In addition, a model management component is developed to operate the registration and management of external models.
2.4 Internal data structure
Vector and raster data are two major data formats in RSDMS; therefore, the internal data structures are designed for handling these two formats.
2.4.1 Vector data
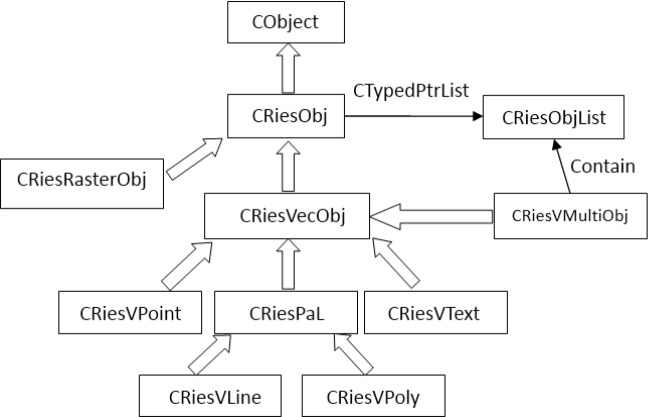
For vector data, we design vector objects based on traditional vector models (point, line, polygon and text annotation) as shown in Fig 3. Fig 3 shows the class inheritance relation of vector features. The basic class for geographic entities CRiesObj is defined based on a MFC class CObject, and the vector base class CRiesVecObj and the raster base class CRiesRasterObj inherits from CRiesObj. Furthermore, the point feature class CRiesVPoint, the line feature class CRiesVLine, the polygon feature class CRiesVPoly and the text feature class CRiesVText are defined based on CRiesVecObj. Apart from simple features, the multi-feature class CRiesVMultiObj is defined using the data type CTypedPtrList to handle possible multi-feature objects. The layer class CRiesLayer is defined as a container of vector features. The management of vector features is operated through corresponding feature classes, while their display control is implemented through the layer class.
Fig 3. Vecotr data structure.
2.4.2 Raster data
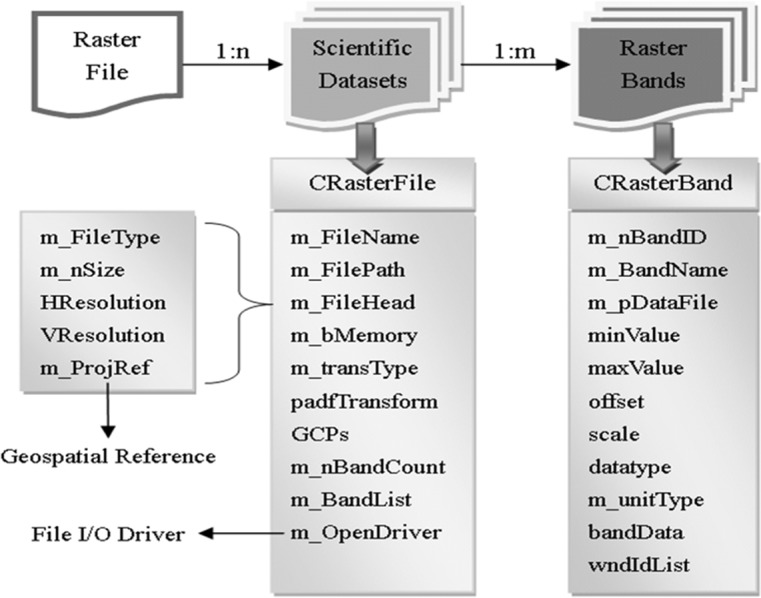
By analyzing the Geospatial Data Abstraction Library (GDAL) data model and other commonly used remote sensing data formats (ENVI, HDR, LD2 etc.), a simplified model for raster format is designed as shown in Fig 4. A raster file may contain multiple raster bands, especially the band number of hyperspectral images can reach to hundreds. Therefore, CRasterBand is defined to represent the raster bands, and the raster bands with the same properties (size, spatial resolution and spatial reference) are treated together as a Scientific Dataset (SD). In RSDMS, CRasterFile is used to store the SD, and the common properties are recorded in a structure—m_Filehead. Within the above class structures, a few member variables are defined to record the information about file, band etc. The raster data can be managed and operated flexibly on both band-level and file-level through the defined data structure.
Fig 4. Raster data structure.
2.5 Interface design
Fig 2 shows that the interaction between the main platform and function components is performed by interface access. In RSDMS, all function components except the display and interaction interface abide by common interface rules. The drought-related model components abide by the interface rule in Section 2.5.2, while the other components abide by the rule in Section 2.5.1.
2.5.1 Interface design of main platform
Part of common functions are encapsulated with RSDMS, and they can be externally invoked as the interface “RSDMS Interface”. The modules inside or outside RSDMS can implement data I/O, output result etc. by invoking this interface. The detailed specification of this interface is shown in Table 1.
Table 1. Interface specification of the main platform.
| Method name | Function | Return value | Remark |
|---|---|---|---|
| GetAppDirectory | Get the directory of the application | BSTR | None |
| GetBand | Get the pointer of the specified band | VOID | Para: VARIANT * outVar output the band pointer |
| GetBandData | Get the band data through a band pointer | VOID | Para: VARIANT * bandVar output the band data |
| GetLineParmManual | Get the parameters of the feature line obtained in a manual way | VOID | Return the slope and intercept of the feature line generated from the manual interaction with the 2D spectral feature space window |
| GetDataBlock | Get the specified data block of the specified band | VOID | Para: bandVar stores the pointer of the band to read, yStart and yEnd indicate the starting and ending row number of the data block respectively |
| WriteDataBlock | Write the specified data block of a specified band | VOID | Para: bandVar stores the pointer of the band to write, yStart and yEnd indicate the starting and ending row number of the data block respectively |
| CreateResultFile | Create a file for storing results | VOID | Create a file according to the specifications in the band or file templates VARIANT *tempBand and VARIANT *tempFile |
| BandsCompatibleTest | Test the compatibility of the band data | BOOL | Return the compatibility result |
| GetFileManual | Get one of files opened in the main platform | VOID | Para: VARIANT * outVar |
2.5.2 Interface design of model components
Compared with the complicated interface specification of the main platform, the interfaces of model components are relatively simplified. All model components can be performed by the four interface methods as shown in Table 2, which facilitates the unified management of all models in RSDMS.
Table 2. Interface specification of model components.
| Method name | Function | Return value | Remark |
|---|---|---|---|
| Connect | Connect to the main platform, and receive the external interface pointer of the main platform | HRESULT | lpUnknown: the external interface pointer of the main platform |
| DisConnect | Disconnect with the main platform | HRESULT | Release the external interface pointer of the main platform |
| ProcessWithoutParm | Run model without input parameters | HRESULT | None |
| ProcessWithParm | Run model with input parameters | HRESULT | Parameters vary with models |
The parameters, return value and function of the interface methods Connect, Disconnect and ProcessWithoutParm are fixed, while those for ProcessWithParm are customized according to the feature of models. The existence of ProcessWithParm can let the main platform or the other components perform a model component with some input parameters other than users’ interaction, and this mechanism is useful for the extension of model base.
3. Developments
3.1 Implementation
Considering that remote sensing image process and computation are involved in RSDMS, we choose C++ as the developing language since it is efficient and flexible for image processing. The Active Template Library and ActiveX are used to develop the components with and without graphic user interface respectively. Although most features are developed by the authors from scratch, some commonly used features are implemented based on open source libraries. The read and write of common raster data formats are realized by the Geospatial Data Abstraction Library (GDAL/OGR, http://www.gdal.org) under the open source license of Open Source Geospatial Foundation. The cartographic projection conversion are realized by the PROJ.4 library (https://github.com/OSGeo/proj.4/issues). Part of general image processing functions (e.g. histogram enhancement, spatial filtering) are implemented based on Intel’s OpenCV library (http://opencv.org). The matrix operations are implemented with the help of the CxImage library (http://www.codeproject.com/Articles/1300/CxImage).
3.2 System interface and features
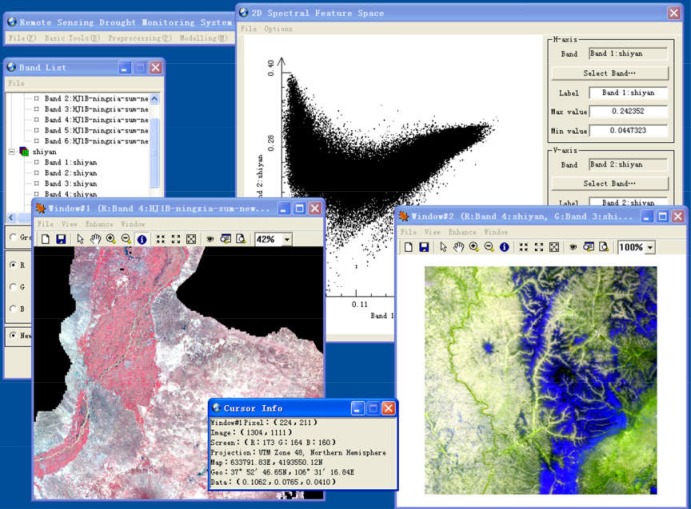
The main interface of RSDMS is shown in Fig 5. RSDMS provides two types of functions: as a general remote sensing platform, it provides a series of functions such as general image processing, analysis, display and data management; as a professional drought monitoring platform, it provides drought monitoring and evaluation function based on a bunch of inversion models.
Fig 5. Main interface of RSDMS.
3.2.1 Data management
The support file formats of RSDMS are vector data, raster data and auxiliary data including ASCII and Binary format. The auxiliary data are mainly used to represent parameters of monitoring and evaluation models, and details can be referred to Section 3.2.4. The commonly used Shapefile format is selected to be the major vector format since it is suitable for data interexchange with other software. By contrast, the support raster data formats are more comprehensive because various kinds of satellite data or products are involved. Three kinds of raster data are supported in RSDMS: (1) the platform-specific formats of commercial remote sensing software, such as ENVI format, ERDAS IMAGINE format and so on; (2) satellite products such as the Moderate Resolution Imaging Spectroradiometer (MODIS) products in HDF format; (3) the specific data format used by government agencies, e.g. the Local File (LD2) format used by China’s meteorological departments.
Users often need to subset original images in the process of drought monitoring services, so RSDMS provides regular subset and subset via vector files. The former one is to subset images based on the input sample/line range or the top-left /bottom-right coordinates of images, while the latter one is based on the geographic extent of vector features. The Well-Known Text (WKT) defined by the Open Geospatial Consortium is used to represent geospatial projections involved in RSDMS. The projection file of Shapefile is directly read since it also adopts WKT to represent projection information, while for other file types such as ENVI format, HDF file and LD2, RSDMS extracts the projection and datum information according to the corresponding description file and transforms them into the WKT format.
3.2.2 Display and information query
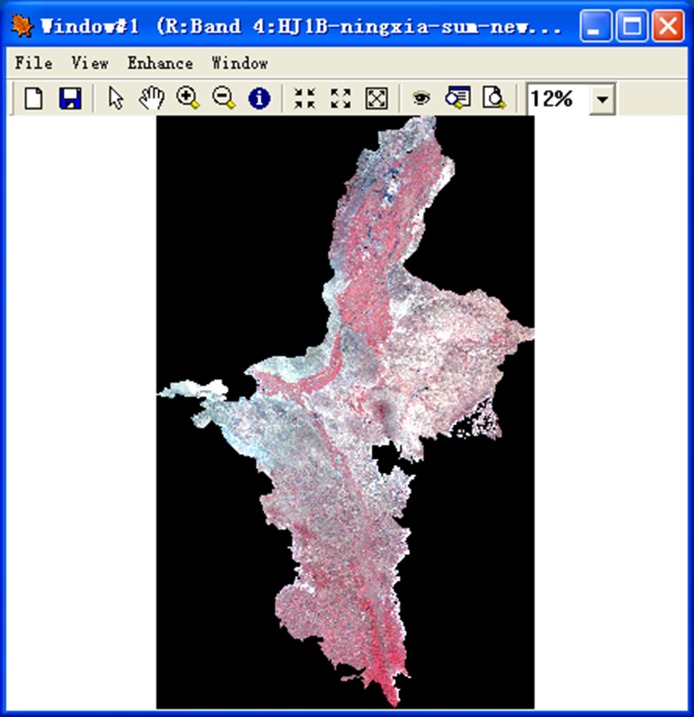
The system handles image data display through image bands, and provides single band display and multi-band composition display (Fig 6). Twenty-eight color palettes are available for users to display a single band. Besides raster data, RSDMS can also show vector data and overlay display vector and raster data. It provides basic display functions e.g. zoom in/out, thumbnail image, and advanced functions such as brightness/contrast adjustment, filter enhancement. In addition, users can query the attribute information of vector data and the pixel information of raster data through a cursor locate tool.
Fig 6. Image display and query.
3.2.3 Preprocessing of remote sensing images
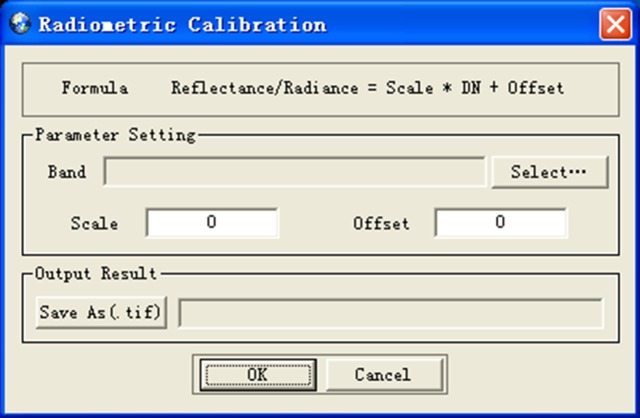
RSDMS realizes the radiometric calibration using the equation introduced in [37]: Reflectance/Radiance = Scale * DN + Offset, where Scale and Offset are magnification times and correction coefficient for zero point, and DN is the digital number recorded by the image sensor. Fig 7 shows the radiometric calibration dialog.
Fig 7. Radiometric calibration dialog.
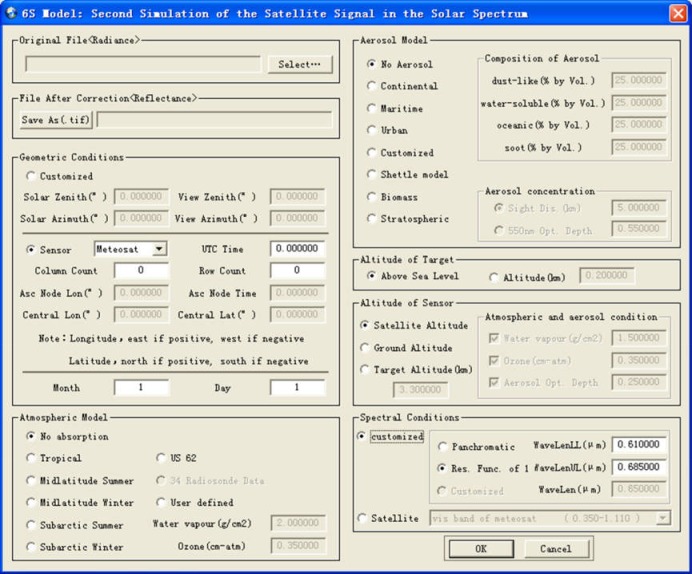
In RSDMS, the atmospheric correction of remote sensing images are performed based on the Second Simulation of the Satellite Signal in the Solar Spectrum Model (6S Model) [38,39]. In the 6S model, the altitude of target, the non-uniform characteristics of surface and the absorption effect of gas on radiation are taken into account, and the Successive Order of Scattering algorithm is used to calculate the molecular and aerosol scattering, which enhances the accuracy of atmospheric correction. Fig 8 shows the atmospheric correction dialog.
Fig 8. Atmospheric correction dialog.
Considering radiometric calibration and atmospheric correction are often performed in the drought monitoring service on a large number of image pixels corresponding to the observation stations, we develop a function to batch process radiometric calibration (Fig 9A) and atmospheric correction (Fig 9B). In this function, a large number of images are batch processed based on the parameters in a prepared configuration file, which avoids repetitive manual operations.
Fig 9. Image batch processing.
(a) Batch radiometric calibration, (b) Atmospheric correction.
3.2.4 Drought monitoring and evaluation
The model base of RSDMS contains two types of models: internal models and external models. The former are the models implemented when the system is being developed, while the latter are the models imported to the system afterwards. The internal models can be further grouped into two categories from a functional point of view: inversion model of surface parameters, such as Normalized Difference Vegetation Index (NDVI), Albedo, Apparent Thermal Inertia (ATI) etc.; drought monitoring model, such as VCI, PDI, TVDI, etc. Table 3 shows the calculation formula and references of all internal models.
Table 3. Internal models of RSDMS.
| Category | Index name | Formula | Reference |
|---|---|---|---|
| Inversion models of surface parameters | NDVI [40] | NDVI = (ρNIR − ρRed)/(ρNIR + ρRed) | Deering, 1978 |
| ATI [41] | ATI = (1 − Albedo)/(Tmax − Tmin) | Tian and Yang, 1992 | |
| NDWI [42] | NDWI = (ρGreen − ρNIR)/(ρGreen + ρNIR) | McFeeters, 1996 | |
| MNDWI [43] | MNDWI = (ρGreen – ρMIR)/(ρGreen + ρMIR) | Xu, 2006 | |
| Drought monitoring models | VSWI [44] | VSWI = 100 × NDVI/Ts | Carlson et al., 1994 |
| VCI [45] | Kogan, 1995 | ||
| TVDI [23] | TVDI = (Ts − Ts,min)/(Ts,max − Ts,min) | Sandholt et al., 2002 | |
| SIWSI [46] | Fensholt et al., 2003 | ||
| PDI [24] | Zhan et al., 2007 | ||
| MPDI [47] | Ghulam et al., 2007a | ||
| VCADI [47] | Ghulam et al., 2007a | ||
| SPSI [25] | Ghulam et al., 2007b | ||
| NPDI [48] | Feng et al., 2011 |
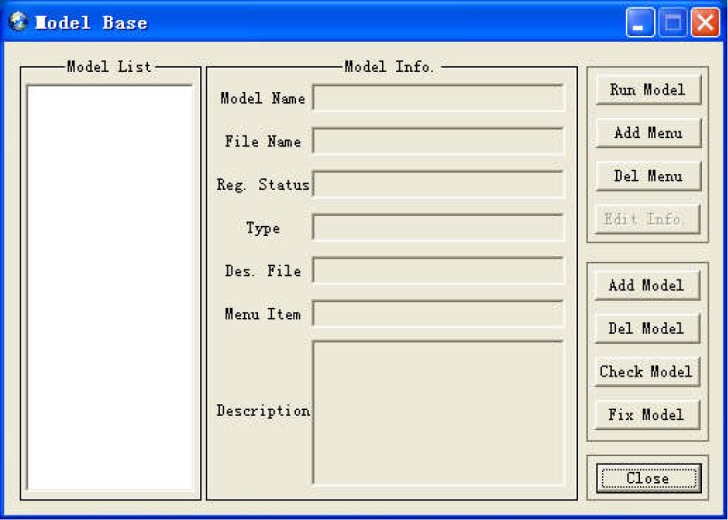
In addition to internal models, users can also use the model management function to add new models into the system according to the specified format. In order to represent the internal and external models in a unified way, we design the composition structure of a model: a model file (in the form of Dynamic Linking Library, DLL) and a description file (in the form of a binary file). Both types of models are managed by the Model Base Management Component and the registry editor in the operation system. The first thing to add a new model is to check-in through the registry editor, that is, to write the basic information (such as CLSID, IID, File Name, etc.) of the new model into the registry (Fig 10). Then the DLL file of the model is registered in RSDMS through the Model Base Management Component. The Model Base Management Component has a friendly user interface (Fig 11) with functions: add/remove, registration/unregistration, run model, description edit etc. Users can easily link an external model to RSDMS by this component.
Fig 10. Model information of RSDMS in the registry.
Fig 11. Model management dialog.
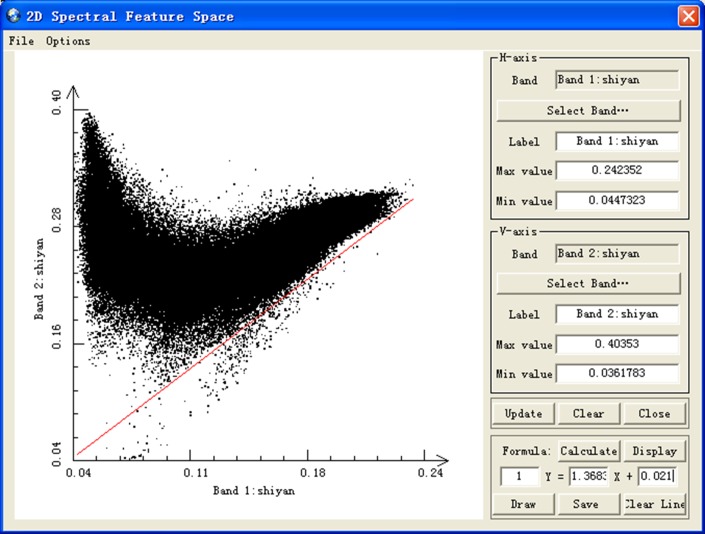
An important procedure of drought monitoring service is to analyze the two-dimensional spectral feature space. RSDMS provides the function of generating a scatter plot (Fig 12) which demonstrates the distribution characteristics of pixel values of any two image bands in two-dimensional feature space. Furthermore, a feature line can be obtained based on the scatter plot in both manual and automatic way. The manual way is to let users draw a feature line by the mouse operations, while the automatic way is an extension of the automated soil line identification routine proposed by Fox et al. [49]. The feature line (the red line in Fig 12) can be used as the soil line in some inversion models.
Fig 12. Two-dimensional spectral feature space dialog.
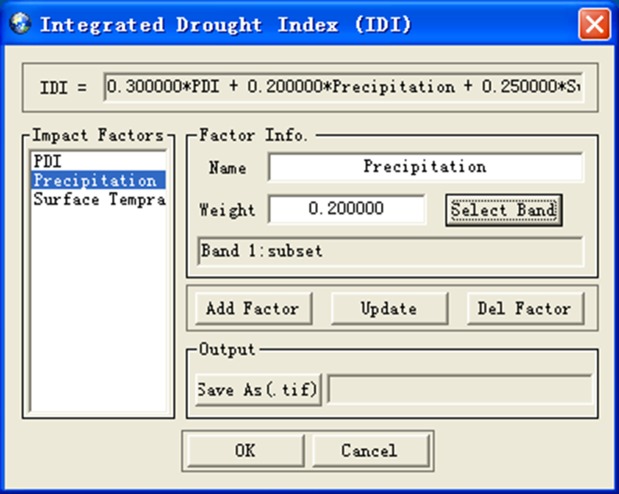
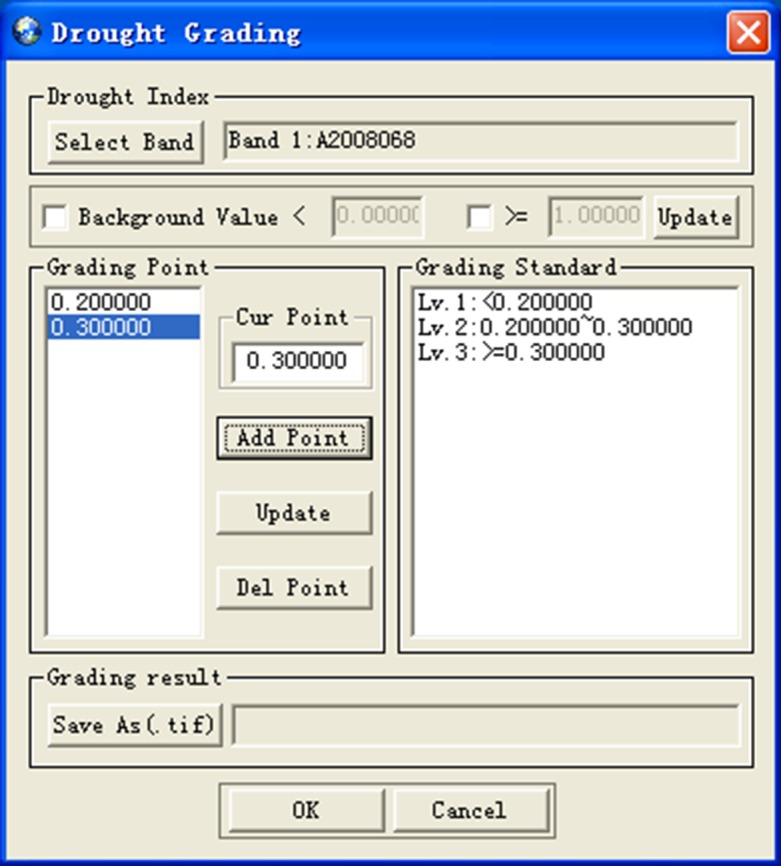
Aiming at evaluating the degree of drought, we develop the Integrated Drought Index (IDI) (Fig 13) which is the weighted average of drought indexes from drought monitoring models and other impact factors. The IDI takes into account the influence of various factors on regional drought and can overall reflect the degree of regional drought. Drought rating is (Fig 14) to design a drought rating standard based on IDI and remote sensing images, and display the drought region according to the grade of drought.
Fig 13. Integrated drought index dialog.
Fig 14. Drought rating dialog.
3.2.5 Output result and mapping
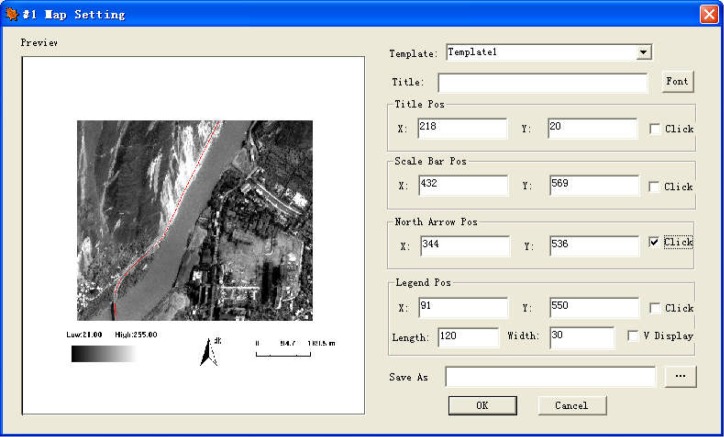
RSDMS can output the surface parameter inversion result, drought monitoring result, drought rating result in typical raster data formats. RSDMS can also provide many map layouts (Fig 15) with elements such as text annotation, scale bar, legend, north arrow, and create thematic maps by combing map elements with drought monitoring and evaluation results.
Fig 15. Export map dialog.
4. Application
To verify the practicality of RSDMS, the system is applied to drought monitoring and assessment of China’s Ningxia region.
4.1. Study area and data
Ningxia Huizu Autonomous Region is located in the northwestern China, upstream of Yellow River with the geographic extent of 104°10′ E to 107°30′ E and 35°25′ N to 39°25′ N (Fig 16). The total area of Ningxia region is 51 800 km2 comprising typically arid and semi-arid eco-systems. Drought is a frequent disaster in this area and has serious negative effect on the local economic development. Due to the fragile eco-system, the crops in this area are often exposed to water shortage during growing seasons.
Fig 16. Export map dialog[36].
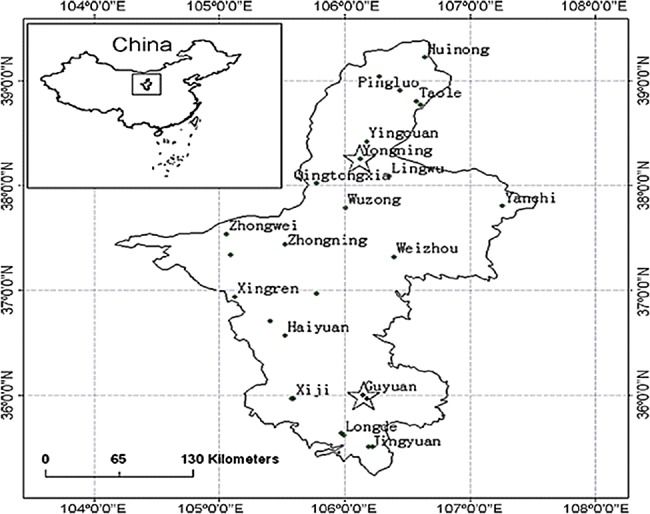
To ensure the representativeness, two typical agro-climatic sites Yongning (106°15′ E, 38°15′ N) and Guyuan (106°18′ E, 35°58′ N) were selected as the observation stations of ground data (marked as 16 pentagons in Fig 16). Yongning, a water-controlled site, is located in the Yellow River irrigation zone where crops have been fully irrigated. Guyuan is located in the southern mountainous region of Ningxia where agriculture heavily depends on rainfall. Twenty-four MOD09 products of the study area in 2009 were selected as the study data. Synchronized with the image acquisition time, we surveyed the surface parameter data of six land parcel (1km×1km) at the two observation stations. The six parcels include: two fields of interplanted wheat and corn in Yongning, two fields of winter wheat and two fields of corn in Guyuan.
The soil moistures (Volumetric Water Content, VWC) in 0–10cm soil layer in three types of farmland were measured during April to July, and they constitute a complete ground observation dataset. The soil moistures were measured using Instrument for Measuring Temperature & Moisture of Soil with±3% accuracy and 0.1% resolution made by Hash Company in the United Stated of America.
4.2 Drought monitoring
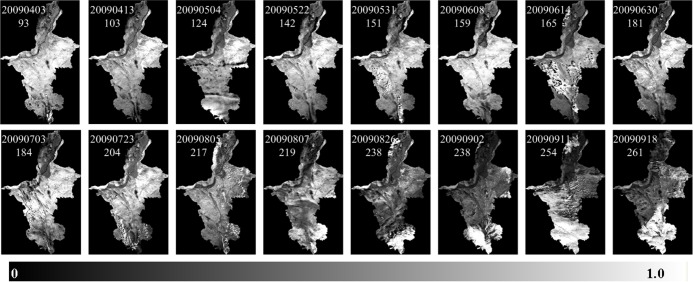
We chose PDI, MPDI, SPSI and SIWSI to monitor Ningxia drought conditions. These four vegetation indices are good methods to monitor soil water content [50,51]. We imported MOD09 images into RSDMS and conducted all preprocessing procedures including image subset, radiometric calibration, atmospheric correction and projection transformation. Then the first band (620–670nm), second band (841–876 nm) and the seventh band (2105–2155 nm) of images were chosen to construct the RED-NIR and NIR-SWIR feature spaces for the four vegetation Indices, and further the RED-NIR and NIR-SWIR base lines were acquired using the automatic feature line extraction function of RSDMS. The results of spatial distribution of drought over Ningxia plain with four vegetation indices were similar. Taking SPSI index as an example, Fig 17 shows the spatial distribution of drought over Ningxia plain on different dates in 2009.
Fig 17. SPSI7,2 result over the Ningxia Plain [36].
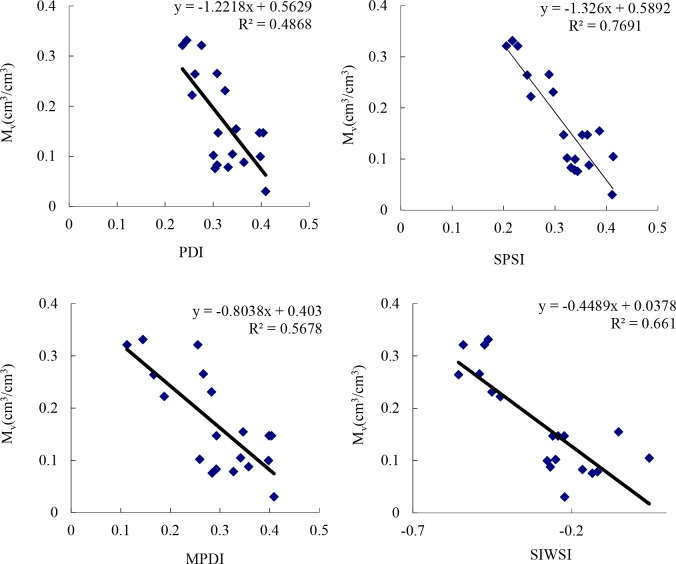
The vegetation indices values of image pixels corresponding to the two observation sites can be obtained by the information query tool. Part of the ground-measured surface data were used for established an inversion model. The linear regression was conducted on the ground-measured data and their corresponding vegetation Indices values to obtain the inversion models for the water content of soil (Fig 18). All four regression functions obtain a small p-value (P < 0.01), which indicates that there is a significant correlation between indices and the in-situ measurements. In addition, we can see that SPSI is the best vegetation index for monitoring drought in Ningxia.
Fig 18. Inversion models for soil and leaf water content.
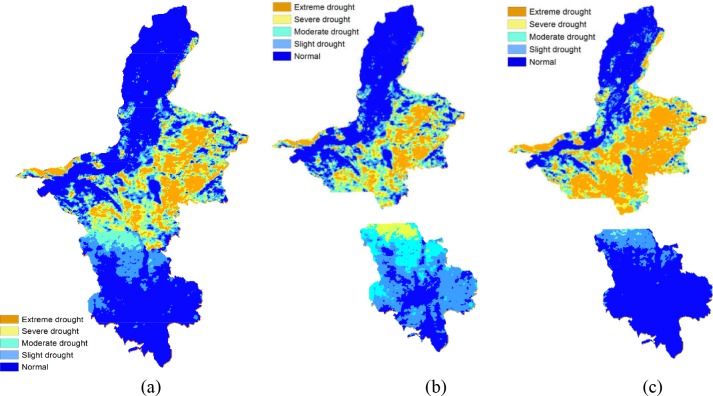
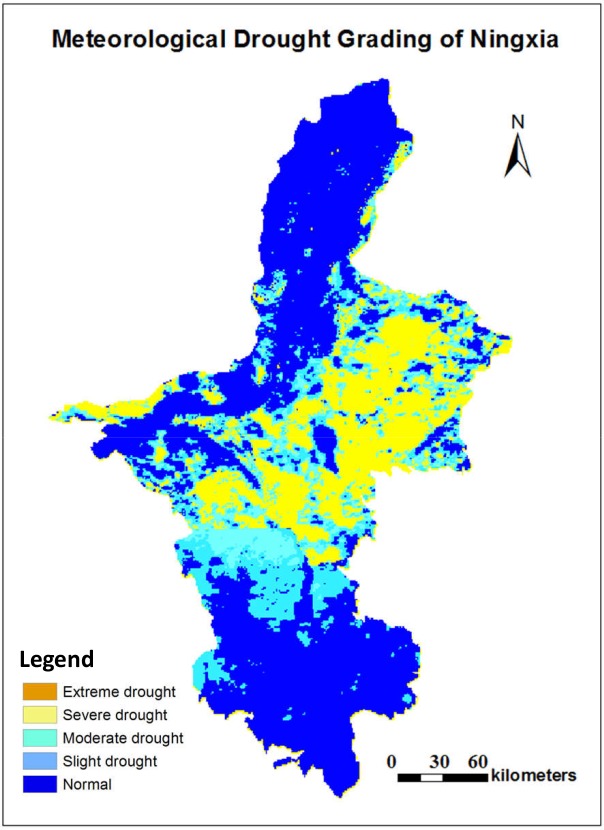
We then took the dataset in June as a sample, and used the drought rating feature to evaluate the risk level of drought disaster in Ningxia. First, we set the rating threshold values according to China’s meteorological drought rating standard [52] and obtain the meteorological drought rating result in Fig 19A. Second, considering the crops have different levels of water requirements in different growing periods [53], we further set the rating threshold values based on crop growing periods and generate the agricultural drought rating result of wheat and corn as shown in Fig 19B and 19C.
Fig 19. Two types of drought rating result of Ningxia.
(a) Meteorological drought rating, (b) Agricultural drought rating of wheat, (c) Agricultural drought rating of corn [54].
Due to the influence of terrain and climate, the growing period of crops in the middle north region is significantly different from that in the southern region of Ningxia, therefore, the drought status in these two regions are evaluated separately. It can be seen from Fig 19 that as for the wheat in the middle north region (the top part in Fig 19B), the meteorological drought rating result is basically consistent with the agricultural drought rating result, and this is because the wheat in this region is at the late growth stage. For the wheat in the south region (the bottom part in Fig 19B) and the corn in the middle north region (the top part in Fig 19C), the agricultural drought grade is mostly higher than the meteorological drought grade since the crops are at the vigorous stage and have a large water demand. For the corn in the south region (the bottom part in Fig 19C), the agricultural drought grade is lower than the meteorological drought grade since the corn is at the seedling stage and requires a small amount of water. Fig 19 also shows that the soil water content imposes different levels of stress on different crops in the same region, and thus RSDMS can implement agricultural drought evaluation based on the growth periods of crops and provide practical instructions on crop planting. After the final result was obtained, the mapping module of RSDMS can insert necessary map elements such as the map title, north arrow, scale bar, legend etc. to output the result as shown in Fig 20.
Fig 20. Drought evaluation mapping result[53].
5. Conclusion
There is an urgent need for a powerful and extendable remote sensing drought monitoring system in advanced research and professional work. The current systems such as GADMFS and GIDMaPS focus mainly on disseminating near real-time global drought monitoring information through web service technology or providing comprehensive global drought information by integrating multiple drought indicators. However, it is difficult for these systems to handle the continuous advent of drought indicators and the need of advanced data analysis. In order to fix this gap, we developed a component based system for agricultural drought monitoring by remote sensing, namely RSDMS. From the functional point of view, RSDMS is both a general image processing system and a professional drought monitoring system. It not only incorporates a variety of widely-used drought monitoring and evaluation models, but also achieves data preprocessing and management, image analysis etc. For instance, RSDMS can support all mainstream vector and raster data formats, especially remotely sensed images. Besides, RSDMS can handle large image datasets and provide a friendly user interface. More importantly, the most attractive feature of RSDMS is the strong flexibility owing to the flexible component-based architecture. On one hand, both the Functionality Component Library and the Monitoring and Evaluation Model Base are scalable. New functionalities and professional models can be easily added into the existing platform and managed well. On the other hand, the applications of RSDMS are not limited to drought monitoring. If RSDMS was embedded with new models in a new field such as the water quality parameter inversion models, it would become a new support platform.
Future work would be focused on the integration of RSDMS and the web-based drought information publishing system for accomplishing fast modeling and information publishing as well. Improving the efficiency and convenience of the workflows of professional modeling according to the practical regulations of drought monitoring organizations would be another important work to consider.
Acknowledgments
This work was supported by the National Natural Science Foundation of China under Grant No. 41701483 & 41571514. The authors thank the Ningxia Key Laboratory for Meteorological Disaster Prevention and Reduction for providing support during the field measurement.
Data Availability
All relevant data are within the manuscript.
Funding Statement
This work was supported by the National Natural Science Foundation of China under Grant No. 41701483 & 41571514. The authors thank the Ningxia Key Laboratory for Meteorological Disaster Prevention and Reduction for providing support during the field measurement. The funders had no role in study design, data collection and analysis, decision to publish, or preparation of the manuscript.
References
- 1.Godfray HCJ, Beddington JR, Crute IR, Haddad L, Lawrence D, Muir JF, et al. Food security: The challenge of feeding 9 billion people. Science. 2010; 327: 812–818. doi: 10.1126/science.1185383 [DOI] [PubMed] [Google Scholar]
- 2.Golian S, Mazdiyasni O, AghaKouchak A. Trends in meteorological and agricultural droughts in Iran. Theor Appl Climatol. 2014; 119: 679–688. [Google Scholar]
- 3.Yan NN, Wu BF, Boken K, Vijendra CS, Yang LD. A drought monitoring operational system for China using satellite data: design and evaluation. Geomatics, Natural Hazards and Risk. 2016; 7(1): 264–277. [Google Scholar]
- 4.Dracup J. Drought monitoring. Stochastic Hydrology and Hydraulics. 1991; 5: 261–266. [Google Scholar]
- 5.AghaKouchak A, Farahmand A, Teixeira J, Wardlow BD, Melton FS, Anderson MC, et al. Remote Sensing of Drought: Progress, Challenges and Opportunities. Reviews of Geophysics. 2015; 53 (2): 452–480. [Google Scholar]
- 6.Su Z, Abreham Y, Jun W. Assessing relative soil moisture with remote sensing data: theory, experimental validation, and application to drought monitoring over the North China Plain. Physics and Chemistry of the Earth. 2003; 28: 89–101. [Google Scholar]
- 7.Hayes M, Svoboda M, Wilhite D, Vanyarkho O. Monitoring the 1996 drought using the Standardized Precipitation Index. Bull Am Meteorol Soc. 1999; 80: 429–438. [Google Scholar]
- 8.Santos JF, Pulido-Calvo I, Portela MM. Spatial and temporal variability of droughts in Portugal. Water Resour. Res. 2010; 46, W03503. [Google Scholar]
- 9.Sheffield J, Wood E, Roderick M. Little change in global drought over the past 60 years. Nature. 2012; 491: 435–438. doi: 10.1038/nature11575 [DOI] [PubMed] [Google Scholar]
- 10.Chen C, Qin Q, Zhang N, Li J, Chen L, Wang J, et al. Extraction of bridges over water from high-resolution optical remote-sensing images based on mathematical morphology. International Journal of Remote Sensing. 2014; 35: 3664–3682. [Google Scholar]
- 11.Chen C, Qin Q, Chen L, Zheng H, Fa W, Ghulam A, et al. Photometric correction and reflectance calculation for lunar images from the Chang’E-1 CCD stereo camera. JOSA A. 2015; 32: 2409–2422. doi: 10.1364/JOSAA.32.002409 [DOI] [PubMed] [Google Scholar]
- 12.Easterling D. Global data sets for analysis of climate extremes. Extremes Changing Climates. 2013; 65: 347–361. [Google Scholar]
- 13.Thenkabail PS, Gamage MSDN, Smaktin VU, 2004. The use of remote sensing data for drought assessment and monitoring in Southwest Asia. Research Report of International Water Management Institute. [Google Scholar]
- 14.Qin QM, Jin C, Ghulam A, Wang LX, Li JP. Implementation of perpendicular drought index in remote sensing supporting system. 2006 IEEE International Geoscience and Remote Sensing Symposium. 2006; 4104–4107.
- 15.Gao MF, Qin ZH, Zhang HO, Lu LP, Zhou X, Yang XC. Remote sensing of Agro-droughts in Guangdong Province of China using MODIS satellite data. Sensors. 2008; 8: 4687–4708. doi: 10.3390/s8084687 [DOI] [PMC free article] [PubMed] [Google Scholar]
- 16.Shen XY, Mao KB, Qin QM, Hong Y, Zhang GF. Bare Surface Soil Moisture Estimation Using Double-Angle and Dual-Polarization L-Band Radar Data. IEEE Transactions on Geoscience and Remote Sensing. 2013; 51: 3931–3942. [Google Scholar]
- 17.Chen Y, Hao C, Wu W, Wu E. Robust dense reconstruction by range merging based on confidence estimation. Science China Information Sciences. 2016; 59: 092103. [Google Scholar]
- 18.Gu B, Sheng VS, Wang ZJ, Ho D, Osman S, Li S. Incremental learning for ν-support vector regression. Neural Networks. 2015. a; 67: 140–150. doi: 10.1016/j.neunet.2015.03.013 [DOI] [PubMed] [Google Scholar]
- 19.Gu B, Sheng VS. A robust regularization path algorithm for ν-support vector classification. IEEE Transactions on Neural Networks and Learning Systems. 2016. a; 1–8. [DOI] [PubMed] [Google Scholar]
- 20.Moran MS, Hymer DC, Qi J, Sano EE. Soil moisture evaluation using multi-temporal synthetic aperture radar SAR in semiarid rangeland. Agriculture and Forest Meteorology. 2000; 105: 69–80. [Google Scholar]
- 21.Jackson RD, Idso SB, Reginato RJ, Pinter PJ. Canopy temperature as a crop water-stress indicator. Water Resources Research. 1981; 17: 1133–1138. [Google Scholar]
- 22.Gu B, Sheng VS, Tay KY, Romano W, Li S. Incremental support vector learning for ordinal regression. IEEE Transactions on Neural Networks and Learning Systems. 2015. b; 26: 1403–1416. doi: 10.1109/TNNLS.2014.2342533 [DOI] [PubMed] [Google Scholar]
- 23.Sandholt I, Rasmussen K, Andersen J. A simple interpretation of the surface temperature/vegetation index space for assessment of surface moisture status. Remote Sensing of Environment. 2002; 79: 213–224. [Google Scholar]
- 24.Zhan ZM, Qin QM, Ghulam A, Wang DD. NIR-red spectral space based new method for soil moisture monitoring. Science in China Series D: Earth Sciences. 2007; 36:1020–1026. [Google Scholar]
- 25.Ghulam A, Li ZL, Qin QM, Tong QX, Wang JH, Qasim A. A remote sensing-based monitoring method of water content of full cover vegetation canopy: Shortwave Infrared Perpendicular Water Stress Index. Science in China (Series D: Earth Sciences). 2007. b; 37: 957–965. [Google Scholar]
- 26.Gu B, Sun XM, Sheng VS. Structural minimax probability machine. IEEE Transactions on Neural Networks and Learning Systems. 2016. b; 1–11. [DOI] [PubMed] [Google Scholar]
- 27.Xia Z, Wang X, Sun X, Wang B. Steganalysis of least significant bit matching using multi‐order differences. Security and Communication Networks. 2014; 7: 1283–1291. [Google Scholar]
- 28.Li J, Li XL, Yang B, Sun XM. Segmentation-based image copy-move forgery detection scheme. IEEE Transactions on Information Forensics and Security. 2015; 10: 507–518. [Google Scholar]
- 29.Liu Q, Cai W, Shen J, Fu Z, Liu X, Linge N. A speculative approach to spatial‐temporal efficiency with multi-objective optimization in a heterogeneous cloud environment. Security and Communication Networks. 2016; 9: 4002–4012. [Google Scholar]
- 30.Xia ZH, Wang XH, Sun XM, Liu QS. Xiong NX. Steganalysis of LSB matching using differences between nonadjacent pixels. Multimedia Tools and Applications. 2016; 75: 1947–1962. [Google Scholar]
- 31.Kong Y, Zhang M, Ye D. A belief propagation-based method for task allocation in open and dynamic cloud environments. Knowledge-Based Systems. 2017; 115: 123–132. [Google Scholar]
- 32.Zhou Z, Wang Y, Wu QJ, Yang CN, Sun X. Effective and efficient global context verification for image copy detection. IEEE Transactions on Information Forensics and Security. 2017; 12: 48–63. [Google Scholar]
- 33.Deng MX. Di LP, Yu GN, Yagci A, Peng CM, Zhang B, et al. Building an on-demand web service system for global agricultural drought monitoring and forecasting. IGARSS. 2012; 53: 958–961. [Google Scholar]
- 34.Hao Z, AghaKouchak A, Nakhjiri N, Farahmand A. Global Integrated Drought Monitoring and Prediction System. Scientific Data. 2014; 1:140001: 1–10. [DOI] [PMC free article] [PubMed] [Google Scholar]
- 35.Sheffield J, Wood E, Chaney N, Guan KY, Sadri S, Yuan X, et al. A Drought Monitoring and Forecasting System for Sub-Sahara African Water Resources and Food Security. Bulletin of the American Meteorological Society. 2014; 95: 861–882 [Google Scholar]
- 36.You L, Qin QM, Dong H, Li J. Wang JL, Yang XB. The component-based design and development of remote sensing system for drought monitoring. IEEE International Symposium on Geoscience and Remote Sensing IGARSS; 2010. p. 3849–3852.
- 37.Liang S. Quantitative Remote Sensing of Land Surface. Wiley-Interscience, 2004: 413–415. [Google Scholar]
- 38.Vermote EF, Tanré D, Deuzé JL, Herman M, Morcrette JJ. Second Simulation of the Satellite Signal in the Solar Spectrum, 6S: An Overview. IEEE Transactions on Geoscience and Remote Sensing. 1997; 35: 675–686. [Google Scholar]
- 39.Kotchenova SY, Vermote EF, Levy R, Lyapustin A. Radiative transfer codes for atmospheric correction and aerosol retrieval: intercomparison study. Applied Optics. 2008; 47: 2215–2226. [DOI] [PubMed] [Google Scholar]
- 40.Deering DW. Rangeland reflectance characteristics measured by aircraft and spacecraft sensors. Texas A&M University; 1978. [Google Scholar]
- 41.Tian GL, Yang XH. Remote sensing model for wheat drought monitoring. Remote Sensing of Environment China. 1992; 7: 83–89. [Google Scholar]
- 42.McFeeters SK. The use of the Normalized Difference Water Index (NDWI) in the delineation of open water features. International Journal of Remote Sensing. 1996; 17: 1425–1432. [Google Scholar]
- 43.Xu HQ. Modification of normalised difference water index (NDWI) to enhance open water features in remotely sensed imagery. International Journal of Remote Sensing. 2006; 27: 3025–3033. [Google Scholar]
- 44.Carlson T.N, Gillies RR, Perry EM. A method to make use of thermal infrared temperature and NDVI measurement to infer surface soil water content and fractional vegetation cover. Remote Sensing Reviews. 1994; 9: 161–173. [Google Scholar]
- 45.Kogan FN. Application of vegetation index and brightness temperature for drought detection. Advances in Space Research. 1995; 15: 91–100.11539265 [Google Scholar]
- 46.Fensholt R, Sandholt L. Derivation of a shortwave infrared water stress index from MODIS near-and shortwave infrared data in a semiarid environment. Remote Sensing of Environment. 2003; 87:111–121. [Google Scholar]
- 47.Ghulam A, Li ZL, Qin QM, Tong QX. Exploration of the spectral space based on vegetation index and albedo for surface drought estimation. Journal of Applied Remote Sensing. 2007. a; 1: 1–12. [Google Scholar]
- 48.Feng HX, Qin QM, Li BY, Liu F, Jiang HB, Dong H, et al. The new method monitoring agricultural drought based on SWIR-Red spectrum feature space. Spectroscopy and Spectral Analysis. 2011; 31: 3069–3073. [PubMed] [Google Scholar]
- 49.Fox GA, Sabbagh GJ, Searcy SW, Yang C. An Automated Soil Line Identification Routine for Remotely Sensed Images. Soil Science Society of America Journal. 2004; 68: 1326–1331. [Google Scholar]
- 50.Yang XB, Qin QM, Yao YJ, Zhao SH. Comparison and Application of PDI and MPDI for Drought Monitoring in Inner Mongolia. Geomatics and Information Science of Wuhan University. 2011; 36:195–198. [Google Scholar]
- 51.Zhao SH, Wang Q, Zhang F, Yao YJ, Qin QM, You L, et al. Drought Mapping Using Two Shortwave Infrared Water Indices with MODIS Data under Vegetated Season. Journal of Environmental Informatics. 2013; 21:102–111. [Google Scholar]
- 52.China Weather, 2010. State Standard of Meteorological Drought Grade. Available from: http://www.weather.com.cn/drought/ghzs/04/416273.shtml
- 53.Ma LW, Li FX, Liang X. Characteristics of drought and its influence of agriculture in Ningxia. Agricultural Research in the Arid Areas. 2001; 19: 102–109. [Google Scholar]
- 54.You L. Study on Operational Monitoring Farmland Drought and Evaluating Yield Loss by Drought Disaster in Ningxia. Peking University; 2011. [Google Scholar]
Associated Data
This section collects any data citations, data availability statements, or supplementary materials included in this article.
Data Availability Statement
All relevant data are within the manuscript.


