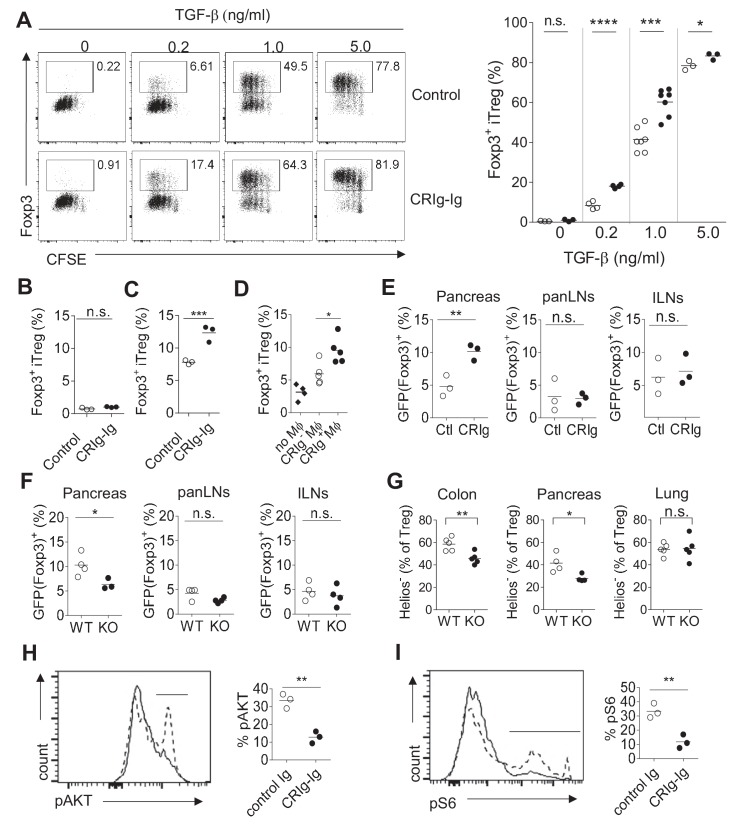
Figure 3. CRIg promotes iTreg generation in vitro.
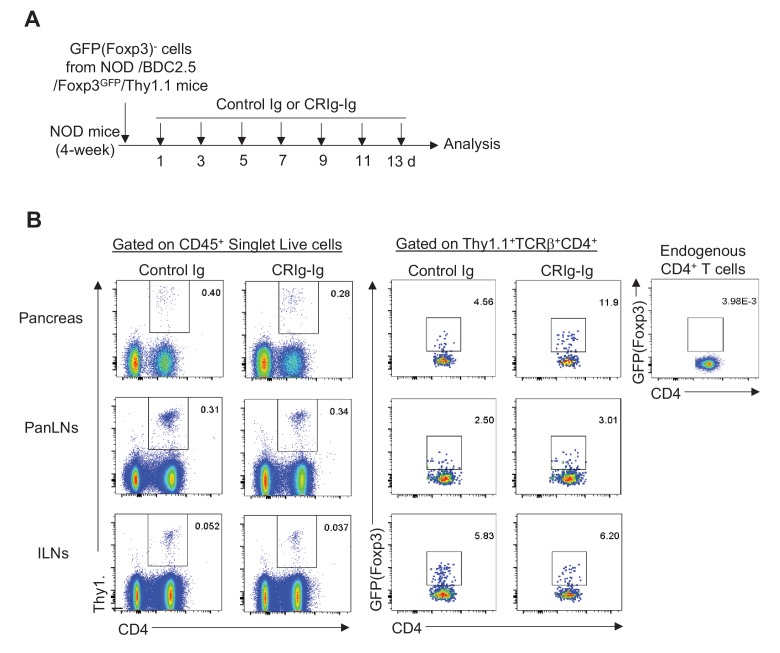
(A) (left) Representative FACS plots depicting the generation of iTreg cells in the presence of CRIg-Ig, or control Ig, under various concentrations of TGF-β. (right) Statistics of multiple experiments. (B) Tconv cells were cultured in the condition of anti-CD3/CD28 and IL-2, anti-TGF-β neutralizing antibody (clone 1D11) and either control Ig, or CRIg-Ig. (C) Total splenocytes from 8-week-old NOD/BDC2.5/Thy1.1 mice were labeled with CTV and cultured with BDC2.5 mimotope (100 ng/ml) for 3 days. The generation of Treg cells were analyzed by intracellular Foxp3 staining. (D) iTreg generation in vitro as in (C) with the inclusion of CRIg+ or CRIg- macrophages, sorted from peritoneal cavity. (E) Purified CD4+Foxp3 (GFP)- T cells from NOD/BDC2.5/Foxp3GFP/Thy1.1 mice were transferred into 4-week-old NOD mice, followed by i.p. injection of CRIg-Ig, or control Ig every other day for 2 weeks. (F) Purified CD4+Foxp3 (GFP)- T cells from NOD/BDC2.5/Foxp3GFP/Th1.1 mice were transferred into 4-week-old NOD or NOD/CRIg KO mice. The generation of Foxp3(GFP)+ cells in pancreatic islets, panLNs and inguinal LNs(ILNs) was analyzed 2 weeks after the transfer. (G) Flow cytometric analyses of Helios- Treg cells from pancreas, colon and lung of NOD/CRIgKO and wildtype controls. (H, I) Purified CD4+ Foxp3(GFP)- T cells were cultured with either control Ig or CRIg-Ig for 18 hr and analyzed for the phosphorylation of AKT (H) and ribosomal protein S6 (I). Dotted line, control Ig; solid line, CRIg-Ig. Data are representative of five (A), three (B–I) experiments. Student’s t-test was used. n.s., non-significant. *p<0.05; ***p<0.001; ****p<0.0001. Ctl, control; KO, CRIg knockout.


