Abstract
During the 4 years following the nuclear power plant accident of 2011, 39 males and 77 females were diagnosed with or suspected of having cancer based on the first-round thyroid examination of the Fukushima Health Management Survey (FHMS) targeting residents aged <19 years in Fukushima. Prior comparisons between the observed data and Japan's National Cancer Registry (NCR) data suggested that this incidence might be excessive, but such comparisons are problematic because they need not only to adjust index unit (prevalence proportion vs incidence rate), but also examine characteristics (complete enumeration mass screening for the aged 0 to 18 years vs detections in clinical settings for all the residents) and sensitivity of the examinations. The purpose of this study is to build a common model applicable to any region in Japan under nonaccident conditions, and estimate the expected prevalence based on the numbers of subjects surveyed in the FHMS using a simulation of the sensitivity.
The cancer-progression model is an extension of Day and Walter's, the parameters of which were estimated by minimizing the weighted root mean squared error between the average age-specific thyroid incident rates from 2001 to 2010 in the NCR and those determined by the model. We estimated expected detectable prevalent cases by the model with their examination-participation proportions and simulated several sensitivities.
Median sojourn times were 34 years (males) and 30 years (females) by the model. Simulation results showed that the numbers of observed prevalent cases were within the 95% confidence intervals of the expected prevalent cases with several sensitivities in each gender.
We successfully built a cancer-progression model of thyroid cancer based on Japan's NCR data under no accident conditions. It is a tool for comparing the observed prevalence data of examinations and the NCR data, which resolved 3 issues of index unit, the characteristics and sensitivity of the examinations. Simulation results imply that the number of observed thyroid cancer cases can be detected by the FHMS first-round thyroid screening at several sensitivities under no accident conditions.
Keywords: common model for any prefecture in Japan, estimation of expected prevalence proportion, Fukushima Health Management Survey, National Cancer Registry, simulation model with sensitivity, sojourn time, ultrasound examination of thyroid cancer
1. Introduction
After the nuclear power plant accident caused by the Great East Japan Earthquake of 2011, the Fukushima Health Management Survey (FHMS)[1] was conducted to promote the long-term health of young people. The FHMS comprised a basic survey and 4 detailed surveys: a thyroid ultrasound examination, a comprehensive health check, a mental health and lifestyle survey, and a pregnancy and birth survey. The thyroid examination was conducted using a cohort study scheme in which the subjects were monitored routinely (at 2-year intervals in those <20 years old, and at 5-year intervals in those ≥20 years old). It consisted of a primary mass ultrasound screening for all subjects aged <19, and a secondary confirmatory examination (ultrasound, thyroid function, thyroglobulin, urinary iodine, and aspiration cytology if necessary) for the subjects found to be positive for thyroid cancer in the primary examination.[2] The first-round survey was conducted from October 2011 to April 2015 (43 months). It was a complete mass screening of children and adolescents, which was unique and had no precedent.
As a result of the first-round survey, thyroid cancer was detected or suspected in a total of 116 people (39 males and 77 females) among 300,473 children and adolescents.[3–5] It led to a discussion of whether or not the number of observed prevalent cases was excessive.
From the beginning the prevalent cases has begun to be found, the United Nations Scientific Committee on the Effects of Atomic Radiation (UNSCEAR) 2013 report[6] stated that among adults, no discernible increased incidence of radiation-related health effects is expected in exposed members of the public or their descendants.
On the other hand, Tsuda et al[7] indicated that a high incidence rate ratio, which was 50 in the highest area, has occurred in Fukushima, but 8 letters which questioned the scientific validity of that article[8–15] were subsequently published. For example, Takahashi et al[12] argued that they used a bizarre methodology. Tsuda's calculation was based on a formula relating the prevalence, incidence and mean duration, P = I × D,[16] where P is the prevalence proportion, I is the incidence rate, and D is the mean disease duration. They first assumed a duration D of 4 years as the length between the accident and the detection of cancer by the examination, and secondly calculated the incidence rate as P/D using the observed prevalence proportion P, without checking the equilibrium of the disease pool. In addition, they assumed a mean duration of 4 years without observing the rate of outflow.
Katanoda et al[17] first calculated the expected cumulative incidence number E = 5.2 and compared it with observed prevalent number O = 160.1 for all individuals (E = 1.2, O = 54.8 for males, and E = 4.0, O = 105.3 for females). They pointed out that these observed numbers might be due to overdiagnosis given the O/E ratio of 30.8 (95% confidence interval [CI]: 26.2, 35.9) for all individuals, 46.1 (34.5, 59.8) for males, and 26.6 (21.7, 32.0) for females, and the cumulative number of thyroid cancer deaths in Fukushima Prefecture (annual average from 2009 to 2013), 0.10 (0.02 for males and 0.08 for females) by age 29, and 0.60 (0.27 for males and 0.33 for females) by age 39.
Their studies contain a comparison between the number of prevalent cases observed by the FHMS and the number of incident cases in the National Cancer Registry (NCR). We believe this comparison should resolve 3 essential points: first, the FHMS data show the prevalence proportion whereas the NCR[18] data give the incidence rate, which are not comparable directly. Second, the FHMS thyroid examination data were obtained by complete enumeration mass screening for those aged 0 to 18 years, whereas the NCR data were obtained as a result of routine detections in clinical settings for all people, without an age-range selection. Third, the sensitivities of both the primary ultrasound examination and the secondary confirmatory examination of the FHMS thyroid examination are unknown. Concerning these points, the comparisons in the Katanoda study did not address the second and third points.
Regarding the second point, making a comparison with a simple unit adjustment between the 2 data sets is not sufficient—especially for comparing between findings made through a mass screening of only young subjects and those made through a cancer registry including many adults. Thus, a tool to combine them is necessary, such as a model of disease progression of thyroid cancer. For the model of disease progression, the sojourn time, that is, the length of time needed for cancer to progress between being detectable by an examination and being detectable clinically, is a key concept. Several papers have dealt with sojourn-time model structure. For example, Day and Walter[19] proposed a model (the DW model) for evaluating breast cancer, and Michalopoulos and Duffy[20] used it to study the overdiagnosis of breast cancer in Norway. The DW model is structured by 2 functions (the incidence function of detectable incidence and the probability density function of the sojourn time).
Regarding the third point, the sensitivity of the thyroid examination in Japan, there have been previous reports of the sensitivity being 0.57 to 0.86,[21] 0.40 to 0.44,[22] and 0.29 to 0.87.[23] Regarding the detection proportion, Miyazaki et al[24] reported that it was 0.38% for a population with an average age of 50 years, whereas a proportion of 0.023% was reported following a mass thyroid ultrasound screening survey of children from 3 Japanese prefectures (Aomori, Yamanashi, and Nagasaki).[25,26] In contrast, the NCR data[27] for the same age categories indicate a value of 0.002% in the Katanoda study.[17] As for the sensitivity of the examination in the FHMS, there were no previous data and no reflected mass screening data in this survey. A simulation of the sensitivity would be helpful.
To investigate this, we first built a common cancer-progression model of thyroid cancer progression using the DW model, which is applicable to any prefecture in Japan under the condition of no disasters or accidents. Second, we estimated the number of expected detectable thyroid cancer cases based on the cancer-progression model with the Fukushima population and the participation proportions for the first-round FHMS examinations.
2. Methods
2.1. Cancer-progression diagram, and the definitions of “detectable incident,” “clinical incident,” and “sojourn time”
We considered a natural cancer-progression diagram (Fig. 1). We first assigned the time Tp to represent the time that cancer emerged in the body as a detectable incident. The cancer progresses and is detected in clinical practice at TC (i.e., clinical incident). In the diagram, we defined a “detectable incident” as the emergence of a tumor in the body, which is slightly different from the traditional definition of the emergence of a tumor being detectable by examination. We did this to avoid the ambiguity of the traditional definition that the emergence of a tumor depends on the detection ability of the examination equipment. Our definition enables us to classify undetected cases with tumors as false negatives. We also defined a “clinical incident” as the detection of a tumor in a clinical setting, which includes detection during the subject's annual health examination or while visiting a doctor.
Figure 1.

A disease progression model.
We defined the “sojourn time” as the length of time between the detectable incident and the clinical incident in the natural history of thyroid cancer in the diagram. Here, the actual value of the sojourn time and its individual variation are typically not known.
2.2. Subjects and data analysis
To determine the clinical incidence rate of thyroid cancer just before the Fukushima nuclear power plant accident in March 2011, we used the number of age-specific cases in the NCR data[27] collected between 2001 and 2010 for both genders as representative recent values, and the corresponding age-specific populations based on the nationwide census data collected between 2001 and 2010 (observational study). With 18 five-year age-specific categories (0–4, 5–9, …, 85+ years of age), we calculated the average age-specific incidence rate between 2001 and 2010 using the total number of incident cases divided by the corresponding averaged annual population (averaged person-years) for both genders under the assumption that the incidence rates were the same through 2001 to 2010. The NCR data were collected from a total of 125 to 126 million people, and the number of incidences of thyroid cancer (ICD-10:C73) ranged from 7800 to 13,700.[25] The number of age-specific incident cases and those of the corresponding population are fully available on the Internet at the following URL: http://ganjoho.jp/reg_stat/statistics/dl/index.html (In Japanese).
2.3. The DW model and an extended cancer-progression model
The DW model has been applied to periodic screening data, but not to the type of data we were working with, namely the single screening data and annual incidence rates given in the NCR data. It was necessary to convert the annual age-specific incidence rate to data based on age categories determined by birth cohort. So, we extended the DW model's estimation procedure to add survival probability in order to perform this conversion. The formulation of the DW model and its extension are described in the Appendix in detail. The extended cancer-progression model is, as result, the same as the DW model,
 |
In our model, it is
 |
With this model, we obtain not only the incidence rate at time t but also the prevalent proportion at ts,
2.4. Estimation of the number of expected prevalent cases using the cancer-progression model with simulation for the first-round thyroid examination in Fukushima
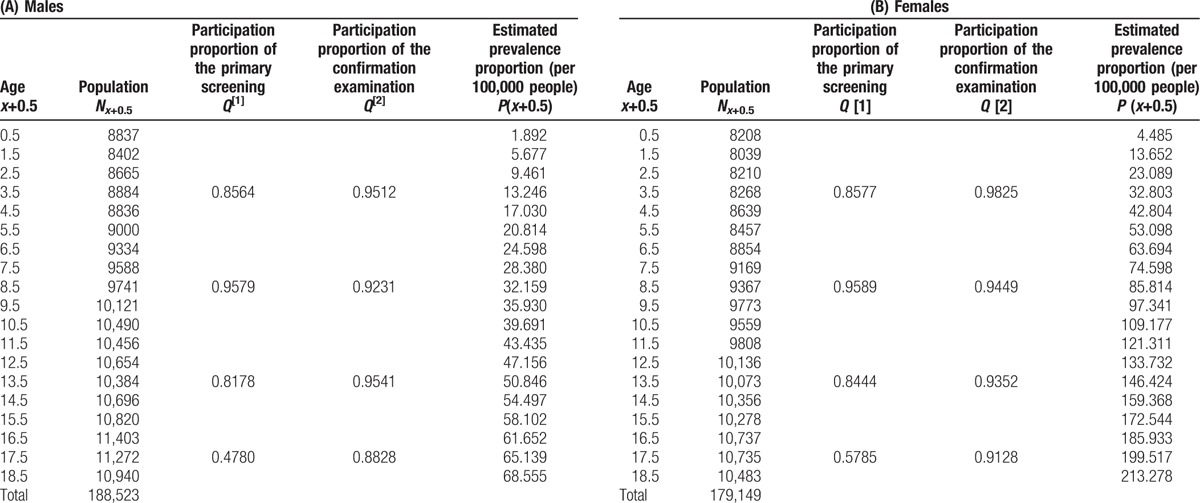
The subjects were Fukushima Prefecture residents aged 0 to 18 years at the time of the March 2011 nuclear power plant accident: 188,523 males and 179,149 females. Of these, 151,685 males and 148,791 females underwent the primary ultrasound examination. The number of participants and the participation proportions are listed in Table 1A and B. We applied 19 categories of age at the earthquake, [0,1),[1,2), …, [18,∞), where [x,x+1) for x = 0,1,2, …, 17 represent age categories of x ≦ age <x+1, and [18,∞) means that 18 ≦ age for x = 18, and their representative age values (0.5, 1.5, …, 18.5). The number of age-specific expected prevalent cases Ex+0.5 at the representative values of the age category [x,x+1) for x = 0,1,2, …, 17 and [18,∞) for x = 18 is determined as follows:
Table 1.
Estimated prevalence and proportions undergoing the primary screening and confirmation exam by gender and age.
where Nx+0.5 is the number of is participants, P(x+0.5) is the expected prevalence proportion determined by the model (formula (3)), and  are the primary and confirmatory participation proportions of people whose ages are in [0,4), [5,9),[10,14), [15,19),[20,∞), respectively. Thus, the expected number of prevalent cases E for the FMHS's first-round thyroid examination is given as
 |
where Ex+0.5 is as described in formula (4).
Because the sensitivities for both the primary mass screening examination Sen1 and secondary confirmation examination Sen2 are unknown for both genders, we submitted the sensitivities of the examinations, that is, 0.5 to 0.9 for the primary mass screening and 0.8 to 1.0 for the secondary confirmation examination, and both sensitivities were 1 in the simulation. The expected detected cases at age t and their 95% CIs are calculated using the equation. The approximate 95% CIs of the expected prevalent cases were estimated through a Poisson approximation of the binomial distribution.
2.5. Ethics
Because we used only summarized data, no ethical review by an institutional review board was necessary for the study, according to the Ethical Guidelines for Medical and Health Research Involving Human Subjects, Japan.[28]
3. Results
3.1. Model estimation
Table 2 shows the most appropriate estimators (c, λ, μ, σ2) for the number of age categories, K = 7, …, 18, in the model. It shows that the most appropriate highest age categories were 0 to 34 years for males and 0 to 39 years for females because they had minimum root mean square errors (RMSEs) of 5.304 × 10⁻⁸ for males and 18.606 × 10⁻⁸ for females, respectively. The estimated parameters of (Κ, c, λ, μ, σ2) were (7, 3.784 × 10⁻⁵, 0.000, 34, 0.24) for males and (8, 8.905 × 10⁻⁵, 0.029, 30, 0.20) for females.
Table 2.
Appropriate estimation of parameters in age categories.
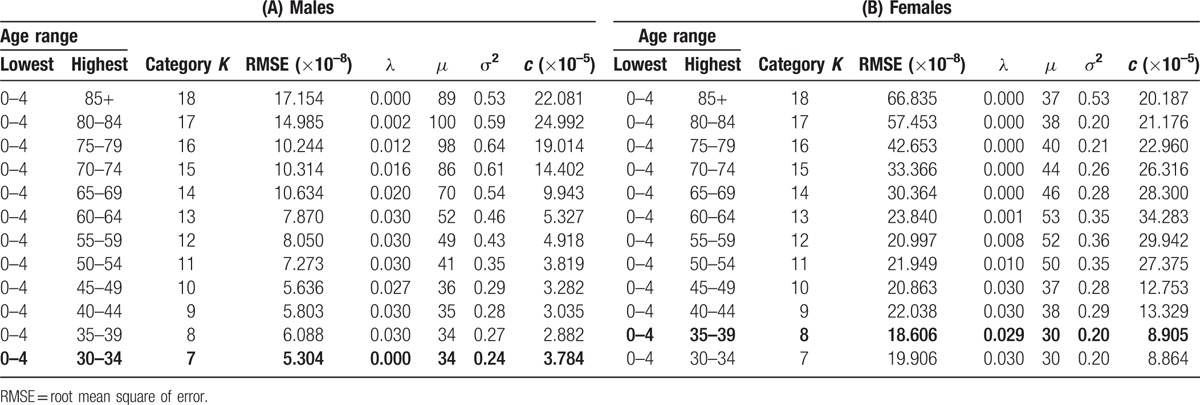
We consider the model with the parameters (Κ, c, λ, μ, σ2) (formula (2)), and the parameters (Κ, c, λ, μ, σ2) gave the minimum value of RMSE. The model with the parameters (7, 3.784 × 10⁻⁵, 0.000, 34, 0.24) for males and (8, 8.905 × 10⁻⁵, 0.029, 30, 0.20) for females is the most appropriate in the sense that it gave the minimum weighted RMSE between the values of NCR and those of the model.
Table 3 shows the most appropriate parameters and their neighborhood of μ in the model. The median estimated sojourn time was 34 years in males and 30 years in females. The 90th, 75th, 50th, 25th, and 10th percentiles of the sojourn times were 46.2, 40.0, 34.0, 28.9, and 25.0 years for males and 38.8, 34.3, 30.0, 26.2, and 23.2 years for females, respectively, which were derived from the log-normal distribution.
Table 3.
RMSEs of the various median sojourn times in the various age categories.

The age-specific incidences based on the model and the NCR are shown in Figure 2A and B. Nearly all of the model-based incidences fell into the 95% CI range of the incidence values based on the NCR for both genders.
Figure 2.
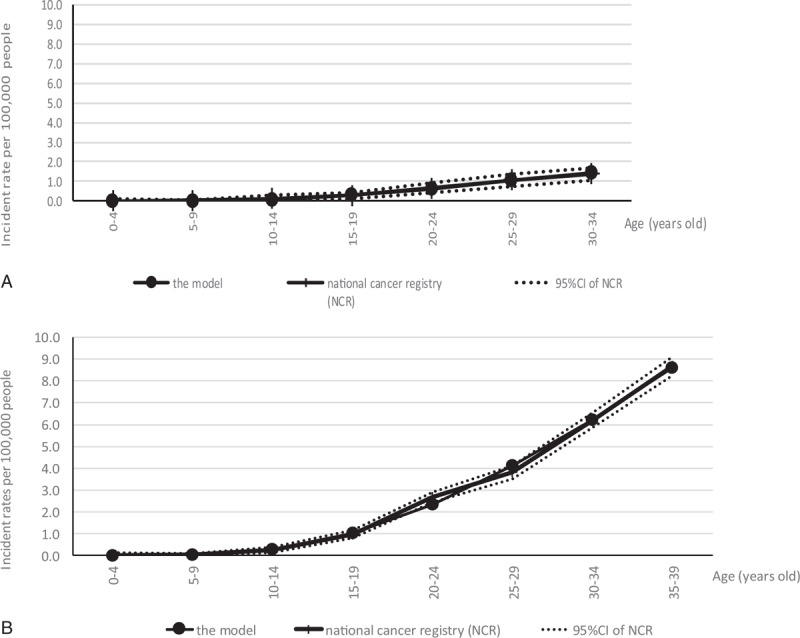
(A) Estimated incidence values obtained using the model and the National Cancer Registry, with 95% CIs for males. (B) Estimated incidence values obtained using the model and the National Cancer Registry, with 95% CIs for females. CI = confidence interval.
We confirmed that it was the most appropriate estimator by checking whether it attained the local minimum among the sets of parameters by changing the age range and median sojourn time, with the results shown in Tables 2 and 3, respectively.
3.2. Estimation of expected prevalent cases by the cancer-progression model with simulation for the first-round thyroid examination in Fukushima
The estimated age-specific prevalence based on the cancer-progression model was shown in the rightmost column of Table 1A for males and 1B for females. The expected detectable cases were estimated based on the cancer-progression model using the values in Table 1A and 1B, and several pairs of sensitivities for the primary screening and confirmation examination are tabulated in Table 4 for both genders.
Table 4.
Expected detected cases determined by the model with several sensitivity values.
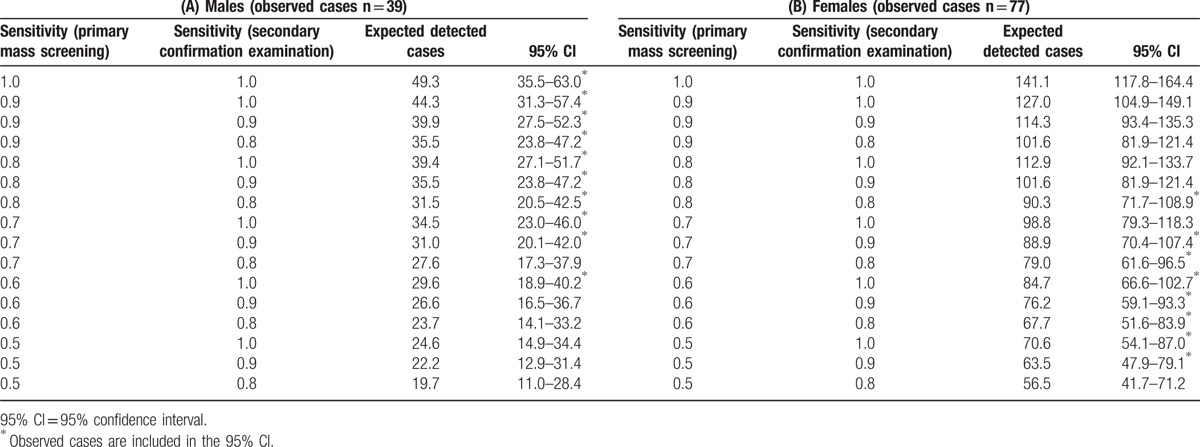
The 39 observed prevalent cases of males fell within the 95% CI with the following patterns of sensitivity values for the primary and secondary examinations: (0.6, 1.0), (0.7, 0.8), (0.7, 0.9), (0.7, 1.0), (0.8, 0.8), (0.8, 0.9), (0.8, 1.0), (0.9, 0.8), (0.9, 0.9), (0.9, 1.0), and (1.0, 1.0). The 77 observed prevalent cases of females fell within the 95% CI using the following sensitivity patterns: (0.5, 0.9), (0.5, 1.0), (0.6, 0.8), (0.6, 0.9), (0.6, 1.0), (0.7, 0.8), (0.7, 0.9), (0.7, 1.0), and (0.8, 0.8).
4. Discussion
We were able to build a cancer-progression model in which the detectable incidence can be compared with the clinical incidence provided by the NCR. In our present application of the model to Fukushima Prefecture, we included the observation of 39 males and 77 females in the first-round FHMS survey in the 95% CI of the model-based detectable incidence for some sensitivity values, which meant it would be likely that the current number of thyroid cancer cases was not excessive but rather was within the ordinary range estimated by the NCR for those sensitivity values. In this research, we only used published NCR data, and we built a radiation-free model, which is applicable in any region in Japan.
4.1. Model estimation
For thyroid cancer, we were able to use the common progression model from the time point of the emergence of tumors in the body to their clinical detection by extending the estimation procedure of the parameters in the DW model. In our model, the model-based clinical incidence and the NCR fit well in the sense that all of the rates were included in the 95% CIs. The choice of the exponential function for J(t) and the log-normal distribution of f(y) is essential in our study. These functions are both simple and easy to understand. A sojourn time exceeding the life expectancy can be considered latent thyroid carcinoma. To express the possibility of a long sojourn time for thyroid carcinoma, we applied a log-normal distribution. For children and adolescents aged ≤18, the clinical incidence rate is low. The assumption of high probability for short sojourn times is unrealistic; we considered that a log-normal distribution of unimodal distribution with skewness to the right is appropriate. Of course, other models and estimation procedures can be considered, but our results based on this model provided important information for future use.
For the natural history of a disease, model descriptions with a transition probability might also be valid. For example, Duffy et al's work with the Markov chain model[29] might be applied to this topic. We did not apply this model in the present study because of the lack of periodic screening data for thyroid cancer in children and adolescents and their later history.
We selected the highest age categories (30–34) for males and (35–39) for females based on the RMSE for each gender. They were similar, which implies that cases in individuals over 40 years involve different characteristics (i.e., competing risks), which are similar between genders, for their incidence.
The fitting of the model-based incidence to the clinical incidence was good for each gender (Fig. 2). The slight gaps at 20 to 24 and 25 to 29 years might be related to hormonal factors in females.
4.2. Interpretation of sojourn time
With regard to the estimated median sojourn time of 34 years for males, an individual's body will grow and tumors will be detected clinically with random variation following a log-normal distribution of a median of 34 years. We consider that the sojourn time includes cases in which the tumors “regress,” “remain indolent” or are “undetected throughout an individual's lifetime.” If no regression occurs or no remaining indolent cases occur, the sojourn time would be shorter. If a tumor is undetected throughout an individual's lifetime, the sojourn time would become longer.
With regard to the issue of differing ages at diagnosis, we consider the age at diagnosis to be independent of the sojourn time. There are many cases in which a thyroid tumor is not found while the individual is alive but is discovered during the individual's autopsy as latent cancer.[30] If the patient died of another cause at 80, the median sojourn time was considered to be 42 years.
4.3. Simulation study of the estimation of expected detectable cases in Fukushima with the cancer-progression model
This cancer-progression model for thyroid cancer is applicable to any area in Japan, and it is independent of the effect of accidents and natural disasters. In this study, we applied only the total number of subjects and participants in the FHMS to the model. As a simulation, the number of actual observed cases were included in the 95% CI of the expected detected cases estimated by the model with several sensitivity values. The results indicate that these observed cases in FHMS were realistic or not excessive under the implementation of thyroid cancer screening examinations with several sensitivity levels in ordinary radiation-free situations.
4.4. Interpretation of the results
The numbers of expected prevalent cases estimated to be detected by a thyroid examination were 49.3 for males and 141.1 for females when the sensitivity values of the primary mass screening and secondary confirmation examinations were both 1. These are the numbers of prevalent cases in Fukushima that are detectable by the screening examination.
This study indicated a prevalence of 0.026% for males and 0.079% for females. Although there are only a few reports on the prevalence of thyroid cancer, the mass thyroid ultrasound screening survey of children from 3 Japanese prefectures[26] showed a rate of 0.023% in children and adolescents aged 3 to 18 years old. Miyazaki et al[24] reported that a health-screening ultrasound examination revealed a thyroid cancer prevalence of 0.38% in adults. Considering that our present study's subjects are children and adolescents, our prevalence rate would not be considered high.
Though high sensitivity is generally desirable in medical examinations so as to detect cancer at an early stage, the screening for thyroid cancer is not simple. Although the natural history of thyroid cancer has not been well studied, it is known among specialists that thyroid cancer progresses very slowly. Thus, fine-needle aspiration cytology (FNAC) is not thought to be necessary for the definitive detection of a thyroid tumor, and the detection of thyroid cancer may tend to be suppressed[31] because people consider the early detection of thyroid cancer by ultrasound to be prone to overdiagnosis. The clinical guidelines for thyroid nodules issued by the Japan Thyroid Association[32] state that the recommendations for conducting FNAC are as follows: if the size >20 mm; if the size >10 mm and some sort of cancer is suspected as a result of the ultrasound examination; and if the size >5 mm and cancer is strongly suspected as a result of the ultrasound examination, for example. On the other hand, the American Thyroid Association guidelines recommend that FNAC should not be used for tumors <10 mm in size[33] even if cancer is strongly suspected.[34] This recommendation means that some cases with tiny amounts of thyroid cancer are classified as cancer free by the ultrasound examination (the occurrence of false negatives), which is a factor in reducing the sensitivity of the ultrasound examination.
Special attention to false negatives is necessary to discuss the presence of disease from either viewpoint, biological, or diagnostic. There are cases of thyroid cancer that emerge biologically in the body that cannot be detected by the examination. The thyroid ultrasound examination protocol based on the Japanese clinical guidelines adopts severer criteria compared to those used in the United States and Korea, which have high rates of detection.[35] A Korea study[35] showed increasing incidence rates, while mortality remained constant. The authors concluded that this phenomenon was based on overdiagnosis. In Japan, there is a possibility that the current guideline is a factor contributing to overdiagnosis. Carefully defined guidelines for the detection of thyroid cancer, especially in children and adolescents, would be necessary to avoid this problem.
In the present study, actual observed cases in males were included in the 95% CI with several patterns of sensitivity values for the primary and secondary examinations. Although the exact sensitivity values of the examinations are unknown, the common sensitivity values including the actual prevalent cases were (0.8, 0.8), (0.7, 0.9), and (0.6, 1.0) for both genders. As the false-negative rate for the confirmation examination is low, the latter 2 pairs of values might reflect the thyroid ultrasound examination in Fukushima.
We considered the 10-year period of 2001–2010 in order to stabilize the random fluctuation of the age-specific incidence data, because the incidence values of the age categories 0 to 4, 5 to 9, and 10 to 14 years old were very low. We considered that an approximately 10-year period would be preferable to represent the state immediately before the occurrence of the nuclear power plant accident.
4.5. Limitations and future research
First, with regard to developing the cancer-progression model, we applied only 1 function system (the exponential function system for J(t) and the lognormal distribution system for f(t)). As described earlier, examinations with other function systems in the model are possible, and these will be performed in future research.
Second, no detectable incidence J(t) could be observed, which is an important problem. Though there is uncertainty in the model, we assumed that the trend of detectable incidence was parallel to that of clinical incidence, which is considered an effective method.
Third, we were not able to clarify the sensitivity of the ultrasound examinations, which is also an essential problem. If we obtain routine data, however, it will be possible to estimate the sensitivity.
Despite these limitations, our study and its results will help further clarify the natural history of thyroid cancer and the detection of thyroid cancer by ultrasound examinations. On the other hand, as second-round and third-round data are now being added to the database, this accumulation of data will make more detailed epidemiologic studies possible in the future. Our findings will also be useful in future research on the necessity of performing ultrasound examinations in suspected cases of thyroid cancer.
5. Conclusion
We successfully built a cancer-progression model of thyroid cancer based on Japan's NCR data under no accident conditions. It is a tool for comparing the observed prevalence data of examinations and the NCR data, which resolved 3 issues of index unit, the characteristics and sensitivity of the examinations. Simulation results imply that the number of observed thyroid cancer cases can be detected by the FHMS first-round thyroid screening at several sensitivities under no accident conditions.
Acknowledgments
We appreciate the great cooperation of the residents of Fukushima Prefecture with the Fukushima Health Management Survey. This study was conducted as parts of the project planned in the Fukushima Health Management Survey. The design and conduct of the study were supported by the National Health Fund for Children and Adults Affected by the Nuclear Incident. The findings and conclusions of this article are solely the responsibility of the authors and do not represent the official views of the Fukushima Prefecture government. The authors have no conflicts of interest to declare.
Appendix
The formulation of the DW model
Day and Walter[19] used natural growth as a combination of constant function and exponential probability density distribution for their evaluation of the effectiveness of periodic breast cancer screenings. They considered a constant function for the growth of breast cancer because the effect of the screening was relatively short-term with short screening intervals. For the individual variations in the sojourn time, they considered 3 types of probability distributions: step function, lognormal and exponential distributions.
In Japan, however, screening for thyroid cancer among children and adolescents had never been conducted before 2011. In addition, the cancers detected by the FHMS screening were not reflected in the national registry data for 2010 and earlier. Generally, the prognosis of thyroid cancer is notably better than those of other types of cancer, and the age-specific incidence of cancer usually fits an exponential function well in the younger age range. For these reasons, we adopted an exponential function as the incidence function of detectable incidence at age t: J(t,c,λ) = ceλt, and a log-normal distribution, LN(logμ, σ2), for the probability density function of a sojourn time of y years:
 |
The model-based clinical incidence rate at age t without screening was derived as:
 |
The parameters are (c,λ,μ,σ2) in the model. In the formula, we simply describe  .
.
An extension of the DW model
We consider the survival probability of the general population at age t S(t) (S(0) = 1) and obtain the conditional survival probability 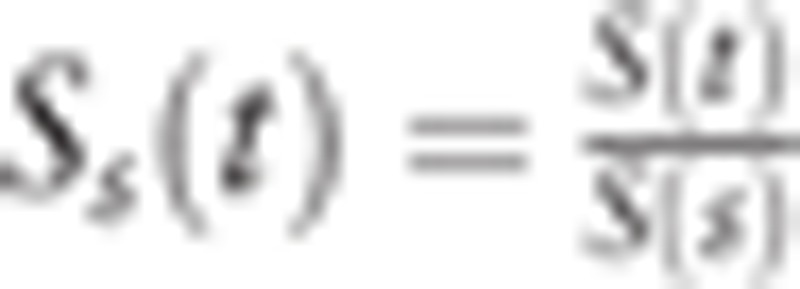 of which detectable cases at age s would live until the onset of clinical incidence at age t (sojourn time: t − s). Here we defined the size of the population at age s as ns (s = 0,1,…,t), which is constant by year (steady state). We obtain
  . We also expressed clinical incident cases ms at age s in a year who become detectable at s, survive through the time interval t − s, and are found as clinical incident cases at t. In this situation, the incidence rate I(t) by year unit, is
  . Here, we consider the probability that detectable incident cases are alive until clinical detection, ms=Ws(t) × (ns × J(s)f(t − s)), where Ws(t) is the survival probability of detectable incident cases at age s until the age of clinical detection t. So we obtain
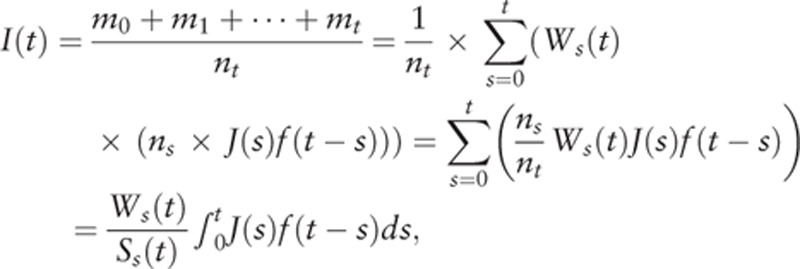 |
which is an extended DW model in the continuous variable version of s.
For thyroid cancer, it is unlikely that a detectable incident case would die without diagnosis. Here we adopted Ss(t) as a conservative estimation. We obtain:
 |
Which gives the same form as the DW model. In this model the 5-year age-specific incidence at t can be written as:
 |
for each age category (k = 1, 2,…, K).
The formulation of the estimation of the cancer-progression model
Age range of the model
First, we consider the age-range in the model to fit the data. The subjects of FHMS are 0 to 18 years of age. To build a model to examine the incidence of thyroid cancer in people aged 0 to 18, it is necessary to determine how many age categories to use in the estimation. In this problem, the age categories are from [0–4) to the highest age category, and the highest age category is determined by the estimation (the category [x,x + 4) means x ≦ age <x + 4).
We consider a candidate of the set of age categories ([0–4)—the highest age category [5(K − 1), 5K − 1), for K = 7,…,17 and 85≦ age if K = 18). We consider Ik and Rk as the age-specific clinical incidence rates of the kth age-category ([5(k − 1), 5k − 1]) in the model and in the NCR data (k = 1, …K), respectively. Here, the parameters are (K,c,λ,μ,σ2).
Estimation procedure of minimizing the weighted RMSE
The estimators of the parameters (Κ, c, λ, μ, σ2) were obtained by minimizing the weighted RMSE between the age-specific incidence rates of Ik and Rk,
 |
where 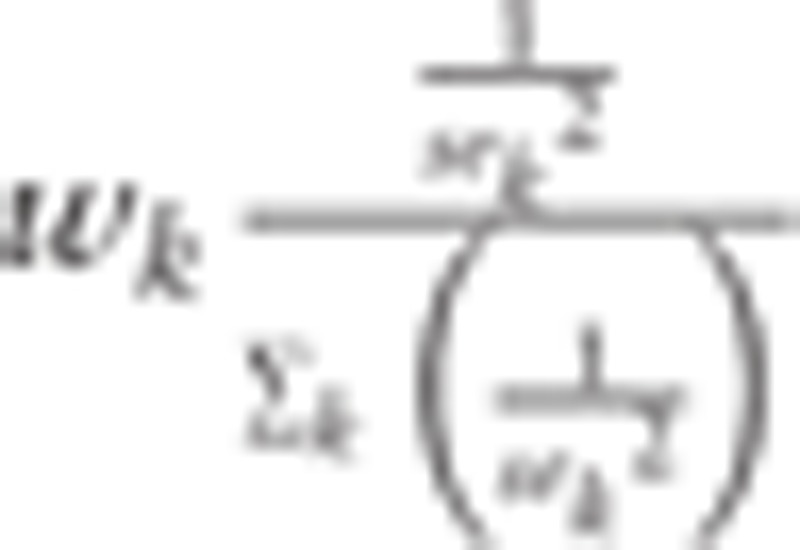 ,
,  , and nk age-specific population in the category of
  . Here, Ik is from the model with parameters, but Rk is from the actual data.
In the neighborhood of the minimum point, the RMSE function gave similar values, which would show almost flat structure near the minimum. In this situation, it is difficult to seek the minimum point in a rigorous way. We therefore set the lattice points in the parameters being sought, which were the age categories, k = 1, …, 18, μ = 1,2,…, 100, σ2 = 0.20, 0.21, …, 0.80, λ = 0,0.001,…,0.030, and the highest age categories from [30–34) to 85+. The value c is uniquely calculated if the other 3 parameters (μ,σ2,λ) are estimated.
Footnotes
Abbreviations: FHMS = Fukushima Health Management Survey, FNAC = fine-needle aspiration cytology, NCR = National Cancer Registry, RMSE = Root Mean Square Error.
The design and conduct of the study were supported by the National Health Fund for Children and Adults Affected by the Nuclear Incident.
The authors report no conflicts of interest.
References
- [1].Yasumura S, Hosoya M, Yamashita S, et al. Study protocol for the Fukushima Health Management Survey. J Epidemiol 2012;22:375–83. [DOI] [PMC free article] [PubMed] [Google Scholar]
- [2].Suzuki S, Yamashita S, Fukushima T, et al. The protocol and preliminary baseline survey results of the thyroid ultrasound examination in Fukushima [rapid communication]. Endocr J 2016;63:315–21. [DOI] [PubMed] [Google Scholar]
- [3].Suzuki S, Suzuki S, Fukushima T, et al. Comprehensive survey results of childhood thyroid ultrasound examinations in Fukushima in the first four years after the Fukushima Daiichi Nuclear Power Plant accident. Thyroid 2016;26:843–51. [DOI] [PubMed] [Google Scholar]
- [4].Yamashita S. Adolescent thyroid cancer after the Fukushima Nuclear Power plant accident: mass screening effect or a real increase? ASCO annual meeting 2016. Available at: http://am.asco.org/adolescent-thyroid-cancer-after-fukushima-nuclear-power-plant-accident-mass-screening-effect-or-real. Accessed June 5, 2016. [Google Scholar]
- [5].Fukushima Health Management Survey G. The 23rd Prefectural Oversight Committee Meeting for Fukushima Health Management Survey. 2016. Available at: http://fmu-global.jp/fukushima-health-management-survey/#report. Accessed June 6, 2016. [Google Scholar]
- [6].UNSCEAR. Developments since the 2013 UNSCEAR reports on the levels and effects of radiation exposure due to the nuclear accident following the great East-Japan Earthquake and Tsunami. Available at: wwwunscearorg/docs/reports/2015/Fukushima_WP2015_web_enpdf2015. Accessed November 15, 2017. [Google Scholar]
- [7].Tsuda T, Tokinobu A, Yamamoto E, Suzuki E. Thyroid cancer detection by ultrasound among residents ages 18 years and younger in Fukushima, Japan: 2011 to 2014. Epidemiology 2016;27:316–22. [DOI] [PMC free article] [PubMed] [Google Scholar]
- [8].Jorgensen TJ. Re: Thyroid cancer among young people in Fukushima. Epidemiology 2016;27:e17. [DOI] [PubMed] [Google Scholar]
- [9].Korblein A. Re: Thyroid cancer among young people in Fukushima. Epidemiology 2016;27:e18–9. [DOI] [PubMed] [Google Scholar]
- [10].Shibata Y. Re: Thyroid cancer among young people in Fukushima. Epidemiology 2016;27:e19–20. [DOI] [PubMed] [Google Scholar]
- [11].Suzuki S. Re: Thyroid cancer among young people in Fukushima. Epidemiology 2016;27:e19. [DOI] [PMC free article] [PubMed] [Google Scholar]
- [12].Takahashi H, Ohira T, Yasumura S, et al. Re: Thyroid cancer among young people in Fukushima. Epidemiology 2016;27:e21. [DOI] [PMC free article] [PubMed] [Google Scholar]
- [13].Takamura N. Re: Thyroid cancer among young people in Fukushima. Epidemiology 2016;27:e18. [DOI] [PubMed] [Google Scholar]
- [14].Wakeford R, Auvinen A, Gent RN, et al. Re: Thyroid cancer among young people in Fukushima. Epidemiology 2016;27:e20–1. [DOI] [PubMed] [Google Scholar]
- [15].Ochi S, Kato S, Tsubokura M, et al. Voice from Fukushima:responsibility of epidmiologists to avoid irrational stigmatisation on children in Fukushima. Thyroid 2016;26:1332–3. [DOI] [PubMed] [Google Scholar]
- [16].Rothman KJ, Greenland S, Lash TL. Modern Epidemiology. 3rd ed.2008;Philadelphia, PA: Lippincott Williams & Wilkins, 47–48. [Google Scholar]
- [17].Katanoda K, Kamo K, Tsugane S. Quantification of the increase in thyroid cancer prevalence in Fukushima after the nuclear disaster in—a potential overdiagnosis? Jpn J Clin Oncol 2016;46:284–6. [DOI] [PMC free article] [PubMed] [Google Scholar]
- [18].Hori M, Matsuda T, Shibata A, et al. Cancer incidence and incidence rates in Japan in 2009: a study of 32 population-based cancer registries for the Monitoring of Cancer Incidence in Japan (MCIJ) project. Jpn J Clin Oncol 2015;45:884–91. [DOI] [PubMed] [Google Scholar]
- [19].Day NE, Walter SD. Simplified models of screening for chronic disease: estimation procedures from mass screening programmes. Biometrics 1984;40:1–4. [PubMed] [Google Scholar]
- [20].Michalopoulos D, Duffy SW. Estimation of overdiagnosis using short-term trends and lead time estimates uncontaminated by overdiagnosed cases: results from the Norwegian Breast Screening Programme. J Med Screen 2016;23:192–202. [DOI] [PMC free article] [PubMed] [Google Scholar]
- [21].Bastin S, Bolland MJ, Croxson MS. Role of ultrasound in the assessment of nodular thyroid disease. J Med Imaging Radiat Oncol 2009;53:177–87. [DOI] [PubMed] [Google Scholar]
- [22].Moon WJ, Jung SL, Lee JH, et al. Benign and malignant thyroid nodules: US differentiation—multicenter retrospective study. Radiology 2008;247:762–70. [DOI] [PubMed] [Google Scholar]
- [23].Papini E, Guglielmi R, Bianchini A, et al. Risk of malignancy in nonpalpable thyroid nodules: predictive value of ultrasound and color-Doppler features. J Clin Endocrinol Metab 2002;87:1941–6. [DOI] [PubMed] [Google Scholar]
- [24].Miyazaki A, Shimura H, Horiuchi R, et al. Results of ultrasonographic screening of all Ningen Dock examinees for thyroid diseases and annual changes in diameter of thyroid nodules. Ningen Dock 2010;25:789–97. (in Japanese). [Google Scholar]
- [25].Hayashida N, Imaizumi M, Shimura H, et al. Thyroid ultrasound findings in children from three Japanese prefectures: Aomori, Yamanashi and Nagasaki. PLoS One 2013;8:e83220. [DOI] [PMC free article] [PubMed] [Google Scholar] [Retracted]
- [26].Hayashida N, Imaizumi M, Shimura H, et al. Thyroid ultrasound findings in a follow-up survey of children from three Japanese prefectures: Aomori, Yamanashi, and Nagasaki. Sci Rep 2015;5:9046. [DOI] [PMC free article] [PubMed] [Google Scholar]
- [27].Matsuda A, Matsuda T, Shibata A, et al. Cancer incidence and incidence rates in Japan in 2008: a study of 25 population-based cancer registries for the Monitoring of Cancer Incidence in Japan (MCIJ) project. Jpn J Clin Oncol 2014;44:388–96. [DOI] [PubMed] [Google Scholar]
- [28].Ministry of Health Labour and Welfare. Ethical Guidelines for Medical and Health Research Involving Human Subjects, Japan. 2014. Available at: http://wwwlifesciencemextgojp/files/pdf/n1443_01pdf. Accessed June 4, 2016. [Google Scholar]
- [29].Duffy SW, Chen HH, Tabar L, et al. Estimation of mean sojourn time in breast cancer screening using a Markov chain model of both entry to and exit from the preclinical detectable phase. Stat Med 1995;14:1531–43. [DOI] [PubMed] [Google Scholar]
- [30].Laticia A, Valle, Kloos RT. The prevalence of occult medullary thyroid carcinoma at autopsy. J Clin Endocrinol Metab 2011;96:e109–13. [DOI] [PubMed] [Google Scholar]
- [31].Welch HG, Black WC. Overdiagnosis in cancer. J Natl Cancer Inst 2010;102:605–13. [DOI] [PubMed] [Google Scholar]
- [32].The Japan Thyroid Association. Guidelines for Clinical Practice for the Management of Thyroid Nodules in Japan 2013. Nankodo, 2013:59 (In Japanese). [Google Scholar]
- [33].Francis GL, Waguespack SG, Bauer AJ, et al. Management guidelines for children with thyroid nodules and differentiated thyroid cancer. Thyroid 2015;25:716–59. [DOI] [PMC free article] [PubMed] [Google Scholar]
- [34].Haugen BR, Alexander EK, Bible KC, et al. 2015 American Thyroid Association Management Guidelines for Adult patients with thyroid nodules and differentiated thyroid cancer: The American Thyroid Association Guidelines Task Force on Thyroid Nodules and Differentiated Thyroid Cancer. Thyroid 2016;26:1–33. [DOI] [PMC free article] [PubMed] [Google Scholar]
- [35].Ahn HS, Kim HJ, Welch HG. Korea's thyroid-cancer “epidemic”—screening and overdiagnosis. N Engl J Med 2014;371:1765–7. [DOI] [PubMed] [Google Scholar]


