

Abstract
We aimed to elucidate the relationship between serum liver fibrosis markers (Mac-2 binding protein glycosylation isomer (M2BPGi), FIB-4 index, aspartate aminotransferase to platelet ratio index and hyaluronic acid), and skeletal muscle mass and to investigate factors linked to skeletal muscle mass loss (SMML) in patients with chronic hepatitis C (CHC, n = 277, median age = 64 years). We defined patients with psoas muscle index [PMI, sum of bilateral psoas muscle mass calculated by manual trace method at the lumber 3 level on the computed tomography images divided by height squared (cm2/m2)] less than 6.36 cm2/m2 for male and 3.92 cm2/m2 for female as those with SMML based on the recommendations in current guidelines. Receiver operating curve (ROC) analysis was performed for predicting SMML in 4 liver fibrosis markers and parameters linked to SMML were also investigated in the univariate and multivariate analyses. In terms of liver fibrosis stages, F4 was observed in 115 patients, F3 in 67, F2 in 38, F1 in 53, and F0 in 4. The median (range) PMI for male and female were 6.198 (2.999–13.698) and 4.100 (1.691–7.052) cm2/m2, respectively. There were 72 male patients with SMML (55.4%) and 58 female patients with SMML (39.5%) (P = .0112). In both male and female, a significant inverse correlation between PMI and levels of liver fibrosis markers was observed in all liver fibrosis markers. ROC analyses for predicting SMML revealed that FIB-4 index had the highest area under the ROC (AUC = 0.712), followed by M2BPGi (AUC = 0.692). In the multivariate analysis of factors linked to SMML, gender (P = .0003), body mass index (P < .0001), FIB-4 index (P = .0039), and M2BPGi (P = .0121) were found to be significant predictors. In conclusion, liver fibrosis markers, especially FIB-4 index, can be helpful for predicting SMML in CHC patients.
Keywords: chronic hepatitis C, liver fibrosis marker, predictive ability, skeletal muscle mass loss
1. Introduction
Persistent chronic hepatitis C (CHC) virus infection is associated with liver fibrosis progression.[1–3] In our country, hepatitis C virus (HCV) infection is the leading cause of liver cirrhosis (LC), its related complications, and development of hepatocellular carcinoma (HCC).[4] The severity of liver fibrosis is the main determinant of long-term outcomes, driving both liver-related and extrahepatic complications and mortality.[5] Thus, assessing the degree of liver fibrosis correctly plays a significant role for the control of disease progression and for making the therapeutic strategies and evaluating the prognosis for patients with HCV infection.[6,7]
Skeletal muscle is considered to have a role to maintain energy metabolism and nutritional condition and the decrease of skeletal muscle mass may be a considerable impairment condition.[8,9] Although aging can cause skeletal muscle mass loss (SMML), LC is frequently associated with this muscular abnormality.[8,9] Recent studies have demonstrated the role of quantitative muscle assessment in LC patients as a useful marker for reflecting malnutrition and liver function and for predicting prognosis.[10,11] In our previous study, the prevalence of SMML as determined by bioimpedance analysis in LC patients was significantly higher than that in patients with chronic hepatitis without LC.[12] In addition, a recent study demonstrated that sarcopenia as defined by muscle mass loss and a decrease in muscle strength can be a useful predictor for the presence of minimal hepatic encephalopathy.[13]
Various serum liver fibrosis markers for predicting the degree of liver fibrosis have been proposed and validated in recent years as well as radiological assessing methods for liver fibrosis.[14–17] Of these, FIB-4 index and aspartate aminotransferase (AST) to platelet ratio index (APRI) have been most frequently used liver fibrosis markers in CHC patients.[18–22] Further, Mac-2 binding protein glycosylation isomer (M2BPGi) was recently established as a novel liver fibrosis glycobiomarker in patients with HCV-related chronic liver injury with a unique fibrosis-related glycoalteration and speedy bedside testing method.[23–25] Recent studies reported that M2BPGi level was closely associated with clinical outcomes for patients with chronic hepatitis B (CHB), CHC, autoimmune hepatitis, primary biliary cirrhosis, LC, and HCC.[23–32] In view of these reports, a hypothesis that liver fibrosis marker level is linked to the SMML in patients with chronic liver diseases can be reached. Indeed, several studies demonstrated that the prevalence of SMML presented a linear increase with the severity of fibrosis in patients with nonalcoholic fatty liver disease (NAFLD) or nonalcoholic steatohepatitis (NASH).[33–35]
However, an extensive literature search has not demonstrated the relationship between skeletal muscle mass and the liver fibrosis markers in CHC patients and these issues need to be clarified. In the current study, we aimed to elucidate the relationship between serum liver fibrosis markers (M2BPGi, FIB-4 index, APRI, and hyaluronic acid) and skeletal muscle mass and to investigate factors linked to the presence of SMML.
2. Patients and methods
2.1. Patients
Between January 2006 and July 2015, a total of 386 individuals with HCV-related liver injury with available stored sera for testing M2BPGi level were admitted to the Division of Hepatobiliary and Pancreatic disease, Department of Internal Medicine, Hyogo College of Medicine, Hyogo, Japan. In this analysis, M2BPGi was tested by using stored sera for all patients.[36] Subjects with HCV-related liver disease are defined as those with HCV antibody positive and hepatitis B surface antigen negative. All subjects underwent liver biopsy. We assessed skeletal muscle mass by employing psoas muscle index (PMI) on the computed tomography (CT) images at baseline. PMI indicates total value of bilateral psoas muscle mass calculated by manual trace method at the lumber 3 level on the CT images divided by height squared (cm2/m2). Of these 386 patients, a total of 277 patients had available data for PMI on the CT images and they were analyzed [125 patients (45.1%) received previous interferon therapy]. The remaining 109 patients received HCC screening by using ultrasonography and/or magnetic resonance imaging and they were excluded from this analysis. We examined the correlation between PMI and liver fibrosis markers (M2BPGi, FIB-4 index, APRI, and hyaluronic acid) and investigated factors linked to SMML in the univariate and multivariate analyses.
APRI score was calculated as described previously: AST level/upper limit of normal level for AST/platelet count (expressed as platelets × 109/l) × 100.[18–21] The FIB-4 index was calculated as described previously: age [years) × AST (IU/L) /platelet count (×109/L) × √alanine aminotransferase (ALT) (IU/L)].[20–22] We defined patients with PMI less than 6.36 cm2/m2 for male and 3.92 cm2/m2 for female as those with SMML based on the recommendations in current guidelines.[12]
The ethics committee meeting of our hospital approved this study protocol and our study protocol adhered to all of the regulations of the Declaration of Helsinki. Informed written consent was obtained from all subjects before liver biopsy.
2.2. Measurement of M2BPGi, HCV-RNA and HCV genotype, and liver histological findings
Serum M2BPGi level was measured as described previously utilizing stored serum samples collected at baseline and it was tested according to a lectin-antibody sandwich immunoassay using the fully automatic immunoanalyzer, HISCL-2000i (Sysmex Co., Hyogo, Japan).[23–25] HCV-RNA concentrations were measured as described previously.[37] HCV genotype was determined by using an HCV Genotype Primer Kit (Institute of Immunology, Tokyo, Japan). Our liver biopsy protocols were explained in our previous study and the degree of liver fibrosis and inflammation was determined as described elsewhere.[38]
2.3. Statistical analysis
Receiver operating characteristic curve (ROC) analysis was performed for calculating the area under the ROC (AUC) for serum M2BPGi, FIB-4 index, APRI, and hyaluronic acid for selecting the optimal cutoff value that maximized the sum of sensitivity and specificity for the presence of SMML. In continuous parameters, the statistical analysis between groups was performed using Student t test, Mann–Whitney U test, or Spearman rank correlation coefficient rs as appropriate. Parameters with P value < .05 in the univariate analysis were entered into the multivariate analysis utilizing the logistic regression analysis. P values of less than .05 were considered to suggest significance. Data are presented as median value (range) unless otherwise mentioned. Statistical analysis was performed with the JMP 11 (SAS Institute Inc., Cary, NC).
3. Results
3.1. Baseline characteristics
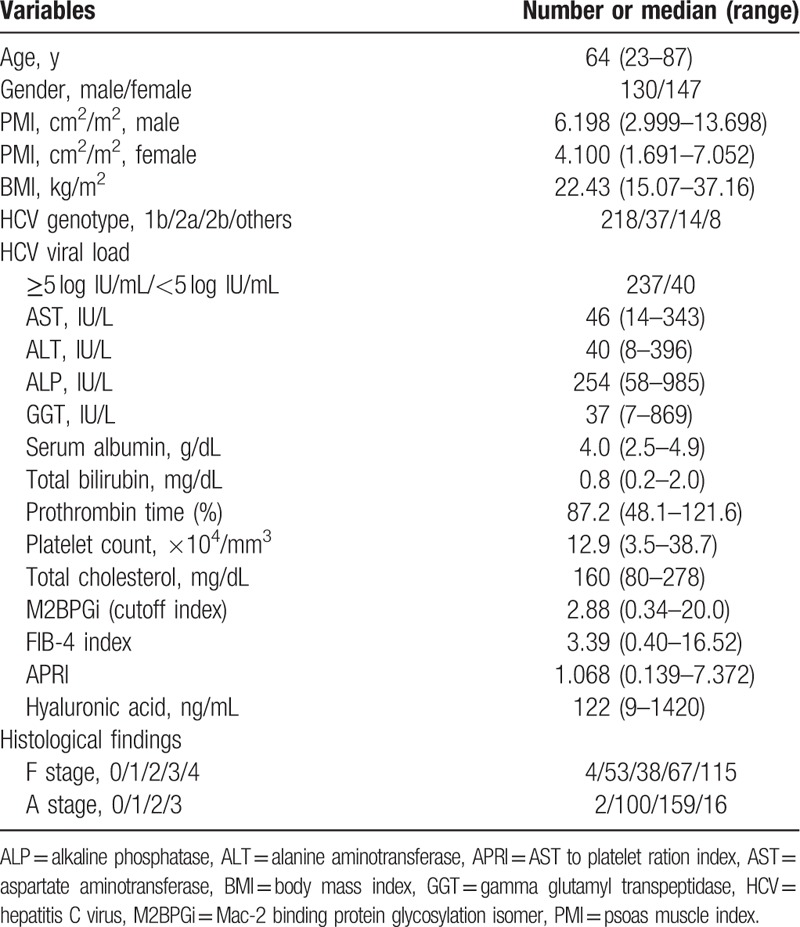
The baseline characteristics of the analyzed subjects (n = 277) are summarized in Table 1. There are 130 males and 147 females with the median (range) age of 64 (23–87) years. In terms of liver fibrosis stages, F4 was observed in 115 patients, F3 in 67, F2 in 38, F1 in 53, and F0 in 4. In terms of liver inflammation stages, A3 was observed in 16 patients, A2 in 159, A1 in 100, and A0 in 2. Patients were predominantly HCV genotype 1b (78.7%, 218/277) and higher HCV viral load of ≥5 log IU/mL (85.6%, 237/277). The median (range) PMI for male and female were 6.198 (2.999–13.698) and 4.100 (1.691–7.052) cm2/m2, respectively. In this analysis, there were 72 male patients with SMML (55.4%) and 58 female patients with SMML (39.5%) (P = .0112).
Table 1.
Baseline characteristics (n = 277).
3.2. The prevalence of SMML according to liver fibrosis stages and inflammation stages
The median (range) PMI in male patients with F4 (n = 55) was 5.909 cm2/m2 (2.999–9.980 cm2/m2), while that in female patients with F4 (n = 60) was 3.841 cm2/m2 (1.691–7.052 cm2/m2). The median (range) PMI in male patients with F3 (n = 35) was 6.097 cm2/m2 (3.499–13.698 cm2/m2), while that in female patients with F3 (n = 32) was 4.034 cm2/m2 (2.996–6.874 cm2/m2). The median (range) PMI in male patients with F0–2 (n = 40) was 6.627 cm2/m2 (4.035–13.539 cm2/m2), while that in female patients with F0–2 (n = 55) was 4.263 cm2/m2 (1.790–6.065 cm2/m2). Thus, the stepwise decrease in PMI values was observed as the liver fibrotic stage progressed in both male and female. Prevalence of SMML in patients with F4 was significantly higher than that with F0–3 [59.13% (68/115) vs 38.27% (62/162), P = .0007] (Fig. 1A). Prevalence of SMML in patients with F3 or more was significantly higher than that with F0–2 [54.95% (100/182) vs 31.58% (30/95), P = .0002] (Fig. 1B). Prevalence of SMML in patients with F3 was significantly higher than that with F0–2 [47.76% (32/67) vs 31.58% (30/95), P = .0487] (Fig. 1C). The median (range) PMI in male patients with A2 or more (n = 84) was 6.153 cm2/m2 (2.999–11.014 cm2/m2), while that in female patients with A2 or more (n = 91) was 4.057 cm2/m2 (1.691–7.052 cm2/m2). The median (range) PMI in male patients with A0 or A1 (n = 46) was 6.334 cm2/m2 (3.664–13.698 cm2/m2), while that in female patients with A0 or A1 (n = 56) was 4.158 cm2/m2 (1.790–6.874 cm2/m2). Prevalence of SMML in patients with A2 or more was not significantly higher than that with A0 or A1, although the tendency for significance was observed [50.86% (89/175) vs 40.2% (41/102), P = .1047] (Fig. 1D).
Figure 1.
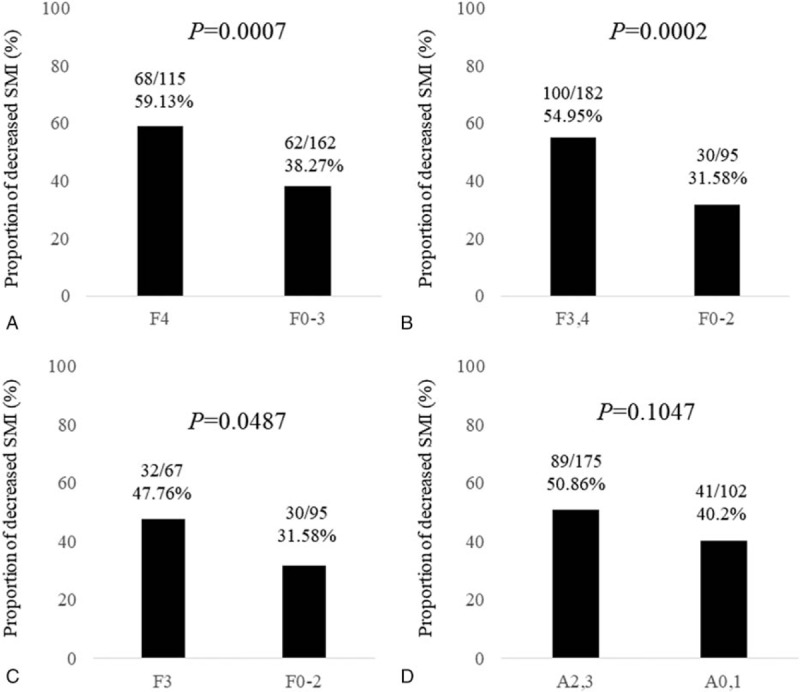
The prevalence of skeletal muscle mass loss (SMML) according to liver fibrosis stages and inflammation stages. (A) Prevalence of SMML in patients with F4 was significantly higher than that with F0–3 [59.13% (68/115) vs 38.27% (62/162), P = .0007]. (B) Prevalence of SMML in patients with F3 or more was significantly higher than that with F0–2 [54.95% (100/182) vs 31.58% (30/95), P = .0002]. (C) Prevalence of SMML in patients with F3 was significantly higher than that with F0–2 [47.76% (32/67) vs 31.58% (30/95), P = .0487]. (D) Prevalence of SMML in patients with A2 or more was not significantly higher than that with A0 or A1, although the tendency for significance was observed [50.86% (89/175) vs 40.2% (41/102), P = .1047].
3.3. ROC analysis for predicting SMML in 4 liver fibrosis markers
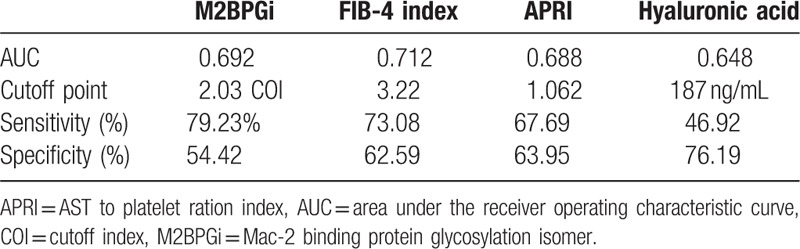
ROC analyses for predicting SMML revealed that FIB-4 index had the highest AUC (AUC = 0.712, cutoff point = 3.22, sensitivity = 73.08%, specificity = 62.59%), followed by M2BPGi (AUC = 0.692, cutoff point = 2.03 cutoff index, sensitivity = 79.23%, specificity = 54.42%) (Fig. 2A–D and Table 2).
Figure 2.
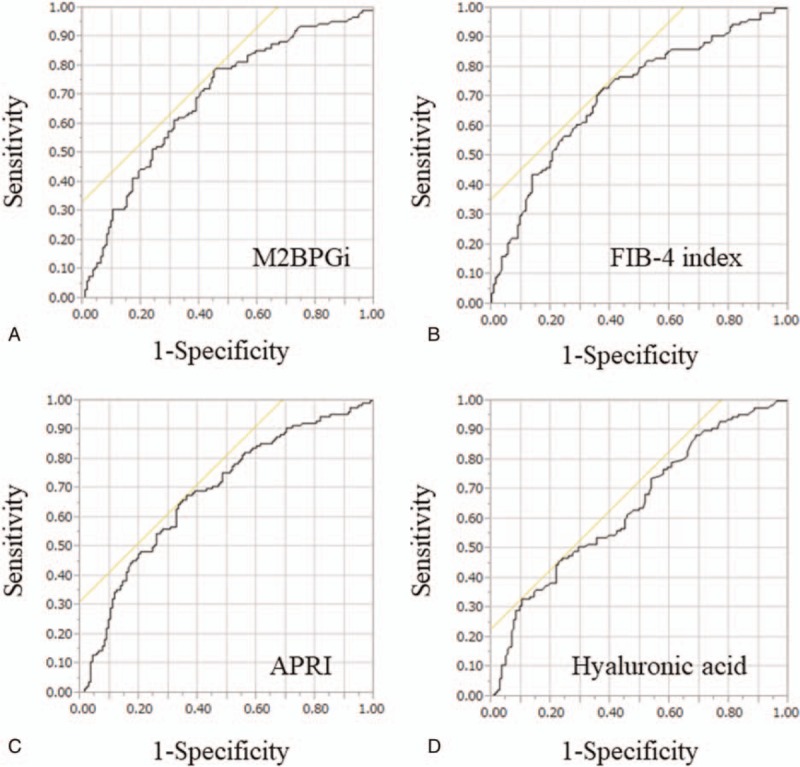
ROC analysis for predicting skeletal muscle mass loss in 4 liver fibrosis markers. (A) M2BPGi. (B) FIB-4 index. (C) APRI. (D) Hyaluronic acid.
Table 2.
ROC analysis for predicting SMML in four liver fibrosis markers.
3.4. Relationship between liver fibrosis markers and PMI for male and female
For male, in terms of relationship between liver fibrosis markers and PMI, FIB-4 index had the strongest rs value (rs = -0.4684, P < .0001), followed by M2BPGi (rs = -0.3408, P = .0001) (Fig. 3A–D). For female, in terms of relationship between liver fibrosis markers and PMI, FIB-4 index also had the strongest rs value (rs = -0.3548, P < .0001), followed by APRI (rs = -0.3329, P < .0001) and M2BPGi (rs = -0.3188, P = .0001) (Fig. 4A–D).
Figure 3.
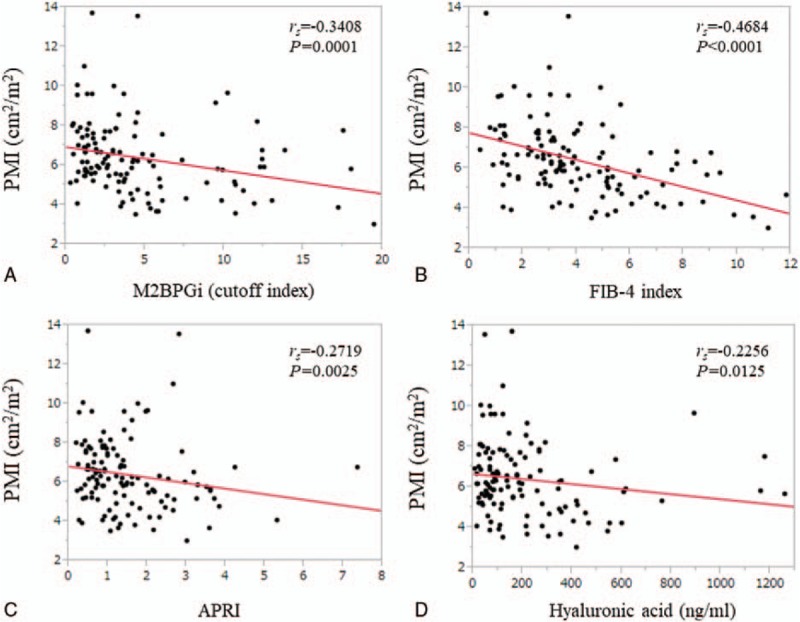
Relationship between liver fibrosis markers and PMI for male. (A) M2BPGi. (B) FIB-4 index. (C) APRI. (D) Hyaluronic acid.
Figure 4.
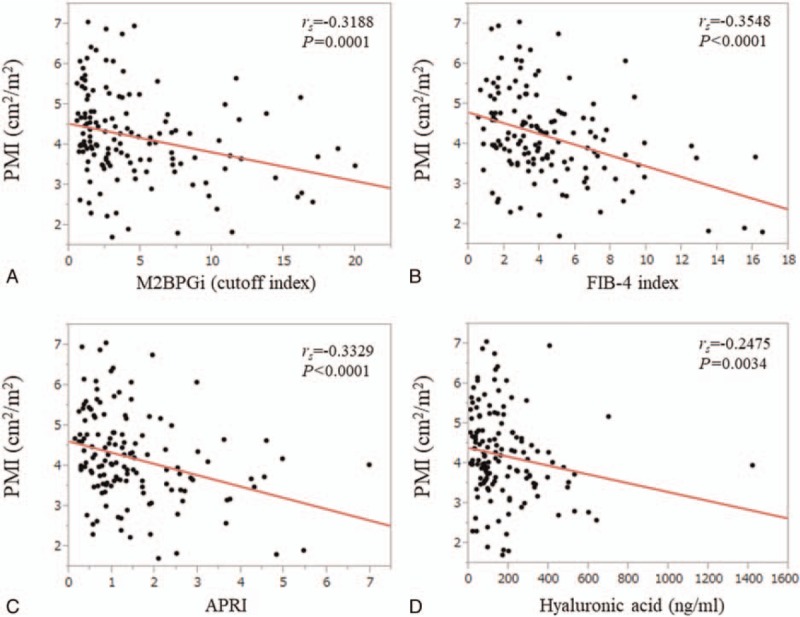
Relationship between liver fibrosis markers and PMI for female. (A) M2BPGi. (B) FIB-4 index. (C) APRI. (D) Hyaluronic acid.
3.5. Univariate and multivariate analyses of factors contributing to the presence of SMML
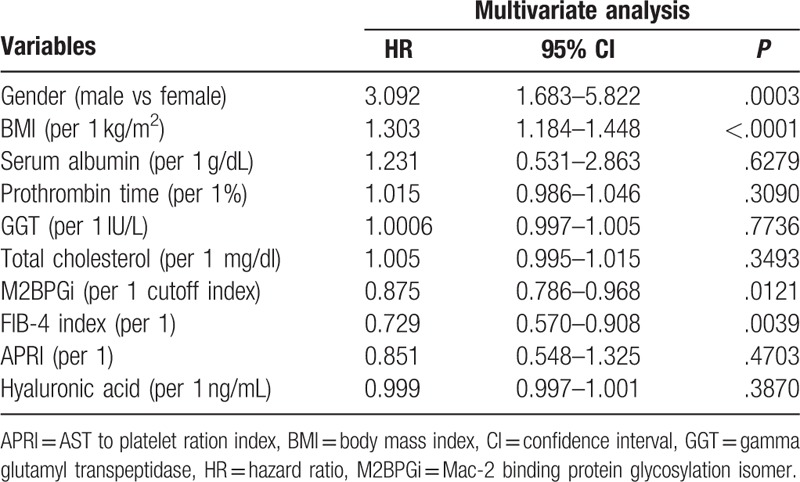
Significant variables linked to the presence of SMML in the univariate analyses are age (P = .0009); gender (P = .0112); body mass index (BMI) (P < .0001); serum albumin (P = .0009); prothrombin time (P = .0027); platelet count (P < .0001); AST (P < .0001); ALT (P = .0277); gamma glutamyl transpeptidase (P = .0054); total cholesterol (P = .0113); M2BPGi (P < .0001); FIB-4 index (P < .0001); APRI (P < .0001); and hyaluronic acid (P < .0001) (Table 3). As FIB-4 index includes age, platelet count, AST, and ALT, they were not entered into the multivariate analysis to avoid the effect of colinearity. The hazard ratios and 95% confidence intervals calculated by using multivariate analysis for the 10 significant parameters (P < .05) in the univariate analysis are presented in Table 4. Gender (P = .0003), BMI (P < .0001), M2BPGi (P = .0121), and FIB-4 index (P = .0039) were found to be independent predictors associated with the presence of SMML (Table 4).
Table 3.
Comparison of baseline characteristics between patients with SMML (n = 130) and those without SMML (n = 147).
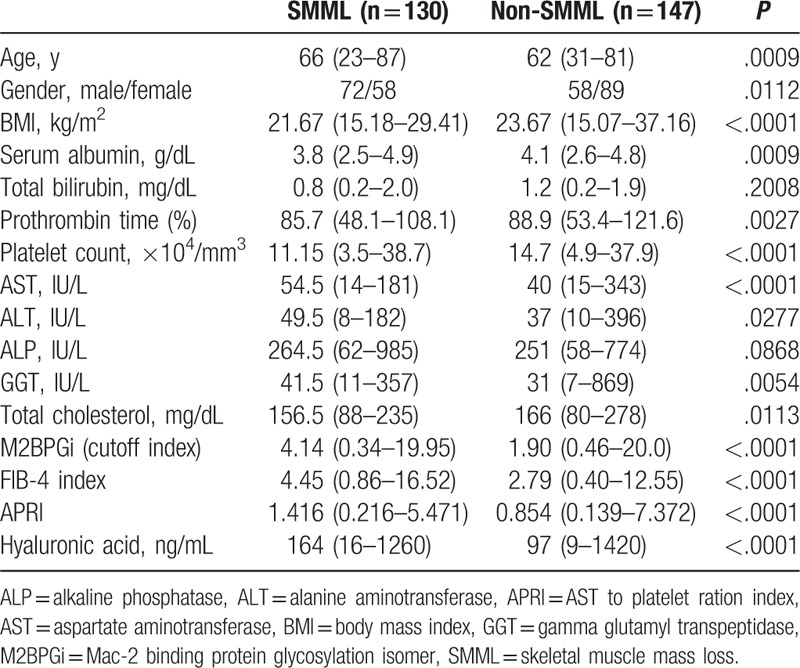
Table 4.
Multivariate analyses of factors linked to the presence of SMML.
3.6. Levels of liver fibrosis markers in LC patients stratified by the presence of SMML
In LC patients (n = 115), FIB-4 index in the SMML group was significantly higher than that in the non-SMML group (P = .0017), while other liver fibrosis markers were not (Table 5).
Table 5.
Comparison of levels of liver fibrosis markers between patients with and without skeletal muscle mass loss (SMML) according to LC status.
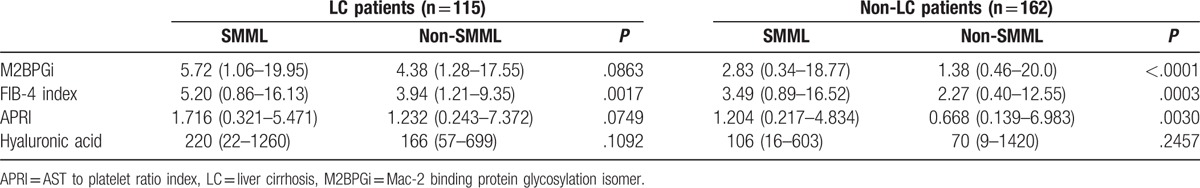
3.7. Levels of liver fibrosis markers in non-LC patients stratified by the presence of SMML
In the non-LC patients (n = 162), FIB-4 index (P = .0003), M2BPGi (P < .0001), and APRI (P = .0030) in the SMML group were significantly higher than that in the non-SMML group, while hyaluronic acid was not (Table 5).
4. Discussion
To the best of our knowledge, this is the first report linking SMML with liver damage in CHC in a Japanese population. As levels of liver fibrosis markers can differ in different etiologies of liver diseases even in the same degree of liver fibrosis, we examined the relationship between SMML and levels of liver fibrosis markers in limited patients with CHC.[39]
SMLL in liver diseases can occur due to the following mechanisms: aging-induced disruption of the balance between protein synthesis and breakdown in skeletal muscle; and protein energy malnutrition (PEM). Its incidence is high in LC patients because the liver is the primary organ for energy metabolism. Reduced glycogen storage in the cirrhotic liver can accelerate the skeletal muscle degradation by requiring skeletal muscle to supply glucose and amino acids; the imbalance of protein synthesis related to cytokine signals in the liver and muscle.[12,13,40–42] In our previous investigation, the proportion of PEM in LC patients was significantly higher than that in non-LC patients.[43] In addition, aging also can accelerate liver fibrosis progression.[44] Our current results may be associated with these characteristics in chronic liver diseases.
In our results, the stepwise decrease in PMI was observed with the liver fibrosis progression in both male and female. In particular, we found an inverse correlation between SMML and severity of hepatic fibrosis, also confirmed in non-LC patients. A recent Korean study (n = 309) showed that the prevalence of SMML was well stratified among patients without NAFLD, those with NAFLD, and those with NASH, which were in agreement with our data.[35] In addition, our multivariate analysis revealed that FIB-4 index (P = .0039) and M2BPGi (P = .0121) were found to be significant factors linked to the presence of SMML. These results denote that serum liver fibrosis markers, especially FIB-4 index, can be helpful for predicting SMML. CHC therapy has dramatically changed with the recent accessibility of direct-acting antivirals (DAAs)[7,45] and in our unpublished data, in CHC patients who achieved sustained virological response (SVR) treated by DAAs, levels of liver fibrosis markers significantly improved as compared with pretreatment data. In view of these, skeletal muscle mass can be improved in CHC patients with SVR along with the improvement in liver fibrosis markers. However, further examinations will be needed to confirm these results.
Among 4 variables, FIB-4 index had the strongest rs values in terms of relationship with PMI in both male and female. Further, FIB-4 index had the highest AUC (0.712) for predicting SMML. One possible reason for these results is that FIB-4 index includes age, which is closely associated with the development of SMML.[12,20–22,46] In our previous investigation for predicting liver carcinogenesis in CHB patients treated with entecavir, FIB-4 index rather than APRI had higher predictive ability on carcinogenesis.[47] Liver carcinogenesis can be linked to aging.[47] Although LC-related muscle mass loss can be regarded as secondary sarcopenia, SMML in CLDs can be partly attributed to aging.[12,44] As aging in Japanese CHC patients has been prominent in recent years, the clinical significance of this liver fibrosis marker may be more pronounced in the future.[44] On the contrary, M2BPGi is a novel liver fibrosis marker that was developed in Japan.[23–25] In our previous study, we demonstrated that this marker is linked to not only liver fibrosis stages but also liver inflammation activity stages and systemic inflammation as reflected by serum high C reactive protein level and serum interferon gamma inducible protein-10 level.[32,48,49] Chronic persistent inflammation can cause muscle mass depletion.[50] Prevalence of SMML in patients with A2 or more tended to be significantly higher than that with A0 or A1 and M2BPGi level in patients with A2 or more was significantly higher than that in patients with A0 or A1 in this study (P < .0001, data not shown). Our results that M2BPGi was an independent predictor for SMML may be attributed to its close relationship with both liver fibrosis and inflammation.
In our data, lower BMI was an independent adverse predictor for SMML, while in the Korean national study with large NAFLD cohort (n = 2761), the proportion of SMML was significantly higher in patients with higher BMI.[34] The average BMIs in our cohort and their cohort were 22.9 and 25.8 kg/m2, respectively. In our cohort, 66 patients (23.8%) had BMI >25 kg/m2 and only 6 patients (2.2%) had BMI >30 kg/m2. The difference of BMI in baseline characteristics between these studies as well as the difference in liver disease etiologies can cause such different results.
There are several limitations to our study. First, this is a retrospective single-center Japanese study. Thus, whether our data can be adapted to other ethnic population remains uncertain. Second, the cross-sectional nature of our study makes it impossible to interpret any cause–effect relationship; in other words, an in-depth mechanism for the independent association between the SMML and fibrotic change in the liver was not elucidated in this study. Third, liver biopsy can lead to sampling errors for evaluating the severity of liver fibrosis. Fourth, in this study, psoas muscle mass on the CT images was calculated by manual trace method, not by dedicated computer software. This can cause over- or underestimation of true muscle mass, potentially leading to bias. Finally, there were very few patients with ascites or Child–Pugh B or C in this study. When sufficient number of such patients was included into analysis, interpretation for results may be altered. Our results therefore require to be cautiously interpreted. However, our current results presented that liver fibrosis markers can be useful for predicting SMML in CHC patients. The utility of FIB-4 index and M2BPGi for SMML was confirmed in this analysis. Considering our data for optimal cutoff points for the presence of SMML, in CHC patients with FIB-4 index >3.22 and/or M2BPGi >2.03 COI, caution for the presence of SMML should be particularly exercised.
In conclusion, data for serum liver fibrosis markers can provide useful information for predicting SMML in patients with CHC.
Acknowledgment
The authors would like to thank Nozomi Kanazawa, Yoko Matsushita, and Sayaka Fujii for data collection.
Footnotes
Abbreviations: ALT = alanine aminotransferase, APRI = AST to platelet ratio index, AST = aspartate aminotransferase, AUC = area under the ROC, BMI = body mass index, CHB = chronic hepatitis B, CHC = chronic hepatitis C, CT = computed tomography, DAA = direct-acting antiviral, HCC = hepatocellular carcinoma, HCV = hepatitis C virus, LC = liver cirrhosis, M2BPGi = Mac-2 binding protein glycosylation isomer, NAFLD = nonalcoholic fatty liver disease, NASH = non-alcoholic steatohepatitis, PEM = protein energy malnutrition, PMI = psoas muscle index, ROC = receiver operating characteristic curve, SMML = skeletal muscle mass loss, SVR = sustained virological response.
The authors declare that they have no conflicts of interest.
References
- [1].Perz JF, Armstrong GL, Farrington LA, et al. The contributions of hepatitis B virus and hepatitis C virus infections to cirrhosis and primary liver cancer worldwide. J Hepatol 2006;45:529–38. [DOI] [PubMed] [Google Scholar]
- [2].Webster DP, Klenerman P, Dusheiko GM. Hepatitis C. Lancet 2015;385:1124–35. [DOI] [PMC free article] [PubMed] [Google Scholar]
- [3].Rosen HR. Clinical practice. Chronic hepatitis C infection. N Engl J Med 2011;364:2429–38. [DOI] [PubMed] [Google Scholar]
- [4].Takeda H, Takai A, Inuzuka T, et al. Genetic basis of hepatitis virus-associated hepatocellular carcinoma: linkage between infection, inflammation, and tumorigenesis. J Gastroenterol 2017;52:26–38. [DOI] [PubMed] [Google Scholar]
- [5].Westbrook RH, Dusheiko G. Natural history of hepatitis C. J Hepatol 2014;61(1 Suppl):S58–68. [DOI] [PubMed] [Google Scholar]
- [6].Yu ML. Hepatitis C treatment from “response-guided” to “resource-guided” therapy in the transition era from IFN-containing to IFN-free regimens. J Gastroenterol Hepatol 2017;32:1436–42. [DOI] [PubMed] [Google Scholar]
- [7].Majumdar A, Kitson MT, Roberts SK. Systematic review: current concepts and challenges for the direct-acting antiviral era in hepatitis C cirrhosis. Aliment Pharmacol Ther 2016;43:1276–92. [DOI] [PubMed] [Google Scholar]
- [8].Cruz-Jentoft AJ, Baeyens JP, Bauer JM, et al. Sarcopenia: European consensus on definition and diagnosis: report of the European Working Group on Sarcopenia in older people. Age Ageing 2010;39:412–23. [DOI] [PMC free article] [PubMed] [Google Scholar]
- [9].Dasarathy S. Consilience in sarcopenia of cirrhosis. J Cachexia Sarcopenia Muscle 2012;3:225–37. [DOI] [PMC free article] [PubMed] [Google Scholar]
- [10].Hanai T, Shiraki M, Nishimura K, et al. Sarcopenia impairs prognosis of patients with liver cirrhosis. Nutrition 2015;31:193–9. [DOI] [PubMed] [Google Scholar]
- [11].Durand F, Buyse S, Francoz C, et al. Prognostic value of muscle atrophy in cirrhosis using psoas muscle thickness on computed tomography. J Hepatol 2014;60:1151–7. [DOI] [PubMed] [Google Scholar]
- [12].Nishikawa H, Shiraki M, Hiramatsu A, et al. JSH guidelines for sarcopenia in liver disease (first edition): recommendation from the working group for creation of sarcopenia assessment criteria in the JSH. Hepatol Res 2016;46:951–63. [DOI] [PubMed] [Google Scholar]
- [13].Hanai T, Shiraki M, Watanabe S, et al. Sarcopenia predicts minimal hepatic encephalopathy in patients with liver cirrhosis. Hepatol Res 2017;[Epub ahead of print]. [DOI] [PubMed] [Google Scholar]
- [14].Castera L, Forns X, Alberti A. Non-invasive evaluation of liver fibrosis using transient elastography. J Hepatol 2008;48:835–47. [DOI] [PubMed] [Google Scholar]
- [15].Schiavon Lde L, Narciso-Schiavon JL, de Carvalho-Filho RJ. Non-invasive diagnosis of liver fibrosis in chronic hepatitis C. World J Gastroenterol 2014;20:2854–66. [DOI] [PMC free article] [PubMed] [Google Scholar]
- [16].Bota S, Herkner H, Sporea I, et al. Meta-analysis: ARFI elastography versus transient elastography for the evaluation of liver fibrosis. Liver Int 2013;33:1138–47. [DOI] [PubMed] [Google Scholar]
- [17].Lurie Y, Webb M, Cytter-Kuint R, et al. Non-invasive diagnosis of liver fibrosis and cirrhosis. World J Gastroenterol 2015;21:11567–83. [DOI] [PMC free article] [PubMed] [Google Scholar]
- [18].Lin ZH, Xin YN, Dong QJ, et al. Performance of the aspartate aminotransferase-to-platelet ratio index for the staging of hepatitis C-related fibrosis: an updated meta-analysis. Hepatology 2011;53:726–36. [DOI] [PubMed] [Google Scholar]
- [19].Wai CT, Greenson JK, Fontana RJ, et al. A simple noninvasive index can predict both significant fibrosis and cirrhosis in patients with chronic hepatitis C. Hepatology 2003;38:518–26. [DOI] [PubMed] [Google Scholar]
- [20].Xiao G, Yang J, Yan L. Comparison of diagnostic accuracy of aspartate aminotransferase to platelet ratio index and fibrosis-4 index for detecting liver fibrosis in adult patients with chronic hepatitis B virus infection: a systemic review and meta-analysis. Hepatology 2015;61:292–302. [DOI] [PubMed] [Google Scholar]
- [21].Kim WR, Berg T, Asselah T, et al. Evaluation of APRI and FIB-4 scoring systems for non-invasive assessment of hepatic fibrosis in chronic hepatitis B patients. J Hepatol 2016;64:773–80. [DOI] [PubMed] [Google Scholar]
- [22].Sterling RK, Lissen E, Clumeck N, et al. APRICOT Clinical Investigators: development of a simple noninvasive index to predict significant fibrosis in patients with HIV/HCV coinfection. Hepatology 2006;43:1317–25. [DOI] [PubMed] [Google Scholar]
- [23].Fujiyoshi M, Kuno A, Gotoh M, et al. Hepatitis Glyco-biomarker Study Group. Clinicopathological characteristics and diagnostic performance of Wisteria floribunda agglutinin positive Mac-2-binding protein as a preoperative serum marker of liver fibrosis in hepatocellular carcinoma. J Gastroenterol 2015;50:1134–44. [DOI] [PubMed] [Google Scholar]
- [24].Toshima T, Shirabe K, Ikegami T, et al. A novel serum marker, glycosylated Wisteria floribunda agglutinin-positive Mac-2 binding protein (WFA (+)-M2BP), for assessing liver fibrosis. J Gastroenterol 2015;50:76–84.24603981 [Google Scholar]
- [25].Yamasaki K, Tateyama M, Abiru S, et al. Elevated serum levels of Wisteria floribunda agglutinin-positive human Mac-2 binding protein predict the development of hepatocellular carcinoma in hepatitis C patients. Hepatology 2014;60:1563–70. [DOI] [PMC free article] [PubMed] [Google Scholar]
- [26].Tamaki N, Kurosaki M, Kuno A, et al. Wisteria floribunda agglutinin positive human Mac-2-binding protein as a predictor of hepatocellular carcinoma development in chronic hepatitis C patients. Hepatol Res 2015;45:E82–8. [DOI] [PubMed] [Google Scholar]
- [27].Hanai T, Shiraki M, Ohnishi S, et al. Impact of serum glycosylated Wisteria floribunda agglutinin-positive Mac-2 binding protein levels on liver functional reserves and mortality in patients with liver cirrhosis. Hepatol Res 2015;45:1083–90. [DOI] [PubMed] [Google Scholar]
- [28].Umemura T, Joshita S, Sekiguchi T, et al. Serum Wisteria floribunda agglutinin-positive Mac-2-binding protein level predicts liver fibrosis and prognosis in primary biliary cirrhosis. Am J Gastroenterol 2015;110:857–64. [DOI] [PubMed] [Google Scholar]
- [29].Nishikawa H, Enomoto H, Iwata Y, et al. Clinical implication of serum WFA+ -M2BP level on hepatitis B e antigen loss or seroconversion in hepatitis B e antigen-positive patients. Hepatol Res 2016;46:1065–73. [DOI] [PubMed] [Google Scholar]
- [30].Ura K, Furusyo N, Ogawa E, et al. Serum WFA (+) -M2BP is a non-invasive liver fibrosis marker that can predict the efficacy of direct-acting anti-viral-based triple therapy for chronic hepatitis C. Aliment Pharmacol Ther 2016;43:114–24. [DOI] [PubMed] [Google Scholar]
- [31].Toyoda H, Kumada T, Tada T, et al. Serum WFA (+) -M2BP levels as a prognostic factor in patients with early hepatocellular carcinoma undergoing curative resection. Liver Int 2016;36:293–301. [DOI] [PubMed] [Google Scholar]
- [32].Nishikawa H, Enomoto H, Iwata Y, et al. Clinical significance of serum Wisteria floribunda agglutinin positive Mac-2-binding protein level and high-sensitivity C-reactive protein concentration in autoimmune hepatitis. Hepatol Res 2016;46:613–21. [DOI] [PubMed] [Google Scholar]
- [33].Petta S, Ciminnisi S, Di Marco V, et al. Sarcopenia is associated with severe liver fibrosis in patients with non-alcoholic fatty liver disease. Aliment Pharmacol Ther 2017;45:510–8. [DOI] [PubMed] [Google Scholar]
- [34].Lee YH, Kim SU, Song K, et al. Sarcopenia is associated with significant liver fibrosis independently of obesity and insulin resistance in nonalcoholic fatty liver disease: nationwide surveys (KNHANES 2008–2011). Hepatology 2016;63:776–86. [DOI] [PubMed] [Google Scholar]
- [35].Koo BK, Kim D, Joo SK, et al. Sarcopenia is an independent risk factor for non-alcoholic steatohepatitis and significant fibrosis. J Hepatol 2017;66:123–31. [DOI] [PubMed] [Google Scholar]
- [36].Nishikawa H, Takata R, Enomoto H, et al. Proposal of a predictive model for advanced fibrosis containing Wisteria floribunda agglutinin-positive Mac-2-binding protein in chronic hepatitis C. Hepatol Res 2017;47:E74–84. [DOI] [PubMed] [Google Scholar]
- [37].Nishikawa H, Enomoto H, Nasu A, et al. Clinical significance of pretreatment serum interferon-gamma-inducible protein 10 concentrations in chronic hepatitis C patients treated with telaprevir-based triple therapy. Hepatol Res 2014;44:E397–407. [DOI] [PubMed] [Google Scholar]
- [38].Intraobserver and interobserver variations in liver biopsy interpretation in patients with chronic hepatitis C. The French METAVIR Cooperative Study Group. Hepatology 1994;20:15–20. [PubMed] [Google Scholar]
- [39].Nishikawa H, Enomoto H, Iwata Y, et al. Serum Wisteria floribunda agglutinin-positive Mac-2-binding protein for patients with chronic hepatitis B and C: a comparative study. J Viral Hepat 2016;23:977–84. [DOI] [PubMed] [Google Scholar]
- [40].Thompson DD. Aging and sarcopenia. J Musculoskelet Neuronal Interact 2007;7:344–5. [PubMed] [Google Scholar]
- [41].Moriwaki H, Miwa Y, Tajika M, et al. Branched-chain amino acids as a protein- and energy-source in liver cirrhosis. Biochem Biophys Res Commun 2004;313:405–9. [DOI] [PubMed] [Google Scholar]
- [42].Nishikawa H, Enomoto H, Ishii A, et al. Elevated serum myostatin level is associated with worse survival in patients with liver cirrhosis. J Cachexia Sarcopenia Muscle 2017;[Epub ahead of print]. [DOI] [PMC free article] [PubMed] [Google Scholar]
- [43].Nishikawa H, Yoh K, Enomoto H, et al. Factors associated with protein-energy malnutrition in chronic liver disease: analysis using indirect calorimetry. Medicine (Baltimore) 2016;95:e2442. [DOI] [PMC free article] [PubMed] [Google Scholar]
- [44].Asahina Y, Tsuchiya K, Tamaki N, et al. Effect of aging on risk for hepatocellular carcinoma in chronic hepatitis C virus infection. Hepatology 2010;52:518–27. [DOI] [PubMed] [Google Scholar]
- [45].van der Meer AJ, Berenguer M. Reversion of disease manifestations after HCV eradication. J Hepatol 2016;65(1 Suppl):S95–108. [DOI] [PubMed] [Google Scholar]
- [46].Dasarathy S, Merli M. Sarcopenia from mechanism to diagnosis and treatment in liver disease. J Hepatol 2016;65:1232–44. [DOI] [PMC free article] [PubMed] [Google Scholar]
- [47].Nishikawa H, Nishijima N, Enomoto H, et al. Comparison of FIB-4 index and aspartate aminotransferase to platelet ratio index on carcinogenesis in chronic hepatitis B treated with entecavir. J Cancer 2017;8:152–61. [DOI] [PMC free article] [PubMed] [Google Scholar]
- [48].Ishii A, Nishikawa H, Enomoto H, et al. Clinical implication of serum Wisteria floribunda agglutinin-positive Mac-2-binding protein in treatment naïve chronic hepatitis B. Hepatol Res 2016;[Epub ahead of print]. [DOI] [PubMed] [Google Scholar]
- [49].Nishikawa H, Enomoto H, Iwata Y, et al. Impact of serum Wisteria floribunda agglutinin positive Mac-2-binding protein and serum interferon-γ-inducible protein-10 in primary biliary cirrhosis. Hepatol Res 2016;46:575–83. [DOI] [PubMed] [Google Scholar]
- [50].Sinclair M, Gow PJ, Grossmann M, et al. Review article: sarcopenia in cirrhosis: aetiology, implications and potential therapeutic interventions. Aliment Pharmacol Ther 2016;43:765–77. [DOI] [PubMed] [Google Scholar]