

Abstract
In Alzheimer disease (AD), neuroinflammation is an important process related to the deposition of beta-amyloid plaques and the activation of microglia. The inflammatory process can occur in both the gray matter and the white matter. We evaluated glucose metabolism of the white matter in AD patients and compared the value with cognitive parameters of the patients.
Eighteen AD patients and 18 healthy subjects underwent F-18 fluorodeoxyglucose (FDG) and F-18 florbetaben positron emission tomography (PET). After segmentation of the white matter in both PET images, the specific binding ratio (SBR) of the global and regional cerebral white matter was checked. We evaluated the differences in SBR of the global and regional white matter between AD patients and healthy subjects. Then, we assessed the correlation between SBR and cognitive parameters in AD patients.
In F-18 FDG PET images, the global white matter SBR was significantly higher in AD patients than in healthy subjects. In the regional analysis, the white matter SBR was significantly higher for the frontal, temporal, and parietal areas in AD patients. In the correlation analysis with F-18 FDG PET, SBR was significantly correlated with the Global Deterioration Scale, Mini-Mental State Examination scores, and amyloid deposition.
Glucose metabolism of the white matter was significantly higher in AD patients than in healthy subjects and it was related to the scores of cognitive parameters. We suggest that F-18 FDG PET, like 18-kDa translocator protein PET, could be used as an indicator of neuroinflammation; however, further research is needed for a direct comparison between the 2 tests.
Keywords: Alzheimer disease, amyloid, F-18 FDG, neuroinflammation, PET, white matter
1. Introduction
The presence of beta-amyloid plaques and neurofibrillary tangles are the histologic hallmarks of Alzheimer disease (AD).[1,2] The accumulation of these abnormal proteins induces activation of the microglial cells which are implicated in the pathologic process of AD.[3–8] Microglia accounts for 10% to 15% all of nonneuronal cells in the brain and are normally in a resting state.[9,10] Our knowledge on neuroinflammation suggests that microglial cells activated due to the deposition of beta-amyloid produce potentially neurotoxic substances that clear the abnormal proteins, leading to inflammation in the brain and the consequent neuronal damage.[3–6] Therefore, many clinical trials using nonsteroidal antiinflammatory drugs have been conducted to modulate the inflammation, although their results were mixed or inconclusive.[5,11,12] While there are some aspects that remain obscure, it is well known that neuroinflammation is a continuous process that occurs throughout the disease course of AD and that activated microglial cells play a significant role in the process.[6,7]
Recently, neuroinflammation has been evaluated using positron emission tomography (PET) with a radiotracer targeting the 18-kDa translocator protein (TSPO), formerly named the peripheral benzodiazepine receptor.[13–16] TSPO is present in modest amounts in a healthy subject, but under the neuroinflammatory state, its expression is markedly increased at the outer mitochondrial membrane of the activated microglial cell. Many preclinical and clinical studies have used TSPO PET to assess neuroinflammation and have revealed that the quantification value of TSPO PET was well correlated negatively or positively with the pathologic presence of activated microglia, Mini-Mental State Examination (MMSE) score, or clinical severity.[8,14,17] However, in our country, TSPO PET is not approved for human application in routine clinical practice. Thus, an alternative method is needed to visualize neuroinflammation in AD patients in the routine clinical situation, and we thought that F-18 fluorodeoxyglucose (FDG) PET could serve this purpose. F-18 FDG PET is used to assess infection or inflammation in the body because activated macrophages or neutrophils show high glucose consumption. Microglial cells are a histiocyte-like macrophage resident in the central nervous system, and increased glucose consumption also occurs in activated cellular state.[18]
Since glucose consumption in the brain correlates well with neuronal activity, F-18 FDG PET has been routinely used to evaluate neuronal function in various cerebral diseases, including dementia.[19,20] Usually the gray matter is a part of interest because high F-18 FDG uptake is seen in the gray matter of the brain. Glucose consumption in the white matter is 2.5 to 4.1 times lesser than in the gray matter.[21] Therefore, the white matter has been ignored in F-18 FDG PET imaging. In AD, significant amounts of beta-amyloid deposit in the white matter and cause neuroinflammation, thus proving that neuroinflammation occurs in the white matter as well and not only in the gray matter.[22,23] Therefore, if the white matter turns out to be a suitable site for assessing neuroinflammation using F-18 FDG PET, F-18 FDG uptake in the white matter will differ between AD patients and healthy subjects. Thus, F-18 FDG brain PET may gain prominence as an attractive tool to simultaneously measure both the neuronal activity of the gray matter and neuroinflammation of the white matter.
In this study, we measured glucose metabolism in the white matter of the brain in AD patients and healthy subjects and compared the results using F-18 FDG PET. Then, we examined whether glucose metabolism was correlated with the amounts of beta-amyloid and cognitive parameters.
2. Methods
2.1. Patients
Herein, 18 AD patients and 18 healthy controls aged 60 to 79 years were retrospectively studied. The AD patients were recruited from the dementia specialist in our hospital and were assigned a diagnosis of clinically probable AD according to the National Institute of Neurological and Communicative Disorders and Stroke—Alzheimer's Disease and Related Disorders Association criteria.[24] In the first month of enrollment, all patients underwent detailed neuropsychologic assessment, including MMSE, Clinical Dementia Rating Scale Sum of Boxes (CDR-SOB), Global Deterioration Scale (GDS), and Geriatric Depression Scale (GDepS), as well as imaging tests, including brain MRI, F-18 FDG brain PET, and F-18 florbetaben amyloid PET. We excluded patients with cerebrovascular diseases, such as white matter microvascular disease, head trauma, and stroke, and psychological disorders, such as depression or any underlying disease that could influence the neuropsychological study. Even among patients diagnosed as having clinically probable AD, those who showed negative on amyloid PET scan were excluded. For a comparative study, 18 healthy subjects who were assigned by the dementia specialist were enrolled in this study. To minimize age bias, subjects with comparable ages were enrolled. Healthy subjects did not have any dementia-related clinical symptoms, were age-matched, and underwent the same imaging and neuropsychological tests as AD patients. This study protocol and the informed consent form have been reviewed and approved by the Institutional Review Board of our hospital.
2.2. PET imaging
All PET examinations were performed using a Biograph mCT Flow PET/CT scanner (Siemens Healthcare, Knoxville, TN).
2.2.1. PET with F-18 FDG
After fasting for at least 8 hours, 5.2 MBq/kg F-18 FDG was intravenously injected in the subjects; the serum glucose level before the radiotracer injection was less than 180 mg/dL in all subjects. Thereafter, all subjects rested on a bed in a quiet room with dim light for 60 minutes, and PET/CT acquisition was started 60 minutes after the radiotracer injection. A helical CT scan was performed with a rotation time of 0.5 seconds at 120 kVp and 100 mAs, without an intravenous contrast agent. A PET scan followed immediately and was acquired for 15 minutes in the 3-dimensional mode. All images were obtained from the skull vertex to the skull base.
2.2.2. PET with F-18 florbetaben
All subjects had an intravenous injection of 300 MBq of F-18 florbetaben (Piramal Imaging, Berlin, Germany), and PET/CT acquisition was started 90 minutes after the radiotracer injection. A helical CT scan was performed with the same protocol as that of the F-18 FDG PET scan. A PET scan followed immediately and was acquired for 20 minutes in the 3-dimensional mode. All images were acquired from the skull vertex to the skull base. Both PET studies were performed on different days.
2.3. White matter segmentation and calculation
First, we used PMOD v3.7 (PMOD Technologies, Inc., Zurich, Switzerland) to segment the MRI into gray and white matter areas and created a binary image for both tissue types. The PMOD program provides templates of the human brain in the standard Montreal Neurological Institute (MNI) space and masks of gray and white matter pixels. It is recommended to use default settings to separate gray and white matter as gray matter scale 0.5 and white matter scale 0.5 in PNEURO module. However, to avoid the spillover effect at the margin between gray and white matter areas, the scales were adjusted at gray matter scale 0.3 and white matter scale 0.7, which resulted in a wider gray matter area (Fig. 1). Second, the 3-dimensional N30R83 maximum probability atlas provided by PMOD was used to label gray and white matter areas defined in the MNI space. All images included gray and white matter areas that had been spatially normalised to one of the head first supine templates in the fusion tool and could be labeled with brain anatomy by the Hammers-N30R83 atlas in the area selected in PMOD. The cerebral white matter was divided into frontal, parietal, occipital, and temporal areas according to the label of the atlas. The PET images were normalized by the number of the mean counts per pixel in the cerebellar white matter area to yield specific binding ratio (SBR). We calculated SBRs of the whole cerebral white matter and regional white matters from 2 separate PET images.
Figure 1.
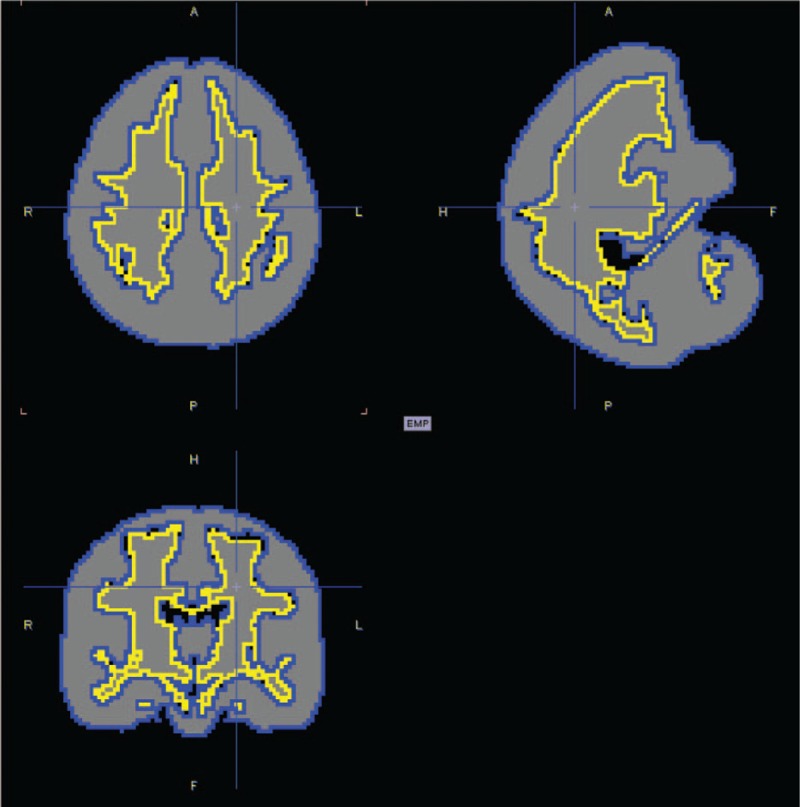
Template image for segmentation of the white matter. The area within the yellow line indicates the cerebral white matter.
2.4. Statistical analysis
In F-18 FDG and amyloid PET, differences in the SBRs of the whole cerebral and regional cerebral white matters between AD patients and healthy subjects were analyzed using the Mann–Whitney test, respectively. The SBRs on both PET scans in the whole cerebral white matter were correlated with MMSE, CDR-SOB, GDepS, and GDS score using Pearson correlation or Spearman Rho correlation, respectively. To evaluate the relation between the F-18 FDG uptake and amyloid accumulation in the white matter, correlation analysis was performed using the Pearson correlation coefficient. Statistical analyses were performed using the MedCalc Statistical Software version 16.4.3 (MedCalc Software bvba, Ostend, Belgium). Statistical significance was defined as a P-value < .05.
3. Results
3.1. Characteristics of AD patients and healthy subjects
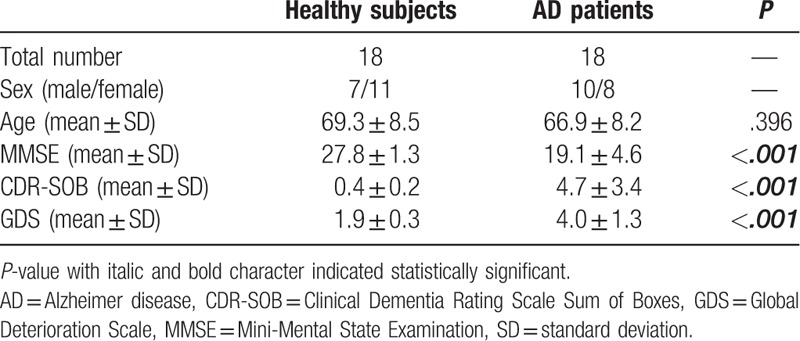
The mean age of AD patients (66.9 ± 8.2 years) and healthy subjects (69.3 ± 8.5 years) did not significantly differ (P = .396) (Table 1). The MMSE scores were 27.8 ± 1.3 and 19.1 ± 4.6, CDR-SOB scores were 0.4 ± 0.2 and 4.7 ± 3.4, and GDS scores were 1.9 ± 0.3 and 4.0 ± 1.3 in AD patients and healthy subjects, respectively. These parameters were significantly different between both groups (P < .001).
Table 1.
Patients characteristics.
3.2. Comparison of glucose metabolism and amyloid deposition in the white matter between AD patients and healthy subjects
(1) Glucose metabolism (Figs. 2 and 3)
Figure 2.
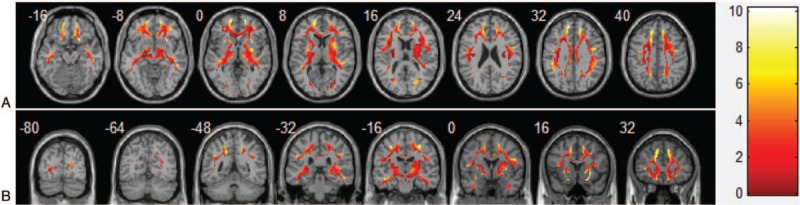
Representative image revealed increased glucose metabolism of the white matter in AD patients compared with healthy subjects (A: axial image, B: coronal image). The brighter the color, the more differences are seen, and the color bar indicates the difference in SBR. This image is generated using the xjView toolbox (http://www.alivelearn.net/xjview).
Figure 3.
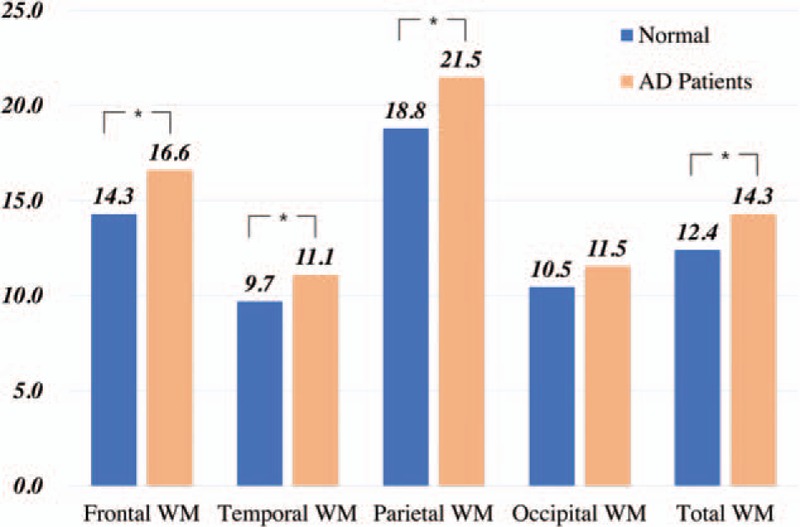
A bar chart showed the difference of glucose metabolism in the cerebral white matter between AD patients and healthy subjects. The number on the vertical axis and the bar means SBR in F-18 FDG PET. Asterisks indicate statistically significant differences (P < .05).
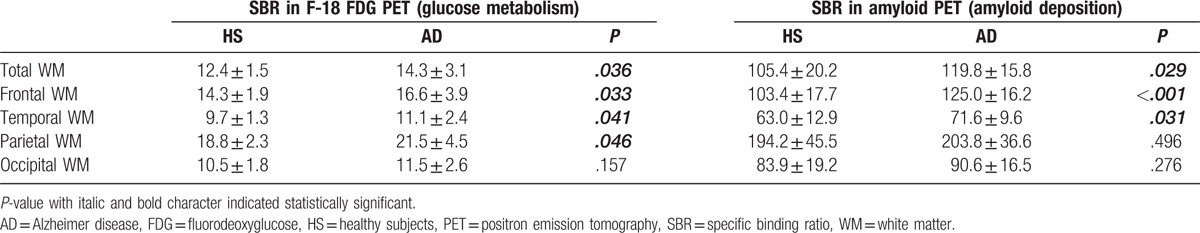
In F-18 FDG PET, SBR of the whole white matter was found to significantly differ between AD patients and healthy subjects (14.3 vs 12.4, P = .036) (Table 2). In a regional comparison, SRBs of the frontal, temporal, parietal, and occipital areas were 16.6, 11.1, 21.5, and 11.5 in AD patients, and 14.3, 9.7, 18.8, and 10.5 in healthy subjects, respectively. There were significant differences in SBR in the frontal (P = .033), temporal (P = .041), and parietal (P = .046) areas, but not in the occipital area (P = .157).
Table 2.
Glucose metabolism and amyloid deposition in the regional and whole white matter in healthy subjects and AD patients.
(2) Amyloid deposition
In F-18 florbetaben PET, SBR of the whole white matter was significantly higher in AD patients than in healthy subjects (119.8 vs 105.4, P = .029). In a regional comparison, SBRs of the frontal, temporal, parietal, and occipital areas were 125.0, 71.6, 203.8, and 90.6 in AD patients, and 103.4, 63.0, 194.2, and 83.9 in healthy subjects, respectively. SBRs significantly differed for the frontal (P < .001) and temporal (P = .031) areas but not for the parietal (P = .496) and occipital (P = .276) areas.
3.3. Relationship among glucose metabolism, amyloid deposition in the white matter, and cognitive parameters
In AD patients, glucose metabolism in the white matter had a significant negative correlation with the MMSE score (r = −0.493, P = .038) and a moderate yet significant positive correlation with the GDS score (r = 0.502, P = .034) (Table 3, Fig. 4). No significant correlation was observed between glucose metabolism and the CDR-SOB score (r = 0.436, P = .071) or GDepS score (r = −0.369, P = .215). There was no statistically significant correlation between the degree of deposition of amyloid and cognitive parameters. Glucose uptake had a significant strong positive correlation with amyloid accumulation (r = 0.954, P < .001).
Table 3.
Relationship between glucose metabolism of the white matter and cognition parameters in AD patients.
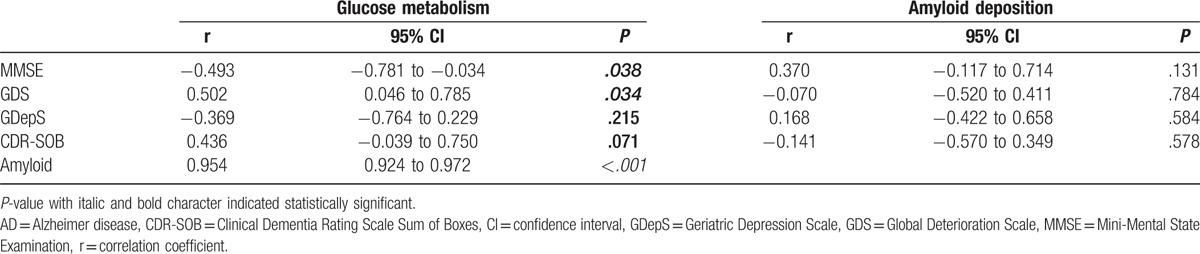
Figure 4.
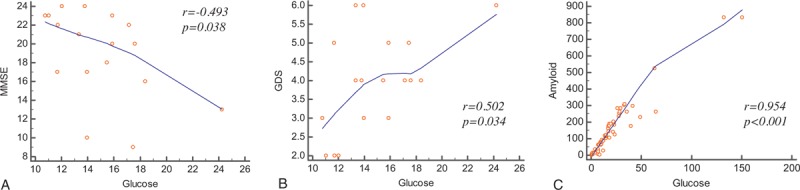
Correlation analysis showed glucose metabolism of the cerebral white matter was significantly correlated with MMSE (A), GDS (B), and amyloid deposition (C).
4. Discussion
This is, to our knowledge, the first F-18 FDG PET study that has evaluated glucose metabolism of the cerebral white matter and compared it with cognitive parameters in AD. This study showed that glucose metabolism was significantly increased in the white matter of AD patients and that the metabolic changes could be assessed using F-18 FDG PET.
In general, the cerebral white matter primarily contains myelinated axons with very few neuronal bodies and some nonneuronal cells, such as glial cells, oligodendrocytes, astrocytes, and ependymal cells, and microglia.[25,26] In AD, neuroinflammation can occur throughout the brain, including the white matter, and can affect the glial cells in the white matter. The inflammatory process induces the dysfunction of oligodendrocytes and activation or proliferation of astrocytes and microglia in AD.[27,28] In particular, microglia activated by amyloid-inducing neuroinflammation had increased glucose consumption to mediate the inflammatory process. The relation between amyloid accumulation and microglia activation was well evaluated using postmortem AD tissue sections in a previous pathologic study.[29] Another cellular study with microglia revealed that increased glucose consumption was facilitated by increased hexokinase activity and glucose transporter-1 and -4 expressions.[18] Therefore, we believed that our finding of increased glucose metabolism of the white matter was due to neuroinflammation in AD. One study has reported similar results with increased metabolic activity seen in some white matter regions.[19]
In this study, our overall comparative analysis showed that glucose metabolism of the whole white matter in AD patients is 15.3% higher than in healthy subjects. In the regional analysis, the frontal, parietal, and temporal lobes showed significantly increased glucose metabolism in AD patients. Although there was no statistical significance, glucose metabolism of the occipital lobe was also higher in AD patients. Amyloid accumulation in the whole white matter was 13.7% higher in AD patients than in healthy subjects, and the uptake pattern was similar to that of glucose metabolism. Amyloid accumulation significantly differed between the frontal and temporal lobes but not between the parietal and occipital lobes. In this study, there was a very strong correlation between glucose metabolism and amyloid deposition in the whole white matter (r = 0.954, P < .001). These results suggested that AD patients had increased glucose metabolism in the white matter and that the metabolic change was related to amyloid accumulation. Because, as mentioned earlier, neuroinflammation was thought to be the main cause of increased glucose metabolism of activated microglial cells, increased glucose metabolism in the white matter revealed by F-18 FDG PET indicated neuroinflammation. Although TSPO PET is a well-established imaging method to evaluate neuroinflammation, we did not perform that herein because its human application is not allowed in routine clinical practice in our country. However, an animal study reported a significant correlation in uptake among FDG, amyloid, and TSPO PET.[17] Based on these facts, glucose metabolism measurements of the white matter using F-18 FDG PET could be used as an alternative evaluate neuroinflammation in AD patients.
Unlike previous studies on humans, this study showed a very strong correlation between glucose metabolism and amyloid deposition. Most previous studies dealing with the relation between FDG PET and amyloid PET reported a significant inverse correlation between them. However, the main focus of those studies was the status of the gray matter; those studies were different in the target area for analysis in the brain compared with ours.[30–32] Some studies about the relation between TSPO PET and amyloid PET reported mild-to-moderate or no significant correlation (r = 0.37–0.53, P < .001).[7,8] A possible explanation is that the main area of interest in those studies was also gray matter, and histological makeup of the gray matter and the white matter differs. In the gray matter, except for beta-amyloid, a lot of neurofibrillary tangles, glial cell changes, and cellular components degraded due to neurodegeneration are prominently present.[33] Therefore, neuroinflammation could have occurred not only due to beta-amyloid but also by other factors, leading to a mild-to-moderate correlation.
Neuroinflammation may drive the progressive process in AD; this may be related with the progression and clinical severity of dementia.[5] The correlation between the degree of neuroinflammation or deposition of amyloid and the clinical severity has been described in some studies.[7,8,16,33,34] In this study, glucose metabolism of AD patients was significantly correlated with MMSE (r = −0.493, P = .038) and GDS scores (r = 0.502, P = .034); however, amyloid deposition was not correlated with any cognition parameter. These findings were similar to the results of previous studies. One study reported that MMSE scores were negatively correlated with microglial activation (r = −0.578, P = .038) but not with amyloid deposition.[8] Conversely, other studies revealed a significant correlation between amyloid deposition and dementia severity[34] and that the relationship between neuroinflammation and clinical severity was dependent on the stage of dementia.[7] These heterogeneous results were thought to be due to the heterogeneity of neuroinflammation in AD. Beta-amyloid is certainly the main cause of neuroinflammation in AD, but neurofibrillary tangles are also a well-known cause of the inflammatory process in the brain.[1,33] The accumulation of beta-amyloid, neurofibrillary tangles, and reactive gliosis can affect neuroinflammation differently depending on the clinical situation, and this may have been the reason behind discordant results in previous studies. In addition, a histopathologic study reported that clinical symptoms may take decades to appear after beta-amyloid deposition.[35] Therefore, it appears that neuroinflammation as a result from various causes rather than accumulation of beta-amyloid solely has a higher correlation with clinical severity. CDR-SOB scores were not significantly correlated with glucose metabolism (r = 0.436, P = .071), probably due to the small number of patients. Rather than conclude that there is no correlation, further studies with a larger number of patients are needed.
There were some limitations of the present study. First, this is a retrospective study with the small number of subjects included. Further studies with a larger sample size are necessary to confirm the possibility of F-18 FDG PET for visualizing neuroinflammation as postulated by us. However, we believe that this study has practical applicability. Second, we used cerebellar white matter as a reference site in the present study. In AD, beta-amyloid is known to accumulate along a certain pattern in the brain, but its accumulation and neuroinflammation can occur throughout the brain. Therefore, determining a relatively less affected or disease-free reference area was difficult. In general, many studies have used cerebellar gray matter or cerebral white matter as a reference site in F-18 FDG PET or TSPO PET analysis. Histologic evaluation from an animal study reported that reliable data were acquired in analyses using the cerebellar white matter as a reference site.[17] It that study, autoradiography revealed no specific binding of the cerebellum in TSPO PET. In addition, according to the Braak staging, cerebellar beta-amyloid deposition was found in the last stage. Based on this study, using cerebellum as a reference region was appropriate.
In conclusion, we could measure the glucose metabolism of the cerebral white matter using F-18 FDG PET. Glucose metabolism of the white matter was significantly higher in AD patients than in healthy subjects, and it had a relationship with the scores of cognitive parameters. We suggest that F-18 FDG PET be used as an indicator of neuroinflammation, like TSPO PET in AD; however, further research is needed on a direct comparison between the 2 tests in the future.
Footnotes
Abbreviations: AD = Alzheimer disease, CDR-SOB = Clinical Dementia Rating Scale Sum of Boxes, FDG = fluorodeoxyglucose, GDepS = Geriatric Depression Scale, GDS = Global Deterioration Scale, MMSE = Mini-Mental State Examination, MNI = Montreal Neurological Institute, PET = positron emission tomography, SBR = specific binding ratio, TSPO = 18-kDa translocator protein.
Funding: This work was supported by the Busan Metropolitan City research fund.
The authors have no conflicts of interest to disclose.
References
- [1].Querfurth HW, LaFerla FM. Alzheimer's disease. N Engl J Med 2010;362:329–44. [DOI] [PubMed] [Google Scholar]
- [2].Buckner RL, Snyder AZ, Shannon BJ, et al. Molecular, structural, and functional characterization of Alzheimer's disease: evidence for a relationship between default activity, amyloid, and memory. J Neurosci 2005;25:7709–17. [DOI] [PMC free article] [PubMed] [Google Scholar]
- [3].Eikelenboom P, Bate C, Van Gool WA, et al. Neuroinflammation in Alzheimer's disease and prion disease. Glia 2002;40:232–9. [DOI] [PubMed] [Google Scholar]
- [4].Amor S, Puentes F, Baker D, et al. Inflammation in neurodegenerative diseases. Immunology 2010;129:154–69. [DOI] [PMC free article] [PubMed] [Google Scholar]
- [5].Heneka MT, Carson MJ, El Khoury J, et al. Neuroinflammation in Alzheimer's disease. Lancet Neurol 2015;14:388–405. [DOI] [PMC free article] [PubMed] [Google Scholar]
- [6].Calsolaro V, Edison P. Neuroinflammation in Alzheimer's disease: current evidence and future directions. Alzheimers Dement 2016;12:719–32. [DOI] [PubMed] [Google Scholar]
- [7].Fan Z, Brooks DJ, Okello A, et al. An early and late peak in microglial activation in Alzheimer's disease trajectory. Brain 2017;140:792–803. [DOI] [PMC free article] [PubMed] [Google Scholar]
- [8].Edison P, Archer HA, Gerhard A, et al. Microglia, amyloid, and cognition in Alzheimer's disease: an [11C](R)PK11195-PET and [11C]PIB-PET study. Neurobiol Dis 2008;32:412–9. [DOI] [PubMed] [Google Scholar]
- [9].Kreutzberg GW. Microglia: a sensor for pathological events in the CNS. Trends Neurosci 1996;19:312–8. [DOI] [PubMed] [Google Scholar]
- [10].Edison P, Ahmed I, Fan Z, et al. Microglia, amyloid, and glucose metabolism in Parkinson's disease with and without dementia. Neuropsychopharmacology 2013;38:938–49. [DOI] [PMC free article] [PubMed] [Google Scholar]
- [11].Jaturapatporn D, Isaac MG, McCleery J, et al. Aspirin, steroidal and non-steroidal anti-inflammatory drugs for the treatment of Alzheimer's disease. Cochrane Database Syst Rev 2012;2:CD006378. [DOI] [PMC free article] [PubMed] [Google Scholar]
- [12].Wang J, Tan L, Wang HF, et al. Anti-inflammatory drugs and risk of Alzheimer's disease: an updated systematic review and meta-analysis. J Alzheimers Dis 2015;44:385–96. [DOI] [PubMed] [Google Scholar]
- [13].Varley J, Brooks DJ, Edison P. Imaging neuroinflammation in Alzheimer's disease and other dementias: recent advances and future directions. Alzheimers Dement 2015;11:1110–20. [DOI] [PubMed] [Google Scholar]
- [14].Venneti S, Lopresti BJ, Wiley CA. Molecular imaging of microglia/macrophages in the brain. Glia 2013;61:10–23. [DOI] [PMC free article] [PubMed] [Google Scholar]
- [15].VivashL, O’Brien TJ. Imaging microglial activation with TSPO PET: lighting up neurologic diseases? J Nucl Med 2016;57:165–8. [DOI] [PubMed] [Google Scholar]
- [16].Zimmer ER, Leuzy A, BenedetAL, et al. Tracking neuroinflammation in Alzheimer's disease: the role of positron emission tomography imaging. J Neuroinflammation 2014;11:120. [DOI] [PMC free article] [PubMed] [Google Scholar]
- [17].Brendel M, Probst F, Jaworska A, et al. Glial activation and glucose metabolism in a transgenic amyloid mouse model: a triple-tracer PET study. J Nucl Med 2016;57:954–60. [DOI] [PubMed] [Google Scholar]
- [18].Gimeno-Bayón J, López-López A, Rodríguez MJ, et al. Glucose pathways adaptation supports acquisition of activated microglia phenotype. J Neurosci Res 2014;92:723–31. [DOI] [PubMed] [Google Scholar]
- [19].Teune LK, Bartels AL, de Jong BM, et al. Typical cerebral metabolic patterns in neurodegenerative brain diseases. Mov Disord 2010;25:2395–404. [DOI] [PubMed] [Google Scholar]
- [20].Brown RK, Bohnen NI, Wong KK, et al. Brain PET in suspected dementia: patterns of altered FDG metabolism. Radiographics 2014;34:684–701. [DOI] [PubMed] [Google Scholar]
- [21].Berti V, Mosconi L, Pupi A. Brain: normal variations and benign findings in fluorodeoxyglucose-PET/computed tomography imaging. PET Clin 2014;9:129–40. [DOI] [PMC free article] [PubMed] [Google Scholar]
- [22].Uchihara T, Kondo H, Akiyama H, et al. White matter amyloid in Alzheimer's disease brain. Acta Neuropathol 1995;90:51–6. [DOI] [PubMed] [Google Scholar]
- [23].Collins-Praino LE, Francis YI, Griffith EY, et al. Soluble amyloid beta levels are elevated in the white matter of Alzheimer's patients, independent of cortical plaque severity. Acta Neuropathol Commun 2014;2:83. [DOI] [PMC free article] [PubMed] [Google Scholar]
- [24].McKhann GM, Knopman DS, Chertkow H, et al. The diagnosis of dementia due to Alzheimer's disease: recommendations from the National Institute on Aging-Alzheimer's Association workgroups on diagnostic guidelines for Alzheimer's disease. Alzheimers Dement 2011;7:263–9. [DOI] [PMC free article] [PubMed] [Google Scholar]
- [25].Purves D, Augustine GJ, Fitzpatrick D, et al. Neuroscience. Sinauer Associates, 3rd ed.Sunderland, MA:2004. [Google Scholar]
- [26].Sachdev PS, Zhuang L, Braidy N, et al. Is Alzheimer's a disease of the white matter? Curr Opin Psychiatry 2013;26:244–51. [DOI] [PubMed] [Google Scholar]
- [27].Cai Z, Xiao M. Oligodendrocytes and Alzheimer's disease. Int J Neurosci 2016;126:97–104. [DOI] [PubMed] [Google Scholar]
- [28].Ries M, Sastre M. Mechanisms of Aβ clearance and degradation by glial cells. Front Aging Neurosci 2016;8:160. [DOI] [PMC free article] [PubMed] [Google Scholar]
- [29].McGeer PL, McGeer EG. Local neuroinflammation and the progression of Alzheimer's disease. J Neurovirol 2002;8:529–38. [DOI] [PubMed] [Google Scholar]
- [30].Mega MS, Chu T, Mazziotta JC, et al. Mapping biochemistry to metabolism: FDG-PET and amyloid burden in Alzheimer's disease. Neuroreport 1999;10:2911–7. [DOI] [PubMed] [Google Scholar]
- [31].Fan Z, Aman Y, Ahmed I, et al. Influence of microglial activation on neuronal function in Alzheimer's and Parkinson's disease dementia. Alzheimers Dement 2015;11:608–21. [DOI] [PubMed] [Google Scholar]
- [32].Yokokura M, Mori N, Yagi S, et al. In vivo changes in microglial activation and amyloid deposits in brain regions with hypometabolism in Alzheimer's disease. Eur J Nucl Med Mol Imaging 2011;38:343–51. [DOI] [PubMed] [Google Scholar]
- [33].Serrano-Pozo A, Frosch MP, Masliah E, et al. Neuropathological alterations in Alzheimer disease. Cold Spring Harb Perspect Med 2011;1:a006189. [DOI] [PMC free article] [PubMed] [Google Scholar]
- [34].Okello A, Koivunen J, Edison P, et al. Conversion of amyloid positive and negative MCI to AD over 3 years: an 11C-PIB PET study. Neurology 2009;73:754–60. [DOI] [PMC free article] [PubMed] [Google Scholar]
- [35].Teller JK, Russo C, DeBusk LM, et al. Presence of soluble amyloid beta-peptide precedes amyloid plaque formation in Down's syndrome. Nat Med 1996;2:93–5. [DOI] [PubMed] [Google Scholar]