

This article investigates the effects of hydraulic fracturing on infant health.
Abstract
The development of hydraulic fracturing (“fracking”) is considered the biggest change to the global energy production system in the last half-century. However, several communities have banned fracking because of unresolved concerns about the impact of this process on human health. To evaluate the potential health impacts of fracking, we analyzed records of more than 1.1 million births in Pennsylvania from 2004 to 2013, comparing infants born to mothers living at different distances from active fracking sites and those born both before and after fracking was initiated at each site. We adjusted for fixed maternal determinants of infant health by comparing siblings who were and were not exposed to fracking sites in utero. We found evidence for negative health effects of in utero exposure to fracking sites within 3 km of a mother’s residence, with the largest health impacts seen for in utero exposure within 1 km of fracking sites. Negative health impacts include a greater incidence of low–birth weight babies as well as significant declines in average birth weight and in several other measures of infant health. There is little evidence for health effects at distances beyond 3 km, suggesting that health impacts of fracking are highly local. Informal estimates suggest that about 29,000 of the nearly 4 million annual U.S. births occur within 1 km of an active fracking site and that these births therefore may be at higher risk of poor birth outcomes.
INTRODUCTION
The growth in unconventional gas production involving hydraulic fracturing (“fracking”) has transformed the energy landscape, reducing energy prices, decreasing conventional air pollution by displacing coal in electricity generation, disrupting international energy trading arrangements, and increasing the prospects for energy self-sufficiency for the United States. At the same time, continuing concerns about the possible local health effects of hydraulic fracturing have led some states and communities to ban the practice altogether. The absence of a systematic evaluation of fracking’s health effects has complicated the decision process for those governments around the world who are debating whether to allow hydraulic fracturing.
Hydraulic fracturing could affect human health through several channels, including water and air pollution. In the fracking process, water and other chemicals are forced into shale rock to fracture it and allow the gas or petroleum trapped in the shale to be tapped. Whereas much of the previous research has focused on water pollution (1–3), several recent studies address the possible effects of chemicals that have been found in both “fracturing fluid” (the fluid that is forced into the shale in order to fracture it) and in air emissions near fractured gas wells (4–6). One study measured various air pollutants weekly for a year surrounding the development of a newly fractured gas well and detected nonmethane hydrocarbons, methylene chloride (a toxic solvent), and polycyclic aromatic hydrocarbons, which have been shown to affect fetal outcomes (7).
There are at least two reasons to focus particularly on infant health in probing the health effects of exposure to hydraulic fracturing. First, there is increasing evidence that the fetus is vulnerable to a range of maternal pollution exposures (8–13). Second, because the fetus is in utero for at most 9 months, it is possible to pinpoint the timing of potential exposure. This is not the case with other possible health effects, such as cancer, that develop over long periods of time. Moreover, birth data are available with precise information on mothers’ residential locations, permitting researchers to examine the effects of proximity to fracturing sites on the health of newborns.
This paper provides evidence for impacts of hydraulic fracturing on human health, based on a large-scale analysis of vital statistics records from more than 1.1 million births in Pennsylvania during the period 2004–2013. Our empirical approach compares infants born to mothers living at different distances from hydraulically fractured well sites, both before and after hydraulic fracturing was initiated at the well site. In addition, we probe the robustness of the results by adjusting the estimates for maternal fixed effects to include comparisons of siblings who were exposed to fracking with those who were not. Further, we explore the relationship between infant health outcomes and residential distance from fracturing sites, comparing birth data from mothers residing at increasing 1-km intervals from the fracturing sites to investigate whether there is a gradient in the effects of exposure.
The results of our analysis suggest that the introduction of fracking reduces health among infants born to mothers living within 3 km of a well site during pregnancy. For mothers living within 1 km, we find a 25% increase in the probability of low birth weight (birth weight < 2500 g) and significant declines in average birth weight and in an index of infant health. There are also reductions in infant health for mothers living within 1 to 3 km of a fracking site, but the estimates are about one-third to one-half of the size of those within the 0- to 1-km band. There is little evidence of health effects at further distances, suggesting that health impacts are highly local.
This paper addresses four problems that have plagued the previous literature (14–16). First, the sample size of this analysis is much larger than that used in previously published work. Second, in addition to examining low–birth weight status, which is the most commonly used measure of infant health in the literature, we use an index of infant health outcomes informed by the literature on multiple hypothesis testing (17, 18) to incorporate the many other measures of infant health that are available in the vital statistics data. Third, we test for effects at various distances of maternal residence from fracking sites, rather than imposing one arbitrary assumption about the distance where health impacts may become apparent, or about the functional form of the distance gradient.
An additional innovation is that our models control for mother fixed effects. Estimates of fracking-independent aspects of maternal health in these models are controlled by comparing the health of fracking-exposed and unexposed siblings born to the same mother. In principle, this comparative technique controls for all the unobserved time invariant characteristics of the mother such as race that could confound conventional difference-in-differences estimates (that is, before and after comparisons of places with and without fracking). However, in practice, the mother fixed effects estimates are imprecise because there are relatively few sibling pairs with an exposed and an unexposed sibling even when we are examining all Pennsylvania births.
RESULTS AND DISCUSSION
Figure 1 shows both the geographical distribution of births in Pennsylvania from 2004 to 2013 and the locations of fractured wells across the state. The greatest number of births occurs in the southeast of the state near Philadelphia, whereas fractured wells follow the state’s shale deposits along a diagonal path from the northeast to the southwest of the state. Although many areas with fracturing are lightly populated, the areas surrounding Pittsburgh have a high population density in addition to many fractured wells. Figure 2 illustrates the temporal distribution of fractured wells, showing that most new wells came online after 2009. Although the number of new wells peaked at the beginning of 2012, the amount and economic value of gas production continued to grow over our sample period.
Fig. 1. Locations of births and fractured wells in Pennsylvania.
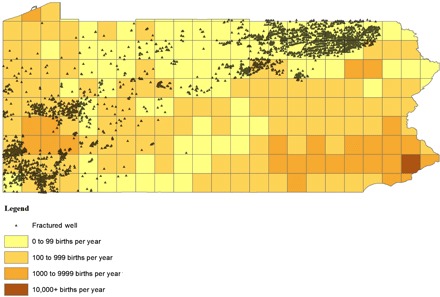
Each square displayed above is 0.25° latitude by 0.25° longitude. We use all birth certificates in Pennsylvania for 2004–2013. They include maternal address which is used to calculate average yearly births per square. Black triangles represent the exact locations of fractured wells, which we observe from the Pennsylvania Department of Environmental Protection (DEP) Internal Operator Well Inventory. These data include all oil and gas wells with a Pennsylvania DEP drilling permit and which are not currently filled in (plugged). We queried this database in November 2014. Fractured wells are those marked “unconventional” in the database. We have dropped any wells with missing American Petroleum Institute numbers, spud or permit date, or location information.
Fig. 2. Number of fractured wells and value of all drilling in Pennsylvania (2004–2013).
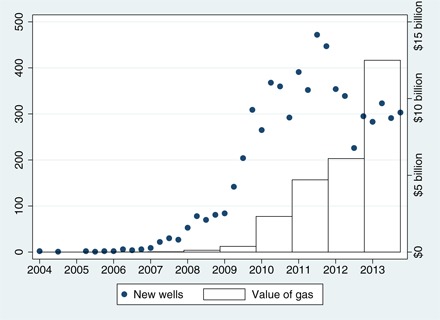
The left y axis shows total fractured wells in Pennsylvania by spud year and quarter (that is, the commencement of drilling), and the right y axis reports annual values of gas from fractured wells in Pennsylvania. X axis shows spud year and month (dates of commencement of drilling) that are recorded in the Pennsylvania DEP Internal Operator Well Inventory, which is described in the notes to Fig. 1. Annual gas production per well is recorded by the Pennsylvania DEP in its Oil and Gas Historical Production Report. We merge these data to our Internal Operator Well Inventory data by well identification number and then sum gas production to the year level. To convert production to dollars, we use gas prices from the U.S. Energy Information Administration (EIA), which reports the Henry Hub Natural Gas Spot Price (www.eia.gov/dnav/ng/hist/rngwhhdA.htm). To convert to British Thermal Units annual heating values for Pennsylvania are taken from the EIA.
Table 1 explores differences in maternal characteristics, infant characteristics, and health outcomes between mothers who were potentially exposed to fracturing and those who were not. The first two columns show variable means for mothers whose residences were less than 1 km from a location (or multiple locations) that fractured. Columns (3) and (4) report the means for births to mothers who live within 3 to 15 km of a well location. These samples are further divided into those whose infants were born before the spud date (that is, the commencement of drilling)—thus, never exposed to fracking—and those whose babies were born after the spud date. When the mother is within 1 km of multiple locations, we use the earliest spud date to align with the approach used in the regression analysis.
Table 1. Difference in means.
The data source is the universe of birth certificates in Pennsylvania (2004–2013) matched to the Pennsylvania DEP Internal Operator Well Inventory. Maternal and infant demographic indicators and health outcomes are recorded at the time of birth. “Near, 0–1 km” indicates that the mother lives within 0 to 1 km of at least one well site. “Far, 3–15 km” indicates that the mother lives 3 to 15 km from the nearest well site. Columns (5) to (7) report P values from t tests of equality of means across the different samples indicated. Column (7) tests whether (2) − (1) = (4) − (3). This quantity is referred to as the difference-in-differences, or D-in-D.
| Near, 0–1 km | Far, 3–15 km | P values | |||||
| Before | After | Before | After | (5) | (6) | (7) | |
| (1) | (2) | (3) | (4) | (1) − (2) | (3) − (4) | D-in-D | |
| Mother characteristics | |||||||
| Married | 0.68 | 0.61 | 0.62 | 0.63 | 0.00 | 0.00 | 0.00 |
| Black | 0.01 | 0.02 | 0.12 | 0.06 | 0.01 | 0.00 | 0.00 |
| Hispanic | 0.01 | 0.01 | 0.02 | 0.02 | 0.66 | 0.00 | 0.57 |
| <High school | 0.11 | 0.12 | 0.11 | 0.10 | 0.27 | 0.00 | 0.01 |
| High school | 0.28 | 0.31 | 0.26 | 0.25 | 0.02 | 0.00 | 0.00 |
| Some college | 0.32 | 0.32 | 0.28 | 0.29 | 0.89 | 0.00 | 0.43 |
| College | 0.22 | 0.17 | 0.22 | 0.23 | 0.00 | 0.00 | 0.00 |
| Advanced | 0.08 | 0.08 | 0.13 | 0.13 | 0.74 | 0.69 | 0.74 |
| <20 years old | 0.06 | 0.06 | 0.06 | 0.05 | 0.89 | 0.00 | 0.11 |
| 20–24 years old |
0.21 | 0.26 | 0.22 | 0.21 | 0.00 | 0.00 | 0.00 |
| 25–29 years old |
0.30 | 0.31 | 0.29 | 0.29 | 0.42 | 0.00 | 0.86 |
| 30–34 years old |
0.26 | 0.23 | 0.27 | 0.28 | 0.01 | 0.00 | 0.00 |
| >35 years old | 0.17 | 0.14 | 0.17 | 0.16 | 0.01 | 0.00 | 0.07 |
| Infant characteristics | |||||||
| Male | 0.50 | 0.52 | 0.51 | 0.52 | 0.24 | 0.27 | 0.32 |
| First born | 0.42 | 0.41 | 0.43 | 0.43 | 0.66 | 0.15 | 0.84 |
| Second born | 0.33 | 0.34 | 0.33 | 0.33 | 0.46 | 0.05 | 0.68 |
| Third born | 0.16 | 0.16 | 0.15 | 0.15 | 0.79 | 0.64 | 0.73 |
| Fourth and up | 0.09 | 0.09 | 0.09 | 0.09 | 0.90 | 0.51 | 0.98 |
| Health outcomes | |||||||
| Low birth weight |
0.05 | 0.07 | 0.06 | 0.06 | 0.04 | 0.00 | 0.01 |
| Birth weight | 3354.35 | 3312.81 | 3316.94 | 3331.08 | 0.01 | 0.00 | 0.00 |
| Health index | 0.05 | 0.01 | 0.01 | 0.02 | 0.01 | 0.00 | 0.00 |
| n | 4871 | 1798 | 133,107 | 78,366 | |||
The remaining columns, (5) to (7), report P values from tests that the means are equal across the pairs of columns indicated in the row headings. These tests help shed light on the credibility of different approaches to measuring the infant health effects of fracking exposure. Column (5) reports P values for t tests of the hypothesis that the means are equal within 0 to 1 km of a well location before and after the spud date. These comparisons indicate that mothers whose babies were potentially exposed to nearby fracturing in utero are younger, less likely to have been married at the time of the birth, and less educated—characteristics that might lead to worse infant health outcomes even in the absence of fracturing. Column (6) reveals that there are also significant changes in the characteristics of infants and mothers who live 3 to 15 km from a fractured well site after the spud date, relative to before. One of the most marked differences is that the fraction of births to black mothers is much lower in this distance category after fracturing begins (and the fraction of births to white mothers is correspondingly higher). This difference arises because over time, more wells were drilled near urban areas such as Pittsburgh where higher numbers of African Americans live.
A potentially valid approach to estimating the effects of fracturing is to use a difference-in-differences estimator that compares “before versus after” in the area near fracturing to “before versus after” in areas far from a fracturing site. This approach requires that all determinants of infant health except fracturing evolve identically in the areas near and far from fracturing. Column (7) provides an opportunity to gauge the credibility of this approach. It reports the P value from a test of the hypothesis that the difference between the column (1) and (2) means is equal to the difference between the column (3) and (4) means. The results show that using difference-in-differences reduces the potential for confounding fracking exposure with other determinants of infant health, but important differences in the evolution of marriage rates, race, education, and age remain. Although we control for all the observable factors in our models, these differences suggest that there may also be unobserved differences across areas in other factors that could influence infant health. This observation motivates the inclusion of mother fixed effects in the equation of outcomes as a function of potential exposure to a fractured well as shown in Eq. 2 (see Materials and Methods).
Figures 3 and 4 provide an opportunity to investigate the relationship between distances from a fracked well and measures of infant health. These figures are based on estimation of Eq. 1 (see Materials and Methods), except that “Near” is treated as a vector of indicators for each 1-km distance increment from a well site, as described above. The unaffected group is composed of births to mothers living more than 15 km away from a well site. The figure also shows the number of births in each distance category.
Fig. 3. Effect of fracturing on low–birth weight, county fixed effects.
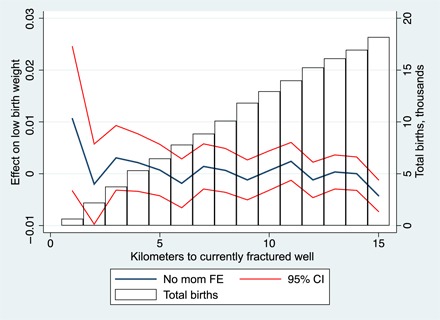
The left y axis of the graph indicates coefficients and confidence intervals (CIs) from a version of Eq. 1 in which “Near” is replaced with 15 distance indicators representing the proximity of maternal residence to well sites; the coefficients represent the in utero effect on infant health of hydraulic fracturing (that is, when conception occurs after well spud date) at 1-km intervals from the well site. The data sources for the regression are all birth certificates issued in Pennsylvania from 2004 to 2013 and the Pennsylvania DEP Internal Operator Well Inventory. We exclude births with missing values for gestation length or latitude/longitude of maternal residence. We calculate the distance between maternal residence and well sites using Vincenty’s formula. The specification includes year fixed effects (FE), month of birth FE, and county of maternal residence FE. The following demographic controls are also included: mother is married, marital status missing, maternal race and ethnicity (black, Hispanic, missing), maternal education [no high school (HS), HS diploma, some college, college, advanced degree, missing], maternal age (<20, 20 to 24, 25 to 29, 30 to 34, 35+, missing), child is male, child sex missing, and child parity (first, second, third, fourth born and higher, parity missing). Standard errors are clustered on maternal ID. The right y axis plots average yearly births at each distance from a well site.
Fig. 4. Effect of fracturing on infant health index, county fixed effects.
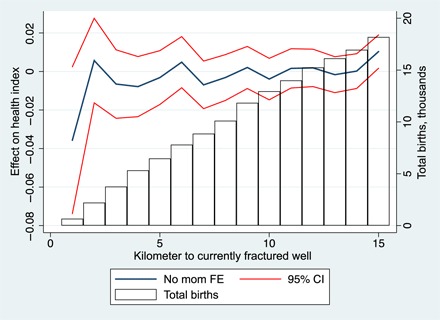
The left y axis of the graph indicates coefficients and CIs from a version of Eq. 1 in which “Near” is replaced with 15 distance indicators representing the proximity of maternal residence to well sites; the coefficients represent the in utero effect on infant health of hydraulic fracturing (that is, conception occurs after well spud date) at 1-km intervals from the well site. The data sources for the regression are the universe of birth certificates issued in Pennsylvania from 2004 to 2013 and the Pennsylvania DEP Internal Operator Well Inventory. We exclude births with missing values for gestation length or latitude/longitude of maternal residence. We calculate the distance between maternal residence and well sites using Vincenty’s formula. The infant health index ranges from 0 to 1; an increase indicates better health. The regression specification includes year FE, month of birth FE, and county of maternal residence FE. The following demographic controls are also included: mother is married, marital status missing, maternal race and ethnicity (black, Hispanic, missing), maternal education (no HS, HS diploma, some college, college, advanced degree, missing), maternal age (<20, 20 to 24, 25 to 29, 30 to 34, 35+, missing), child is male, child sex missing, and child parity (first, second, third, fourth born and higher, parity missing). Standard errors are clustered on maternal ID. The right y axis plots average yearly births at each distance from a well site.
On the basis of these figures, we conclude that any significant effects of fracking exposure occur within 3 km of a well site. It is also evident that the largest effects are concentrated within 1 km of the fracking site. For example, Fig. 3 shows that the coefficient on the indicator for maternal residence within 1 km of a site is approximately 0.01, indicating a 0.01 percentage point increase in the probability of low birth weight relative to people who live 15 km or more away from a site. The effect of living 1 to 2 km from a site is near zero, but the effect of living 2 to 3 km from a site again appears to be positive. Figure 4 suggests that the infant health index is worse at 0 to 1 km from a fracking site than at higher distances. There is some unavoidable arbitrariness in defining the cutoff at 3 versus 4 km; however, it is nevertheless evident from our data that there is little justification for including births at further distances in the potentially affected group.
Table 2 reports the results that emerge from the estimation of Eqs. 1 and 2. The first three columns use 0 to 1 km as the definition of “Near,” the next three columns use 1 to 2 km, and the last three columns use 2 to 3 km. In each case, the unaffected group is mothers who live 3 to 15 km from a site. Hence, we compare mothers at 0 to 1 km to mothers at 3 to 15 km, mothers at 1 to 2 km to mothers at 3 to 15 km, etc. In each group of three columns, the first column reports results from fitting Eq. 1 on the entire sample. In columns (2) and (3), the sample is restricted to births from mothers who live within 15 km of a well site, and these columns report on results from Eqs. 1 and 2, respectively. Each row corresponds to a different birth outcome, so that each entry in the table is a separate estimate of coefficient a2. Note that because the omitted group is held constant in the regressions (it is always the mothers who are greater than 3 km and less than 15 km from a site), the regressions are not directly comparable to Figs. 3 and 4. In Table 2, the standard errors are clustered by mother. We have also estimated alternative models clustering by county, which yields very similar patterns.
Table 2. Effect of fracturing on infant health.
Each coefficient and SE (shown in parentheses) is from a different regression and represents the effect on the given infant health outcome of in utero exposure to fracturing (when conception occurs after well spud date) within the indicated distance. The data sources for the regression are all birth certificates issued in Pennsylvania from 2004 to 2013 and the Pennsylvania DEP Internal Operator Well Inventory. We calculate the distance between maternal residence and well sites using Vincenty’s formula. The infant health index ranges from 0 to 1; an increase indicates better health. Each regression specification includes region of maternal residence*year FE, year*month of birth FE, and county of maternal residence FE. The following demographic controls are also included: mother is married, marital status missing, maternal race and ethnicity (black, Hispanic, missing), maternal education (no HS, HS diploma, some college, college, advanced degree, missing), maternal age (<20, 20 to 24, 25 to 29, 30 to 34, 35+, missing), child is male, child sex missing, and child parity (first, second, third, fourth born and higher, parity missing). Where indicated, we include a vector of maternal ID fixed effects (“mother FE”). “Under 15 km” indicates the subset of mothers living less than 15 km from the nearest well site. SEs are clustered on maternal ID. +P < 0.10; **P < 0.05; ***P < 0.01.
| Dependent variable | (Near, 0–1 km) × after | (Near, 1–2 km) × after | (Near, 2–3 km) × after | ||||||
| (1) | (2) | (3) | (4) | (5) | (6) | (7) | (8) | (9) | |
| Low birth weight (mean, 0.065) |
0.016** (0.007) |
0.015** (0.007) |
0.012 (0.014) |
0.006+ (0.004) |
0.005 (0.004) |
0.004 (0.007) |
0.009*** (0.003) |
0.008*** (0.003) |
0.007 (0.005) |
| Birth weight (mean, 3319.6) |
−38.654** (15.558) |
−36.707** (15.595) |
−13.034 (31.137) |
−3.534 (8.487) |
−2.023 (8.530) |
−10.439 (14.349) |
−7.092 (6.515) |
−5.294 (6.515) |
0.803 (10.608) |
| Health index (mean, 0.000) |
−0.054*** (0.019) |
−0.052*** (0.019) |
−0.004 (0.040) |
−0.020** (0.010) |
−0.018+ (0.011) |
−0.018 (0.020) |
−0.028*** (0.008) |
−0.025*** (0.008) |
−0.015 (0.015) |
| n | 1,086,917 | 231,578 | 231,578 | 1,102,424 | 247,085 | 247,085 | 1,117,919 | 262,580 | 262,580 |
| Mother FE | No | No | Yes | No | No | Yes | No | No | Yes |
| Under 15 km | No | Yes | Yes | No | Yes | Yes | No | Yes | Yes |
Column (1) suggests that maternal residence within 1 km of an active well site that was hydraulically fractured before conception is associated with significantly worse infant health outcomes than are more distant locations. The estimated effect on the probability of low birth weight is large (0.016), relative to the baseline mean incidence of low birth weight of 0.065. We also estimate a small but statistically significant negative effect on mean birth weight of about 39 g. It is quite common in the pollution and health literature to find a larger effect of pollution on low–birth weight incidence than on average birth weight (10–13); this finding is consistent with the possibility that any effects are concentrated among lighter, likely more vulnerable, infants. Finally, the infant health index also suggests a relatively small but statistically significant decline in health; the coefficient of −0.054 means that births near a well site where hydraulic fracturing began before conception have a −0.054 standard deviation decline in the health index. Limiting the sample to births to mothers living within 15 km, as shown in column (2), has little effect on the estimates, despite the sharp reduction in sample size.
Column (3) reports the estimates from fitting the mother fixed effect specification (that is, Eq. 2) on the 15-km sample. The inclusion of mother fixed effects is very demanding of the data, a circumstance reflected in SEs, which are about twice as large as those in columns (1) and (2); this increased SE arises because, within the 0- to 1-km range, only 594 of the 1798 potentially exposed infants [see column (2) of Table 1] have an unexposed sibling in the data. At 2 to 3 km, 10,568 infants are potentially exposed and 3538 have a sibling in the data—a better statistical situation than the 0- to 1-km cohort, but still a tiny fraction of the overall number of births. The pattern of the coefficients remains qualitatively similar, particularly for the incidence of low birth weight.
The remaining columns report on the same three specifications, except that to test the robustness of our results to different definitions of “Near,” the “Near” group is defined as those living within a 1- to 2-km radius of a well site in columns (4) to (6) and a 2- to 3-km radius from a site in columns (7) to (9). These estimates indicate negative health effects from fracking, although they are smaller than in the 0- to 1-km range. For example, the estimated effects on the incidence of low birth weight and on the infant health index are about one-third to one-half of the effect size in the 0- to 1-km category. The effects on birth weight are smaller and statistically insignificant. When maternal fixed effects are added to the models, the estimates are qualitatively similar, although generally somewhat smaller, but the increase in the SEs means that these estimates are not statistically significant by conventional criteria.
We additionally conducted a series of robustness checks. A potential concern is that the analysis is based entirely on a list of wells that were active in 2014 and that therefore does not include hydraulically fractured wells that were no longer active as of that date. These wells were not included because the well data set includes the spud date for these wells but does not report when the well became inactive. Hence, our baseline analysis could underestimate exposure if the wells were active during a woman’s pregnancy but shut down sometime after an infant’s birth. As a check, we reestimated the models using the full sample of wells, active and inactive; the results are essentially unchanged as shown in table S2.
A further issue is that we have assigned “Exposure” on the basis of whether conception occurred after the spud date. Hence, there are some women for whom drilling occurred during a pregnancy that began before the spud date, and these women are treated as not having been exposed. If these women were negatively affected, then the estimates may understate the health effects of fracturing. Conversely, if it is exposure in the earliest days of the pregnancy that matters, then the impacts will be smaller for infants who were only exposed later in the pregnancy, and adding these infants to the “exposed” sample will reduce the estimated effects. Therefore, we reestimated the models defining “Exposure” on the basis of whether the birth (rather than the conception) occurred after the spud date. Table S3 reveals that these estimates are generally slightly smaller than those in Table 2, suggesting that infants exposed early in the pregnancy may suffer the most harm; however, the sampling variability makes definitive judgments difficult.
We have also tried adding additional controls for area interacted with year to allow for secular changes in infant mortality that vary at a very local level. Specifically, because counties are of varying size, we overlaid a grid based on 0.5° of longitude and 0.5° of latitude over the state of Pennsylvania and estimated a model that included an indicator for the square in which the mother resides interacted with year of conception. These results are shown in table S4 and are qualitatively unchanged, compared to those discussed above.
In table S5, we attempt to investigate the effects of intensity of exposure in the area within 1 km of a residence. For mothers living within 1 km of a well site, the median number of well sites is 2. Hence, we alter our main specification to distinguish between the effect of having at least one active well and the effects of having more than two active wells. This is a demanding test of the data, and we are unable to reject the null hypothesis that the effects are equal for births exposed to above the median and below the median number of wells.
Finally, the probability of a low–birth weight birth is only 6.5% in this sample. Of relevance to this point, all the estimates have come from linear probability models; given the relatively low mean, it may be more appropriate to rely on nonlinear estimation approaches. Table S6 reports the marginal effects from logit estimation of Eq. 1 on the 15-km sample and finds that the results are qualitatively similar to those from the linear probability model in Table 2.
CONCLUDING REMARKS
This paper provides evidence of effects of exposure to hydraulic fracturing on infant health, using a large-scale analysis of vital statistics records from more than 1.1 million births in Pennsylvania during the 2004–2013 period. Overall, the results suggest that the introduction of fracking reduces health among infants born to mothers living within 3 km of a well site during pregnancy. We find the largest effects for mothers living within 1 km of a site—a 25% increase in the probability of a low–birth weight birth (<2500 g) and significant declines in average birth weight, as well as in an index of infant health. There are also reductions in infant health for mothers living within 1 to 3 km of a fracking site, but the estimates are about one-third to one-half of the size of those for mothers within the 0- to 1-km band. There is little evidence of health effects at further distances, suggesting that health impacts are highly local.
What do these estimated impacts imply for the affected infants? Studies based on large administrative databases have consistently shown that low birth weight is a risk factor for numerous negative outcomes, including infant mortality, attention deficit hyperactivity disorder, asthma, lower test scores, lower schooling attainment, lower earnings, and higher rates of social welfare program participation (19, 20). For example, one large-scale study of twin pairs in Norway found that a 10% difference in birth weight in their predominantly low–birth weight pairs was associated with a 1% difference in the probability of graduating from high school and a 1% difference in earnings, with outcomes all being better for the higher-weight twin (20).
Are these effects large or small relative to those found in other studies? Many other studies examine the effects of exposure to criterion air pollutants, such as carbon monoxide or nitrous oxides, rather than the specific types of hazardous air pollutants that have been noted near some fracking sites (4–7). For example, a study of the installation of EZ Pass toll plazas in New Jersey and Pennsylvania showed that EZ Pass was associated with reductions of 40% in CO and 11% in NO, which in turn reduced the incidence of low birth weight by 12% among mothers living within 2 km of a toll plaza (13). A recent study of openings and closings of industrial plants that emit hazardous air pollutants, such as benzene (one of the chemicals that has been found near fracking sites), suggested that plant operation is associated with a roughly 3% increase in the incidence of low birth weight among mothers within 1.6 km (1 mile) of the plants (12). Thus, this paper’s estimated findings of a 25% increase in the probability of a low–birth weight birth within 1 km and smaller effects at larger distances are not inconsistent with the findings that have been reported in previous studies of the effects of air pollution on fetal health.
Available data sources allow for some rough estimates of the number of births in the United States annually that are at risk from fracking. Specifically, we combined data from the National Center for Health Statistics (NCHS) on the number of births by county from July 2012 through June 2013, with data on the number of fractured wells in 2012 from HPDI, an information services company in the energy industry. The NCHS data are only available by county (whereas our Pennsylvania birth data have women’s exact addresses), but by assuming a uniform distribution of population across counties, we can estimate the number of births to women within 1 km of an active well that was hydraulically fractured in that year. Although the HPDA data do not have a fracking indicator, we infer it by using information on which wells are in tight oil or shale gas plays; hydraulic fracturing is generally required for the efficient recovery of oil and gas in these areas. These calculations suggest that as many as 65,000 infants were potentially exposed nationally in this 1-year period because their mothers live within 1 km of a well site that is likely to have been fractured.
The superior data available in Pennsylvania allow us to compare the estimated number of births exposed to the actual number of infants exposed to fracking during gestation. This comparison suggests that the assumption of a uniform distribution of births across counties leads to substantial overestimates of the number of infants born within 1 km of an active well site that was fractured; presumably, this is because fracking occurs in less populated parts of counties where there are fewer births per square kilometer. When we scale our national estimate downwards using the ratio of estimated to actual exposed births for Pennsylvania, we estimate that approximately 29,000 U.S. infants were exposed (that is, born to mothers living within 1 km of an active well that was fracked) between July 2012 and June 2013. This is about 0.7% of the infants born in the United States over that period.
A limitation of our study is that given the nature of the available data, we are constrained to focus on potential exposure to pollution (which is determined by the mother’s residential location) rather than actual exposure that could be measured with personal monitoring devices. In principle, future research could measure the types and amounts of chemicals emitted by hydraulic fracturing, the distance that those chemicals are transported under normal weather conditions, and the likely effects of those specific chemicals on fetal health and on the health of children and adults.
A second limitation of our study is that even starting with the whole population of Pennsylvania births, we end up with a relatively small sample of children who were potentially exposed to fracking; this small effective sample size limits our ability to probe the shape of the distance-exposure relationship and also limits our ability to obtain precise estimates from models with mother fixed effects.
A third caveat is that the pathway of exposure was not a subject of our study and is not known with certainty. The results of our study are consistent with the possibility that very local air pollution, perhaps from the multiple diesel generators used at well sites, from chemicals used in fracking, or even from truck traffic to and from sites, could be a potential key source of exposure. Previous research regarding human health effects of exposure to hydraulic fracturing has also identified contaminated water as a possible pathway. Although industrial activity from hydraulic fracturing and improper disposal of fracturing fluids can affect water quality, recent analyses suggest that it is not common for fracturing fluids to leak into surface water from the fractured well sites (1, 2). Tighter regulation of fluid disposal and fracturing activities may have mitigated threats to water quality; nevertheless, this potential avenue for deleterious effects on human health effects also deserves careful monitoring.
A fourth caveat is that, to the extent that there are economic benefits of fracking that accrue to women who live less than 1 km from a fracking site, our estimates could understate the specific effects of fracking exposure on human health. If, for example, women living near wells receive income from mineral rights, then the higher income per se could be expected to confer a health benefit, which might partially offset the negative effects of fracking-related pollution.
Finally, future research should focus on a richer set of outcomes, including child health at older ages and adult health. These outcomes can be difficult to track, but creative uses of administrative data may provide compelling opportunities to more thoroughly investigate the local health consequences of exposure to hydraulically fractured well sites.
MATERIALS AND METHODS
The data for this project came from two sources. First, data on all births in Pennsylvania were obtained from the Certificate of Live Births (birth certificates) from 2004 to 2013. These data include a record for every birth, and each record has information about the infant’s health at birth as well as latitude and longitude of the maternal residence and maternal characteristics such as race, education, and marital status. Because we used confidential data, our study protocol was vetted by Princeton University’s Institutional Review Board. Siblings were matched using the mother’s full maiden name, race and birth date, as well as father’s information, and social security numbers where available.
There are many possible health outcomes listed on birth certificates, several of which represent rare outcomes. In what follows, we focus on birth weight and low birth weight (birth weight less than 2500 g), which are the most commonly examined measure of fetal health outcomes in the environmental economics literature. Birth weight is commonly examined because it has been the most widely available measure, it is relatively accurately measured, and low birth weight is quite common unlike conditions such as specific congenital anomalies, for example.
We also show estimated effects on a composite infant health index that is constructed to have a mean of 0 and an SD of 1, with positive (negative) values indicating above (below) average infant health (measured in SDs). Our index is suggested by the literature on multiple hypothesis testing (17, 18). If there are k outcomes and Yk is the kth, then let μk be the mean and σk be the SD. We normalize our outcomes by subtracting the mean and dividing by the SE: Yk* = (Yk − μk)/σk. The summary index is then Y* = ΣkYk*/K. We construct two versions of this summary index, one using the full sample of births and one using the subsample of births within 15 km of a well. The index is the mean over the standardized outcomes, weighted by the inverse covariance matrix of the transformed outcomes to ensure that outcomes that are highly correlated with each other receive less weight than those that represent new information.
The index is a combination of birth weight in grams and indicators for low birth weight, prematurity (gestation less than 37 weeks), the presence of any congenital anomalies, and the presence of any other abnormal condition of the newborn. The index provides a solution to the challenges to inference from separately examining the multiple measures of infant health (that is, “multiple hypothesis” testing). The problem is that the probability that at least one estimated effect is deemed “significant” increases with the number of tests. Focusing on an index avoids this difficulty. The index is defined so that a larger value indicates more positive health.
We focus on a sample of singleton births because twins and other multiples are generally in poorer health at birth for reasons unrelated to hydraulic fracturing. After excluding births with missing information, we are left with an initial birth sample of 1,125,748 births, of which 270,410 are within 15 km of a site where a fractured well was active in 2014. From the initial sample of 1,449,427 births, we lose the following: 55,337 births that were part of a multiple birth; 25,029 births that were missing values for gestational age, birth weight, congenital anomalies, or abnormal conditions of the newborn; 226,548 births that were missing latitude and longitude; 41,789 births missing a maternal identifier; and 146 duplicate records. The sum of the missing categories above exceeds the number of cases lost because some cases are missing more than one set of variables.
The second source of data is a list of all of the fractured wells that were active in 2014 in the Pennsylvania DEP Internal Operator Well Inventory (21). Fractured wells are those marked “unconventional” in the database. For each well, we know the location and the date (month and year) that it was fractured. There are 7757 active fractured wells in our data, the vast majority of which were fractured after 2009. Below, we show that the focus on active wells, rather than all fracked wells, does not alter the results.
To match births to fractured gas wells, we computed the distance from the mother’s residence to all locations where fracturing ever took place between 2004 and 2013, regardless of whether the fracturing had yet occurred at the time of the conception. Distances were computed using Vincenty’s formula for calculating the distance between two points on a sphere. In our sample, there are 24,148 births to mothers residing less than 2 km from a site where fracturing ever occurred and 6669 living within 1 km of a site where fracturing ever occurred; of this last group, 1798 births were potentially exposed to active fracturing at some point while in utero, because the conception date occurred after the date that drilling was initiated (that is, the spud date).
We estimate several different statistical models with and without sibling comparisons. Some models are estimated using the entire sample of Pennsylvania births, whereas others focus only on births within 15 km of a well site. The latter sample excludes births in Philadelphia, for example, where there is no fracturing and birth outcomes may be changing differentially from those in the rest of the state for reasons unrelated to the proliferation of fracturing.
The first specification that we estimate is
| (1) |
where Yit is a birth outcome for mother i in year t. Countyit is a vector of zero-one indicators for the mother’s county of residence at the time of the birth, Timeit is a vector of zero-one indicators for the birth month and year (for example, October 2006), and Regional_trendit is a region-specific linear time trend based on a division of Pennsylvania into six regions (22). The vector Xit of observable maternal and child characteristics includes indicators for child gender, maternal race and ethnicity (African-American, Hispanic, missing), mother’s age (<20, 20 to 24, 25 to 29, 30 to 34, 35+, missing), mother’s education (<high school, high school, some college, college, advanced degree, missing), marital status (including an indicator for missing marital status), and child parity (first, second, third, fourth born or higher, parity missing). One reason for controlling for parity is that in our data, the exposed sibling tends to be younger than the unexposed sibling in a sibling pair, so that it is important to control for birth order effects.
To develop our measure of exposure, we first define two vectors for each birth, each of which contains a separate element/variable for each well site observed in the data. The “proximity” vector consists of indicator variables for each well site regardless of whether it had been fractured at the time of the birth. These indicators are equal to 1 if the distance between maternal residence and the given well site is within a short distance (that is, 0 to 1, 1 to 2, or 2 to 3 km in alternative specifications) and 0 otherwise. We then define an indicator, Neari, that is the result of applying the maximum operator to the full vector for birth i. That is, if there are any wells within the specified radius, then this indicator Neari will take the value 1 and 0 otherwise. This variable is a practical solution to summarizing the information on distance associated with each of the nearly 8000 wells; specifically, it is a measure of whether there is at least one well in the relevant distance category and it is a key covariate in Eq. 1.
The “timing” vector also has a separate indicator for each well that is equal to 1 if conception occurred after the spud date and 0 otherwise. The idea is that it is implausible that a well could affect infant health before it is spudded. The differences in spud dates across wells, even with relatively small geographic areas, mean that it is possible to include month-year indicators and region-specific time trends to adjust for any underlying time effects.
Having defined these two vectors, we multiply to create a new vector and apply the maximum operator to the product vector. The result is the indicator variable Exposureit, which is equal to 1 for births near any well sites for which the spud date precedes conception and is equal to 0 otherwise. Thus, after adjustment for the full set of covariates described in the preceding paragraphs, the key parameter of interest is a2, which measures whether there are changes in infant health near well sites where hydraulic fracturing started before the conception date.
One reason why birth outcomes might differ in an area before and after fracking is that the population of mothers may change with active fracturing. Previous work has shown, for example, that housing prices can be affected by industrial activity (12, 23, 24), which could be expected to change the population living nearby over time. One way to deal with this problem is to compare each mother to herself. Hence, we next estimate
| (2) |
which differs from the study of Bamberger and Oswald (4) in that it includes a constant term for each mother, ai. Because the ai absorbs the effect of any constant or time invariant characteristics (that is, race, education, etc.) of the mother, the vector X′it now includes only time-varying elements of Xit. Table S1 reveals that mothers with multiple births are more likely to be married and also more likely to have either high or low levels of education. Hence, although Eq. 2 removes concerns about confounding fracking exposure with other determinants of infant health, it is possible that the effects of exposure to fracking differ in the subpopulation of mothers with more than one child in the data.
Three additional details are worth noting. First, there was no a priori correct way to define “Near” because there is no physical law that determines the distance at which fracking-related activities potentially affect infant health. Consequently, we estimated models that explore the effect of each additional kilometer of distance from a well. These models took the same form as Eq. 1, except that “Near” was replaced with a vector of indicators for whether the mother lived 0 to 1, 1 to 2 km, 2 to 3, …, 10 to 15 km from a well. The omitted distance category was greater than 15 km. A mother’s residence can be both 0 to 1 km from one well and 2 to 3 km from another; hence, these categories are not necessarily mutually exclusive. We also calculated 15 “Exposure” variables analogously to the way these indicators were described above; the coefficients associated with these variables test for any changes in infant health in these 15 distance bands around well sites where hydraulic fracturing started before the conception date, relative to the rest of Pennsylvania. We found little evidence of an effect of fracking exposure on infant health at distances greater than 3 km, and this motivated our focus on 0 to 1, 1 to 2, and 2 to 3 km as the definitions of “Near,” as well as the use of infants born to mothers living more than 3 km away as the comparison group.
A second issue is that secular trends in infant health outcomes may differ across small geographic areas (that is, because of hospital closings or openings or local economic shocks). For this reason, the subsequent analysis reports result from the estimation of versions of Eqs. 1 and 2 that limit the sample to a 15-km radius around a well site. The advantage of this smaller sample is that mothers living 3 to 15 km away from a well site may be affected by the same economic shocks as those who live within 3 km. In contrast, this assumption seems less likely to be valid for mothers living further away, for example in Philadelphia. In addition, rather than only allowing time trends to vary by region, we also defined a 0.5° latitude × 0.5° longitude grid and controlled for a time trend for each cell in this grid. This alternate specification provides a flexible method to adjust for secular changes in infant health that are unrelated to fracking exposure.
All models were estimated using the REG and XTREG commands in STATA 14.0. The SEs in these and all our models were clustered by mother to allow for correlations between siblings in other determinants of birth outcomes.
Supplementary Material
Acknowledgments
We thank A. Bartik, M. Galperin, J. Petkun, D. Stuart, T. Vu, and H. Zhang for excellent research assistance. All authors contributed equally to the work. The authors are solely responsible for the contents of the paper. Funding: J.C. is grateful for the financial support from the John D. and Catherine T. MacArthur Foundation and for the support from Environmental Protection Agency grant #EPA G2009-STAR-B1. Author contributions: J.C. and K.M. were responsible for the collection and processing of the data. J.C., K.M., and M.G. contributed equally to the design of the study and the analysis of the data. Competing interests: M.G. holds more than $10,000 in equities and bonds of various companies, including those within the energy sector. The other authors declare that they have no competing interests. Data and materials availability: The vital statistics natality data used in this study can be obtained for similar research purposes on request from the Pennsylvania Department of Health. Other data needed to evaluate the conclusions in the paper are present in the paper and/or the Supplementary Materials. Information about fractured wells is public use and is available at: www.depreportingservices.state.pa.us/ReportServer/Pages/ReportViewer.aspx?/Oil_Gas/OG_Well_inventory.
SUPPLEMENTARY MATERIALS
Supplementary material for this article is available at http://advances.sciencemag.org/cgi/content/full/3/12/e1603021/DC1
table S1. Comparison of mothers by number of births observed in sample.
table S2. Effect of fracturing on infant health (including both inactive and active wells).
table S3. Effect of fracturing on infant health (treatment based on birth date).
table S4. Effect of fracturing on infant health (controlling for latitude/longitude grid*year controls).
table S5. Mothers with <2 well sites spudded within 1 km versus mothers with 2+ well sites spudded within 1 km.
table S6. Effect of fracturing on infant health (logit for low birth weight).
REFERENCES AND NOTES
- 1.Vidic R. D., Brantley S. L., Vandenbossche J. M., Yoxtheimer D., Abad J. D., Impact of shale gas development on regional water quality. Science 340, 1235009 (2013). [DOI] [PubMed] [Google Scholar]
- 2.Olmstead S., Muelenbachs L., Shih J., Chu Z., Krupnick A., Shale gas development impacts on surface water quality in Pennsylvania. Proc. Natl. Acad. Sci. U.S.A. 110, 4962–4967 (2013). [DOI] [PMC free article] [PubMed] [Google Scholar]
- 3.Hill E., Ma L.. Shale gas development and drinking water quality. Am. Econ. Rev. 107, 522–525 (2017). [DOI] [PMC free article] [PubMed] [Google Scholar]
- 4.Bamberger M., Oswald R. E., Impacts of gas drilling on human and animal health. New Solut. 22, 51–77 (2012). [DOI] [PubMed] [Google Scholar]
- 5.McKenzie L. M., Witter R. Z., Newman L. S., Adgate J. L., Human health risk assessment of air emissions from development of unconventional natural gas resources. Sci. Total Environ. 424, 79–87 (2012). [DOI] [PubMed] [Google Scholar]
- 6.Colborn T., Kwiatkowski C., Schultz K., Bachran M., Natural gas operations from a public health perspective. Hum. Ecol. Risk Assess. 17, 1039–1056 (2011). [Google Scholar]
- 7.Colborn T., Schultz K., Herrick L., Kwiatkowski C., An exploratory study of air quality near natural gas operations. Hum. Ecol. Risk Assess. 20, 86–105 (2014). [Google Scholar]
- 8.D. Mattison, S. Wilson, C. Coussens, D. Gilbert, The Role of Environmental Hazards in Premature Birth: Workshop Summary (National Academies Press, 2003). [PubMed] [Google Scholar]
- 9.Chay K. Y., Greenstone M., The impact of air pollution on infant mortality: Evidence from geographic variation in pollution shocks induced by a recession. Q. J. Econ. 118, 1121–1167 (2003). [Google Scholar]
- 10.Currie J., Neidell M., Air pollution and infant health: What can we learn from California’s recent experience? Q. J. Econ. 120, 1003–1030 (2005). [Google Scholar]
- 11.Currie J., Neidell M., Schmeider J., Air pollution and infant health: Lessons from New Jersey. J. Health Econ. 28, 688–703 (2009). [DOI] [PMC free article] [PubMed] [Google Scholar]
- 12.Currie J., Davis L., Greenstone M., Walker R., Environmental health risks and housing values: Evidence from 1,600 toxic plant openings and closings. Am. Econ. Rev., 105, 678–709 (2015). [DOI] [PMC free article] [PubMed] [Google Scholar]
- 13.Currie J., Walker R., Traffic congestion and infant health: Evidence from E-Z Pass. Am. Econ. J. Appl. Econ. 3, 65–90 (2011). [Google Scholar]
- 14.McKenzie L. M., Guo R., Witter R. Z., Savitz D. A., Newman L. S., Adgate J. L., Birth outcomes and maternal residential proximity to natural gas development in rural Colorado. Environ. Health Perspect. 122, 412–417 (2014). [DOI] [PMC free article] [PubMed] [Google Scholar]
- 15.Casey J. A., Savitz D. A., Rasmussen S. G., Ogburn E. L., Pollak J., Mercer D. G., Schwartz B. S., Unconventional natural gas development and birth outcomes in Pennsylvania, USA. Epidemiology 27, 163–172 (2016). [DOI] [PMC free article] [PubMed] [Google Scholar]
- 16.Stacy S. L., Brink L. L., Larkin J. C., Sadovsky Y., Goldstein B. D., Pitt B. R., Talbott E. O., Perinatal outcomes and unconventional natural gas operations in southwest Pennsylvania. PLOS ONE 10, e0126425 (2015). [DOI] [PMC free article] [PubMed] [Google Scholar]
- 17.Anderson M. L. Multiple inference and gender differences in the effects of intervention: A reevaluation of the Abecedarian, Perry preschool, and early training projects. J. Am. Stat. Assoc. 103, 1481–1495 (2008). [Google Scholar]
- 18.Kling J. R., Liebman J. B., Katz L. F., Experimental analysis of neighborhood effects. Econometrica 75, 83–119 (2007). [Google Scholar]
- 19.Oreopoulos P., Stabile M., Roos L., Walld R.. The short, medium, and long term effects of poor infant health. J. Hum. Resour. 43 88–138 (2008). [Google Scholar]
- 20.Black S. E., Devereux P. J., Salvanes K. G., From the cradle to the labor market? The effect of birth weight on adult outcomes. Q. J. Econ. 122, 409–439 (2007). [Google Scholar]
- 21.These data are available at www.depreportingservices.state.pa.us/ReportServer/Pages/ReportViewer.aspx?/Oil_Gas/OG_Well_inventory
- 22.The regions are shown here: http://pafallfestivals.com/resources/PA%20regions.jpg
- 23.Chay K., Greenstone M., Does air quality matter? Evidence from the housing market. J. Pol. Econ. 113, 376–424 (2005). [Google Scholar]
- 24.Greenstone M., Gallagher J., Does hazardous waste matter? Evidence from the housing market and the superfund program. Q. J. Econ. 123, 951–1003 (2008). [Google Scholar]
Associated Data
This section collects any data citations, data availability statements, or supplementary materials included in this article.
Supplementary Materials
Supplementary material for this article is available at http://advances.sciencemag.org/cgi/content/full/3/12/e1603021/DC1
table S1. Comparison of mothers by number of births observed in sample.
table S2. Effect of fracturing on infant health (including both inactive and active wells).
table S3. Effect of fracturing on infant health (treatment based on birth date).
table S4. Effect of fracturing on infant health (controlling for latitude/longitude grid*year controls).
table S5. Mothers with <2 well sites spudded within 1 km versus mothers with 2+ well sites spudded within 1 km.
table S6. Effect of fracturing on infant health (logit for low birth weight).