Abstract
We propose a novel, high-performance dielectrophoretic (DEP) cell-separation flow chamber with a parallel-plate channel geometry. The flow chamber, consisting of a planar electrode on the top and an interdigitated-pair electrode array at the bottom, was developed to facilitate the separation of cells by creating a nonuniform AC electric field throughout the volume of the flow chamber. The operation and performance of the device were evaluated using live and dead human epithermal breast (MCF10A) cells. The separation dynamics of the cell suspension in the flow chamber was also investigated by numerically simulating the trajectories of individual cells. A theoretical model to describe the dynamic cell behavior under the action of DEP, including dipole-dipole interparticle, viscous, and gravitational forces, was developed. The results demonstrated that the live cells traveling through the flow chamber congregated into sites where the electric field gradient was minimal, in the middle of the flow stream slightly above the centerlines of the grounded electrodes at the bottom. Meanwhile, the dead cells were trapped on the edges of the high-voltage electrodes at the bottom. Cells were thus successfully separated with a remarkably high separation ratio (∼98%) at the appropriately tuned field frequency and applied voltage. The numerically predicted behavior and spatial distribution of the cells during separation also showed good agreement with those observed experimentally.
I. INTRODUCTION
When a suspension of cells is subjected to a gradient AC electric field, the cells exhibit attractive/repulsive motions against the electrodes due to the interaction between the dipoles induced in the cells and the spatial gradient of the electric field. This is known as dielectrophoresis (DEP). Since the magnitude of the DEP force is proportional to the magnitude of the field gradient, a reduction of the electrode size and/or spacing will markedly increase the DEP force. This advantageous scaling of the DEP force with electrode geometry makes DEP very suitable for efficient cell manipulation, even with a relatively low application of AC voltage.
Meanwhile, biological cells have very different electrical properties, and therefore exhibit polarizations that are highly dependent on the strength and frequency of the applied AC electric field. Moreover, the variability in cell response to the field gradient is selective enough to separate not only cell types but also the activation states of similar cells. These are the most prominent advantages of DEP technology over existing cell-manipulation methods. Thus, the DEP is one of the most effective and widely used techniques not only for manipulating but also for separating, sorting, and identifying cells in microfluidic systems.1–14 However, significant technical challenges arise in applying DEP to clinical applications, where it is necessary to process extremely large numbers of cells with adequate separation at a sufficiently high throughput. It has not been feasible to scale most previously proposed DEP devices for cell separation of clinical specimens.
In investigating this issue, we previously proposed a simple and effective way to separate cells. We used a three-dimensional (3D) nonuniform AC electric field established in the whole volume of a parallel-plate type flow chamber to enhance the process of cell separation.15,16 In general, the ideal DEP cell-separation device aimed at clinical applications would take the best advantage of the field gradient established in the flow chamber to manipulate cells without damaging them by joule heating or high voltage. In the proposed method, the electric field creates sites of minimum field gradient in the middle of the flow stream slightly above the bottom face of the flow chamber, while simultaneously creating sites of the maximum field gradient on the edges of the interdigitated electrode arrays at the bottom face. Therefore, cells having a negative-DEP (n-DEP) characteristic congregate around the equilibrium height in the flow chamber where the electric field gradient is minimum and travel down the flow chamber, while cells having a positive-DEP (p-DEP) characteristic are trapped on the bottom face.
Thus, the proposed method enables the effective separation of nonviable (p- or n-DEP) cells from viable cells (n- or p-DEP) by applying an AC electric field with appropriately tuned frequency and field strength. The equilibrium height of the levitating cells is the position at which the DEP and sedimentation forces acting on a cell are balanced with each other. This height is also determined by the height of the chamber, the width of the interdigitated electrode fingers, and the lateral distance between two neighboring electrodes. In this regard, the proposed DEP cell-separation flow chamber is quite different from conventional methods utilizing local field gradients created in the immediate vicinity of the electrode surface to separate cells. Another advantage of the proposed device is that a large volume (>several ml) of sample suspension can be processed quickly without increasing the applied voltage. The chamber height can be much larger than the conventional DEP devices (over 10 times as large) that can accomplish rapid cell separation in the most straightforward way.
The increase in flow-resistance and temperature due to Joule heating caused by the narrow spacing or height of the flow chamber can also be avoided. These thermo-fluid mechanical factors have represented major bottlenecks in designing new DEP cell-separation devices to rapidly process a large volume sample when necessary. Our previous study16 demonstrated that nonviable (dead) yeast (Saccharomyces cerevisiae) cells traveling in the flow stream were concentrated around the sites of the minimum field gradient slightly above the bottom of the flow chamber and were separated from the viable (live) yeast cells that are attached to the edges of the fingers of the interdigitated electrodes at the bottom face. In that study, the dead cells traveling through the flow chamber were separated from the live cells using the corresponding 3D nonuniform electric field with an applied voltage of 3 V peak-to-peak and a frequency range of 1–100 MHz.
In the present study, in order to examine the operation and performance of the proposed cell-separation DEP device as the practical tool for medical applications, live and dead human breast epithelial (MCF10A) cells were used. Because the dielectrophoretic characteristics of the human cells in response to the electric field are quite different from those of yeast cells, two different types of parallel-plate type DEP flow-chambers were newly developed in accordance with our previously proposed design of the device16 to investigate the cell behavior and the device performance. In developed devices, dead (nonviable) cells were trapped on the edges of electrodes at the bottom face and were separated from live (viable) cells traveling in the flow stream at the height of the equilibrium. Quantitative evaluation of the cell-separation performance was performed, and it was found that the proposed device could discriminate almost 98% of dead cells from the cell mixture. Numerical simulations were also conducted to investigate the transient behavior of the cell suspension subjected to a nonuniform AC electric field and steady shear flow. Numerical simulations could predict the spatial distribution of the cells in the proposed device under the exposure of the electric field, and those were, for the first time, captured experimentally in terms of the method of 3D-bioimaging. By adjusting the chamber height properly and operating the device at an optimized flow rate, applied voltage, and field frequency, we expect a throughput capacity over an order of magnitude higher than those of existing microfluidic systems with similar flow channel structures.
II. PARALLEL-PLATE DEP FLOW CHAMBER
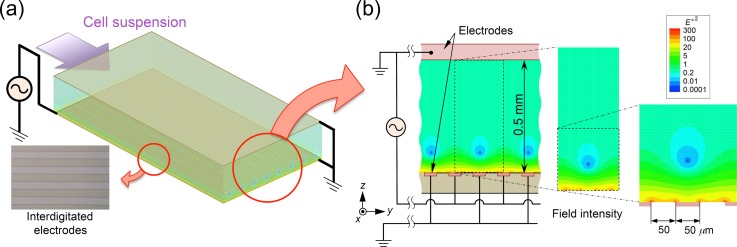
Figure 1(a) illustrates the parallel-plate DEP flow chamber used in the present study, and Fig. 1(b) shows the (left) cross-sectional structure of the flow chamber and (middle and right) magnifications of the lower part of the distribution of the AC electric field strength (E*2). Values of the field strength were normalized to the mean value. A planar electrode was installed on the top face of the flow chamber, while an interdigitated-pair electrode array was installed on the bottom face. The width of the electrode fingers of the array of electrodes was 50 μm, and the distance between adjacent electrode fingers was set to 50 μm [shown in Fig. 1(a)]. The top face of the chamber and one element of the pair interdigitated electrodes were electrically grounded. During the application of an AC voltage across the chamber height, a nonuniform electric field was created throughout the flow chamber. The induced electric field has extremely steep field gradients around the edges of the high-voltage (H.V.) electrodes at the bottom and creates sites of the minimum field gradient at positions slightly above the bottom face along the centerline of grounded (G) electrodes (Fig. 1).
FIG. 1.
(a) The proposed DEP device; (b) (left) cross-sectional structure of the flow channel and (middle and right) contours of the AC electric field strength (E*2). Values of the field strength were normalized to the mean value.
III. EXPERIMENTAL SETUP AND METHOD
A. Cell preparation
Live and dead human breast epithelial cells (MCF10A) were used for the experiment. The cells were cultured in DMEM/F12 Ham's Mixture (Thermo Fisher 1330032) supplemented with 5% Horse Serum (Thermo Fisher 16050122), 20 ng/ml EGF (Thermo Fisher PHG0311L), 10 μg/ml human insulin (Sigma I9278), 0.5 mg/ml hydrocortisone (Sigma H0135), and 100 ng/ml cholera toxin (Sigma C8052). The cell culture dishes were incubated in a humidified atmosphere containing 5% CO2 at 37 °C. Cell culture media were replaced every 3 days. Cells grown to sub-confluence were washed with phosphate-buffered saline w/o calcium and magnesium [PBS(-)] (Nissui, 08190) and harvested by a 5 min treatment with 0.05% trypsin (Sigma, T4799) and 0.02% EDTA (Sigma, E6758).
The cultured cells collected in a conical tube were re-suspended in the media after centrifugation at 600 rpm for 5 min. The dead cells were prepared by exposing the cultured live cells to 80 °C for 15 min. This time period was found to be adequate to kill all the live cells. For the phase-contract observation, staining with 0.2% (w/v) solution Trypan Blue (Sigma T6146) was used to distinguish dead cells from live; dead cells were stained blue, while live cells remained unstained. After staining, the suspension was centrifuged and the volumes were replaced with an isotonic and non-electrolyte 300-mM mannitol solution (Sigma M4125). From the stock suspension of live cells, a suitable volume was pipetted and suspended in the mannitol solution after centrifugation. The live and stained dead cells were mixed together at a ratio of 1:1, with an appropriate final cell volume fraction favorable for separation studies.
For the fluorescence image observation, the collected live cells were washed once with the culture media and then incubated for 15 min at 37 °C with a 1‐μM Calcein-AM solution (Dojindo, C396), a photo-stable reagent that is well retained in the cytoplasm of live cells. The cells were then centrifuged, washed once with the mannitol solution, and suspended in the mannitol solution. In a similar manner, the dead cells were incubated with a 5‐μM propidium iodide (PI) (Sigma P4864) solution, a fluorescent dye that binds to DNA, for 15 min at 37 °C. Cells were then centrifuged, washed once with the mannitol solution, and suspended in the mannitol solution. The stained live and dead cells were mixed together at a ratio of 1:1, with an appropriate final cell volume fraction favorable for providing a clear view for bioimaging analysis.
B. Experimental setup
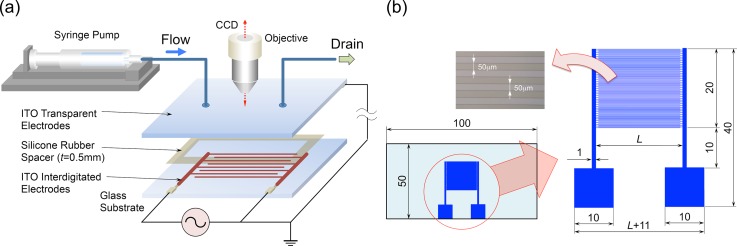
Figure 2 shows (a) the illustration of the experimental equipment and (b) the design and specification of the electrode substrate. The dimension of the internal volume of the flow chamber was 80 mm (L) 10 mm (W) 0.5 mm (H). The flow chamber is composed of two planar glass plates separated from each other by a 0.5 mm gap with a silicon-rubber spacer. The glass plate on the top face was an indium tin oxide (ITO) coated transparent electrode. Two holes for the inlet- and outlet-flow of the cell suspension were drilled into the top glass plate. Further, silicon-rubber tubes were connected to the holes for introduction and removal of the suspension. For the application of the AC voltage across the height of the chamber, a function generator (Tektronix, AFG3101) was used. For the monitoring of the voltage across the height of the chamber, a digital oscilloscope (Tektronix, TDS2012B) was used. To realize a continuous flow rate of cell suspension through the flow chamber, a digital syringe pump (KD Scientific, KDS-100) and a 5 ml glass syringe were used. On the glass plate at the bottom face, the arrays of parallel electrodes with equal widths and gaps were interdigitated with each other as shown in Fig. 2(b). In the present study, two different types of interdigitated electrodes with different lengths of electrode fingers (L = 25 and 40 mm) were used. A shorter electrode substrate was used to investigate the dielectrophoretic behavior of cells and to explore the optimal operation condition and the optimal length of the flow chamber for a high throughput cell separation, while the longer one was used for the quantitative evaluation of the separation performance of the proposed device. The length of the shorter electrode substrate was determined by taking into account the results of the yeast-cell separation;16 the length of the electrode longer than the previously used one was found to be necessary for mammalian cells. The shorter interdigitated electrodes were fabricated in a similar manner by standard photolithography.16 The longer interdigitated electrodes were also fabricated by photolithography. Briefly, aluminum films (thickness 1 μm) were deposited on glass substrates [50 mm (W) × 90 mm (L) × 0.7 mm (t)] using an RF magnetron sputtering system. The positive photoresist (S1808, Rohm and Haas Electronic Materials) was then spin-coated at 4000 rpm and baked on a hot plate at 90 °C for 3 min. The resist layer was exposed to UV light through a positive mask image of the electrode arrays, using a mask aligner. The exposed photoresist was developed with MF-319 (Rohm and Haas Electronic Materials) developer and baked on a hot plate at 130 °C for 5 min. The uncovered aluminum region was etched in a commercially prepared acid mixture labeled Aluminum Etch (Kanto Chemical), which is a mixture of phosphoric, acetic, and nitric acids at 40 °C for 3 min. Finally, the photoresist was removed with AZ 100 remover (AZ Electronic Materials).
FIG. 2.
(a) The illustration of the experimental equipment and (b) the design and specification of the electrode substrate.
All the interdigitated electrodes were fabricated at the Semiconductor Center of Kitakyushu Foundation for the Advancement of Industry, Science and Technology.
C. Experimental method
The flow chamber placed on a stage of a phase-contrast inverted microscope (Olympus, CKX41) was connected to the syringe pump. A continuous flow of cell suspension with the flow rate of Q = 5.0 ml/h (mean velocity of 0.28 mm/s in the flow chamber) was provided into the flow chamber from the syringe pump through the silicon rubber tube. After the whole volume of the flow chamber was filled with the cell suspension, the stream of suspension medium was allowed to carry sample cells through the flow chamber. A sinusoidal AC voltage of Vpp = 20.0 V peak-to-peak and a frequency of 10 kHz were applied after the flow of the cell suspension reached a stabilized condition. It was demonstrated that an input voltage of Vpp = 20.0 V could induce DEF forces on the cells enough to manipulate them without any problems of temperature increase17 and electrolysis.18
The behavior of cells in the flow chamber was observed using a CCD camera (WATEC, WAT-231S2), and video signals were sent to a monitoring and recording system (Shodensya GRAV-1). In addition to the phase-contrast observation, a confocal laser-scanning microscope (Olympus, FV-1000) was used to monitor the spatial distribution of cells in the middle of the separation process. A sequence of snapshots of the cells labeled by fluorescent dye was taken by scanning the focal plane of the laser along the z-axis (in the depth direction). We used wavelengths of 490 nm (ex.) and 515 nm (em.) for the live cells and 530 nm (ex.) and 580 nm (em.) for the dead cells to capture fluorescence images of cell distribution. The snapshots of two-dimensional (2D) sliced images were reconstructed into a high-contrast 3D image using the software included in the microscope system.
The frequency of the AC voltage was determined by the DEP spectrum of the real part of the Clausius-Mossotti (CM) factor, Re(β), obtained as follows. The Clausius-Mossotti factor, β, between the cell and the suspension medium is defined as19
| (1) |
Here, the value ε* = ε + jσ/ω is the complex permittivity, j = , σ is the electrical conductivity, ω is the angular frequency of the AC electric field, and coefficients εc and εf are the relative permittivity of the cell and the suspension medium, respectively. Further, β can be modified, and thus, the values of Re(β) for live and dead cells were obtained using the modified forms of β for a single-shell model of live cells19
| (2) |
and β for dead cells
| (3) |
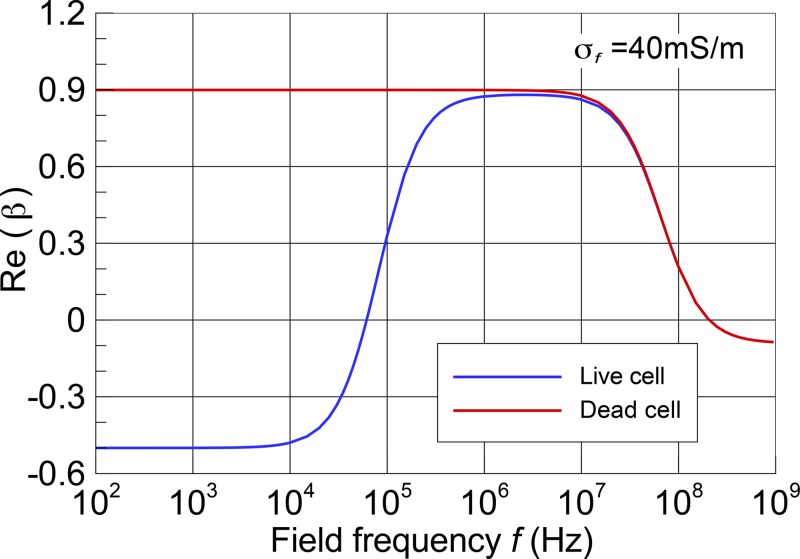
Here, cm, σc, and σf are the membrane capacitance, cytoplasm conductivity, and suspension medium conductivity, respectively, and the prime means the effective values. For the values of the parameters that could not be measured experimentally (membrane and cytoplasm properties), the previously reported values for the MCF10A20,21 and protoplast model22 were used. The medium conductivity obtained experimentally was 40 mS/m. Table I lists the parameters used for these plots. The predicted Re(β) was plotted as a function of frequency using a semilog plot (Fig. 3). In order to realize the largest possible separation performance, several experimental trials were performed in which the frequency of the applied voltage was changed within the range between 1 and 20 kHz. We found that a frequency of 10 kHz was the most appropriate value for the proposed cell-separation device.
TABLE I.
Physical properties of MCF10A cells. ε0: Vacuum permittivity.
FIG. 3.
Dielectrophoretic spectrum of live and dead MCF10A cells calculated using a single-shell model. Model parameters used are listed in Table I.
The DEP force, h, induced on a cell having a diameter d is expressed as
| (4) |
where is the gradient operator, E is the electric field vector, center-dot is the inner product of vectors, and ε0 is the vacuum permittivity. The real part of the CM factor, Re(β), is a function of the field frequency and can be positive or negative, depending on the relative differences between the dielectric properties of the cell interior and surrounding medium. When cells are more polarizable than the surrounding medium (Re(β) > 0), they will be pushed from a low to a high field region (p-DEP). In contrast, when the surrounding medium is more polarizable than cells (Re(β) < 0), cells will withdraw from the highest field region (n-DEP), that is to say, cells will concentrate into the lowest field region.
IV. NUMERICAL SIMULATION
A. Theoretical model formulation
The trajectories of individual cells exposed to the combined force-field of the DEP and dipole-dipole interparticle forces were simulated numerically in order to investigate the transient behavior of cells in the flow chamber. As shown in Fig. 4(a), the cells were assumed to be rigid and spherical having an identical diameter d and density ρc. In an electrically insulated incompressible viscous fluid of viscosity μ and density ρf, the motion of the individual cell exposed to a nonuniform electric field is described by the following equation of motion:
| (5) |
where m is the mass of a single cell, ri is the positional vector of cell i, Fi is the electro-mechanical force vector acting on cell i [Fig. 4(a)], Si is Stokes' drag force vector acting on cell i, and the last term is the external body force due to the difference in mass density between the cells and the suspension medium. Stokes' drag force, Si, is given by
| (6) |
where ui is the local velocity of the suspension medium at the position of the cell i. Fi is given by the following expression:
| (7) |
where fij is the non-zero time-average dipole-dipole interaction vector induced in cell i by the presence of cell j and hi is the non-zero time-average DEP force vector induced in cell i. Because cells are much smaller than the length scale of the electric field nonuniformity, fij is derived as follows:8
| (8) |
where Ej is the electric field induced by the dipole, pj, in cell j, and described as
| (9) |
Here, the dipole moment of cell j, pj, is defined as
| (10) |
and the non-zero time-average DEP force vector, hi, is written from Eq. (4)
| (11) |
where E(ri) is the electric field vector at position ri. The effect of cell rotation caused by the shearing flow of the suspension medium was ignored because the Reynolds number of the flow was on the order of Re ∼ 10−2. Nor did the present model take into account frictional forces between cells and between cells and solid walls because the fluid flow was quite slow. In this situation, frictional forces were thought to have a minor effect when compared to the electro-mechanical forces.
FIG. 4.
(a) Mathematical model of the DEP and dipole-dipole interparticle forces between a pair of cells under an AC electric field generated in the vertical (z) direction; (b) specifications of the calculation domain and boundary conditions used in numerical simulations.
B. Numerical simulation method
Numerical simulations were performed in the “calculation domain” as shown in Fig. 4(b). The dimensions of the calculation domain were 5.0 mm (L) × 0.2 mm (W) × 0.5 mm (H). The width of the channel was determined so as to contain the minimum unit of interdigitated electrodes in the span-wise (y) direction. Because the flow of the suspension was fully developed23 and the rectangular cross-section of the flow channel was a high aspect ratio, the velocity distribution in the calculation domain was assumed to be a 2D Poiseuille flow as a function of z alone
| (12) |
where Q, A, and H are the volumetric flow rate of the suspension medium, the area of the cross-section of the flow channel, and the channel height, respectively.
A periodic boundary condition was applied on both the lateral sides of the calculation domain [Fig. 4(b)]. At the up- and down-stream boundaries, a cell leaving through the down-stream boundary was at the same time replaced by another cell entering through the up-stream boundary. A cell trapped on an edge of the interdigitated electrodes was not allowed to further displace aside or away from the edge. For the electric field, the approximation of 2D-distribution over a cross-section of the calculation domain (y–z plane) was adopted since there was no field variation in the longitudinal direction of the flow chamber.
A shifted soft-sphere potential was used for calculations of the intercellular and the wall-cell collisions. The cutoff radii of the shifted soft-sphere potential for the wall-cell and intercellular collision were rc = 0.6d and 1.1d, respectively. Furthermore, a cutoff radius of rc = 6.0d was applied to the shifted soft-sphere potential of dipole-dipole interaction. This ensured that the value of the mutual dipole-dipole interaction between cells at the distance rc = 6.0d was reduced to less than 1 × 10⁻⁸ of its value at rc = d (cells were in contact with each other). The same cutoff radius of rc = 6.0d was also applied for the DEP force potential.
Prior to the trajectory calculation, the distributions of the electric field and electric field gradient were derived by solving the Laplace equation of the electric potential using a second-order accuracy finite difference method. The mesh sizes of the electric potential in the y- and z-directions used were Δy = Δz < d/4. Forces in Eq. (5) were calculated using the computed electric field and the electric field gradient. The trajectories of individual cells were numerically simulated by updating the total electro-mechanical force acting on cells at every time step.
The number of cells used in the numerical simulation was determined by using the volume ratio of a single cell to the calculation domain and the cell volume fraction, ϕ. The number of cells used was in the range of 200 (ϕ = 1 × 10⁻³) – 1000 (ϕ = 5 × 10⁻³). The initial distribution of all the cells was obtained from a random distribution after 1 × 10⁶ iterations of the geometry optimization.
MCF10A cells were modeled as rigid and spherical particles with an identical diameter of d = 15.0 μm.24 The relative dielectric permittivity of the suspension medium was εf = 78.0; the mass density of the cell was ρc = 1.04 g/cm3;25 and density ρf and viscosity μ of the suspension medium at room temperature were ρf = 1.00 g/cm3 and μ = 8.94 × 10⁻⁴ Pa s, respectively. The modified Brünger-Brooks-Karplus method26 was used for the numerical time integration of Eq. (5) with the time increment Δt = 2.0 × 10⁻⁶ s.16
V. RESULTS AND DISCUSSION
A. Experimental results of cell separation
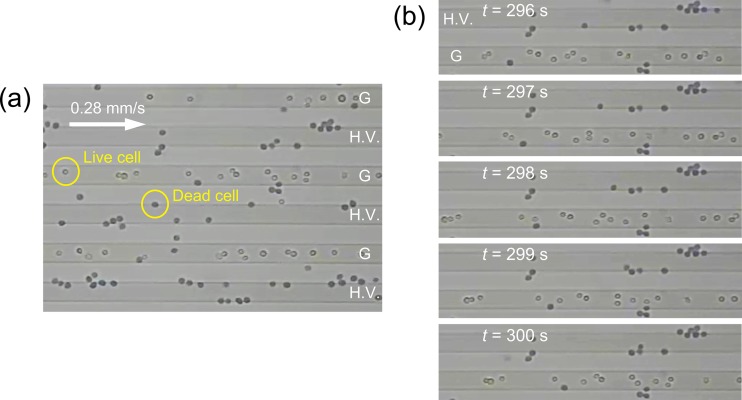
Figure 5(a) shows an instantaneous distribution of traveling cells through the flow chamber at time t = 300 s after the onset of the application of AC voltage (Vpp = 20.0 V, 10 kHz). The mean velocity of the cell suspension was um = 0.28 mm/s. The white arrow indicates the flow direction. The cell volume fraction was ϕ = 1 × 10⁻³. Blue-stained cells are dead cells and appear as filled circles in the figure. White unstained cells are live, and their appearance is more of open circles. The electrodes labeled “G” are grounded electrodes, while those labeled “H.V.” are high-voltage. As soon as the AC voltage was applied across the height of the flow chamber, the live cells began to focus into sites slightly above the centerlines of the G electrodes and levitated in the flow stream toward the downstream. In contrast, the dead cells were attracted toward the edges of electrodes and captured there. However, the number of dead cells attached to the edges of G electrodes increased very little with time. Instead, the number of dead cells attached to the edges of H.V. electrodes gradually increased with time. This was because the magnitude of the field gradient at the edges of H.V. electrodes was far greater than that at the G electrodes. Figure 5(b) shows a series of snapshots of cell behavior in the middle of the separation process, at around t = 300 s. Live cells continuously traveled in the flow stream at a constant velocity along the centerline of the G electrode, whereas the dead cells were trapped along the edges of the H.V. electrode. To evaluate the separation performance of the proposed device, the experiment was conducted using the longer interdigitated electrodes [L = 40 mm in Fig. 2(b)] made of aluminum. The ratio of the live and dead cells was evaluated by counting the number of each group of cells in the inlet and outlet regions of the flow chamber.
FIG. 5.
(a) The distribution of traveling cells in the flow chamber at time t = 300 s after the onset of the application of the AC voltage of Vpp = 20.0 V peak-to-peak with a frequency of 10 kHz. The mean velocity of cell suspension was um = 0.28 mm/s. The white arrow is the flow direction. The cell volume fraction was ϕ = 1 × 10⁻³. Cells stained blue are dead cells, and white unstained cells are live ones. The electrodes labeled “G” are grounded electrodes, while “H.V.” are the high-voltage electrodes. (b) A series of snapshots of the cells' behavior in the middle of the separation process at around t = 300 s. Experimental conditions were the same as those shown in (a).
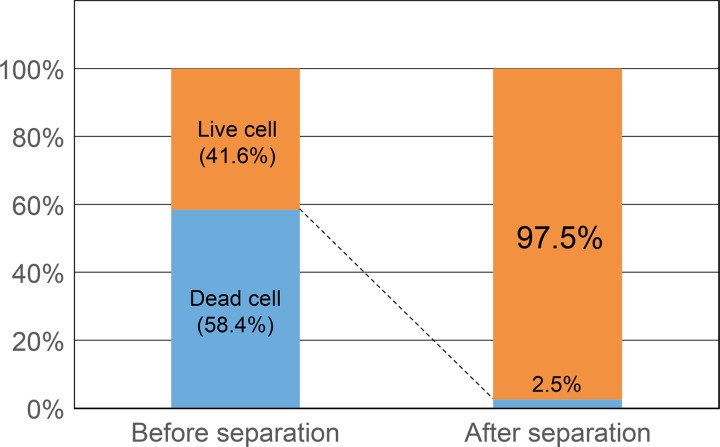
Figure 6 shows that the initial ratio of the live and dead cells, 41.6:58.4, changed to 97.5:2.5 after separation. In other words, almost 98% of dead cells were discriminated from the cell mixture. It was found that the proposed DEP cell-separation device could successfully discriminate most of the dead cells from the live cells. A very small number of dead cells were not trapped in the flow chamber. It could be that the corresponding dead cells had similar DEP properties to the live cells. Another possibility is that small clusters consisting of a mixture of live and dead cells were formed in the middle of the flow stream and then traveled through the flow chamber. It is likely that cells having the p-DEP characteristics (dead cells) and those with the n-DEP (live cell) could attract each other by the dipole-dipole interparticle force acting between them. When the number of live cells in the small cluster is greater than that of dead cells, the levitation force acting on the small cluster will exceed the attractive force from the bottom. This situation may allow dead cells to travel through the flow chamber without being captured at the bottom face.
FIG. 6.
Ratios of live and dead cells in the cell suspension before and after the separation.
B. Numerical predictions of cell separation
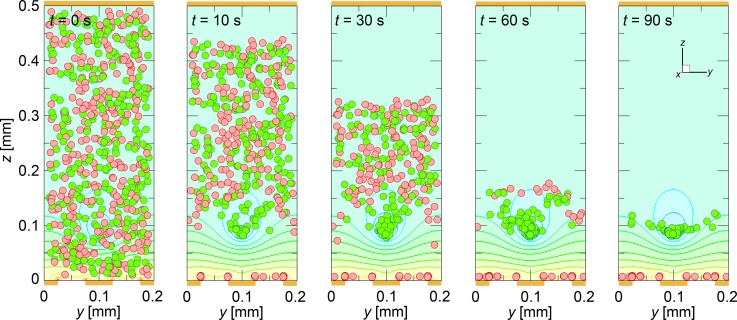
Figure 7 shows a sequence of snapshots of the cell distribution at times t = 0, 10, 30, 60, and 90 s, after the onset of the AC voltage (Vpp = 20.0 V, 10 kHz) application. Distributions of the cells are viewed from the downstream end of the calculation domain looking toward the upstream end. The mean velocity of the cell suspension was um = 0.28 mm/s. The ratio of live and dead cells in the cell suspension was 1:1, with a cell volume fraction of ϕ = 3 × 10⁻³. The green and red closed circles in the figure are the live and dead cells, respectively. The contour lines of the square of the field strength, E*2, are drawn behind the distribution of cells, and positions of electrodes are shown. The total cell number used was about 600.
FIG. 7.
The numerical prediction of the cell distribution at times t = 0, 10, 30, 60, and 90 s, after the onset of the application of the AC voltage of Vpp = 20.0 V with a frequency of 10 kHz. Cell distributions are viewed from the downstream end of the calculation domain, looking upstream. The ratio of live and dead cells was 1:1, with a cell volume fraction of ϕ = 3 × 10⁻³. The green and red closed circles are live and dead cells, respectively. The contour lines of the square of the field strength, E*2, are drawn behind the distribution of cells. Positions of electrodes are also shown.
In the first 10 s after the field application, dead cells were initially distributed in the lower region (≲0.1 mm), promptly moved down due to the strong attractive DEP forces induced on the edges of electrodes at the bottom face. However, the rest of the dead cells (initially distributed in regions higher than ∼0.1 mm) gradually moved down. Because the magnitude of the DEP force within these regions (>=0.1 mm) was negligibly small, gravitational force alone caused the sedimentation of not only the dead cells but also the live cells. The dead cells that moved close to the bottom face were further attracted and finally attached to the edges of the electrodes, whereas the live cells that had moved down earlier were soon lifted upward by the repulsive DEP forces induced on the edges of the electrodes at the bottom face and began to congregate gradually at the equilibrium height. Finally, the dead cells were captured on the edges of electrodes at the bottom face, while the live cells, which continued to travel through the chamber, focused at the site of the equilibrium height in the middle of the flow stream, and were consequently separated from the dead cells by t = ∼90 s.
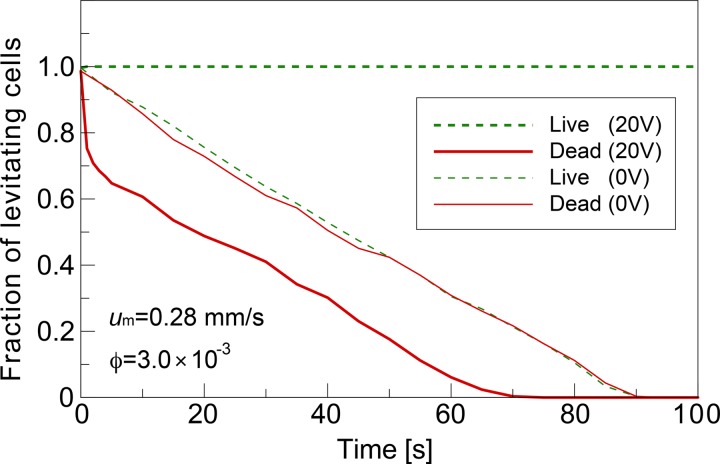
Figure 8 shows the numerically predicted time variation of the fraction of levitating cells in the flow chamber (Vpp = 0, 20.0 V, 10 kHz). The mean velocity of the cell suspension was um = 0.28 mm/s. The ratio of live and dead cells was 1:1 with the cell volume fraction of ϕ = 3 × 10⁻³. When there was no electric field (0 V), the fraction of levitating cells decreased linearly with time. This means that all the cells simultaneously moved down at a constant velocity due to the gravitational force. These dropping cells promptly acquired terminal velocity because the retarding drag force became equal and opposite to the gravitational force in a very short time (on the order of ms) as soon as they began to fall. On the other hand, when the electric field was applied, all the dead cells began to drop simultaneously due to the gravitational force, and dead cells initially located in the lower region of the flow chamber were accelerated downward by the attractive DEP force and soon attached to the edges of electrodes at the bottom face. Live cells continued to travel through the flow chamber due to the repulsive DEP force acting as a levitation force. As shown in Fig. 8, the time period necessary to complete the cell separation was predicted to be about 80 s under the present operating conditions, and this duration was found to be independent of the cell volume fraction and mean velocity of the suspension (not shown). This implies that the minimum length of the flow chamber, L, to complete the cell separation under the present operation condition can be estimated as L = 0.28 mm/s (mean flow velocity) × 80 s ∼22.4 mm, when the total area of the electrodes at the bottom is large enough to capture all the dead cells in the suspension.
FIG. 8.
Numerically predicted time variation of the fraction of levitating cells in the flow chamber for cases 0 V (no AC voltage applied) and 20 V (Vpp = 20.0 V) with a frequency of 10 kHz. The mean velocity of the cell suspension was um = 0.28 mm/s. The ratio of live and dead cells was 1:1 with a cell volume fraction of ϕ = 3 × 10⁻³.
C. Comparison of experimental results and numerical predictions
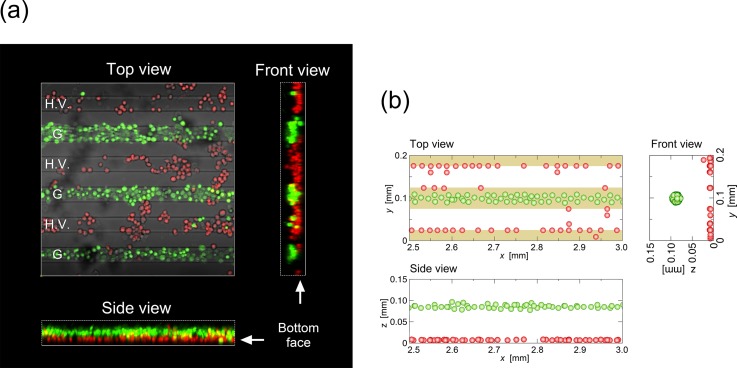
Figure 9 shows (a) the experimental results and (b) the numerical prediction of the distributions of cells traveling through the flow chamber at time t = 300 s after the onset of the AC voltage (Vpp = 20.0 V, 10 kHz). The mean velocity of the cell suspension was um = 0.28 mm/s, flowing from left to right. The cell volume fraction was ϕ = 1 × 10⁻³. Recall that in Fig. 5, cells stained blue are dead cells and white unstained cells are live; in Fig. 9(b), the green closed circles are live cells and the red are dead cells. The electrodes labeled “G” are grounded electrodes and “H.V.” are high-voltage electrodes. The numerical prediction shows good agreement with the experimental results. Live cells continued to travel along the centerline of the grounded electrodes slightly above the bottom face, while dead cells were captured at the edges of the electrodes. It is interesting to note that the prediction shows that the dead cells captured at the grounded electrode formed a cluster due to the attractive dipole-dipole interparticle force acting in the transverse (y) direction.
FIG. 9.
(a) Experimental result and (b) numerical prediction of the distributions of cells traveling through the flow chamber at time t = 300 s after the onset of the AC voltage of Vpp = 20.0 V with a frequency of 10 kHz. The mean velocity of the cell suspension was um = 0.28 mm/s, flowing from left to right. The cell volume fraction was ϕ = 1 × 10⁻³.
To investigate the spatial distribution of cells in the flow chamber, bioimaging analysis was performed. Cell distribution in the vertical direction greatly affects the separation performance of the proposed device. Therefore, visualizations of the vertical distribution of the suspended cells were performed by constructing 3D images from a series of 2D fluorescence images obtained by traversing the focal sheet of the laser-scanning microscope in the vertical direction. Because the laser scanning speed was limited and was not capable of live imaging of moving cells, images of cell distribution were captured in a static condition (in the absence of the fluid flow). Figure 10 shows (a) the experimental results and (b) the numerical prediction of the 3D distributions of cells in the flow chamber at time t = 300 s after the onset of the AC voltage (Vpp = 20.0 V, 10 kHz) application. The cell volume fraction was ϕ = 3 × 10⁻³.
FIG. 10.
(a) Fluorescence image and (b) numerical prediction of the 3D distributions of cells in the flow chamber at time t = 300 s after the onset of the AC voltage (Vpp = 20.0 V; frequency 10 kHz). Fluid flow was not present. The cell volume fraction was ϕ = 3 × 10⁻³. Green cells are live, and red ones are dead cells.
As already seen, most of the dead cells attached to the edges of the H.V. electrodes (top view), while a few attached to those of the G electrodes. However, the dead cells attached to the H.V. electrodes formed clusters scattered over the surface of electrodes due to the presence of dipole-dipole interactions acting between cells because there was no flow in the chamber. When the fluid flow was absent, cells aggregated close enough to each other to allow the formation of clusters in terms of the dipole-dipole interparticle force acting between cells. On the other hand, live cells were congregated at the height of equilibrium along the grounded electrodes by the repulsive DEP force and formed a thin layer slightly above the layer of dead cells on the bottom. The live cells formed very few clusters because the electric field above the grounded electrodes was not strong enough to induce the dipole-dipole interparticle force for cells to attract each other.15 The equilibrium height of the live cells in the experiment was ∼40 μm, lower by almost half than the numerically predicted height (∼80 μm). The difference between these values can be attributed to the effect of fluorescent dyes introduced into the cells on the DEP properties of the cells. The present experiment revealed that fluorescent dyes significantly affected the DEP properties of both the suspension medium and the cells, even when only an extremely small amount was dissolved in the suspension (on the order of μM), as well as introduced into the cells.
VI. CONCLUDING REMARKS
In this study, a novel parallel-plate type DEP flow-chamber was developed to effectively separate nonviable cells from viable ones using the difference in their DEP characteristics in response to a nonuniform AC electric field. Human breast epithelial (MCF10A) live and dead cells were used to examine the cell-separation performance of the proposed device as a tool for medical applications. In accordance with our concept of device design proposed before,16 a flow chamber consisting of a planar electrode on the top and an interdigitated-pair electrode array on the bottom was fabricated to provide a nonuniform electric field across the whole volume of the flow chamber for high-throughput cell separation. Along with the experiment, a numerical simulation was conducted to investigate the transient behavior of the cell suspension subjected to a nonuniform AC electric field and steady shear flow. A theoretical model was developed to simulate the trajectories of individual cells under the action of DEP, dipole-dipole interparticle, viscous, and gravitational forces.
The results demonstrated that the live cells traveling along the flow stream were focused around the sites of the equilibrium slightly above the grounded electrodes at the bottom face of the flow chamber and were effectively separated from the dead cells trapped on the edges of the high-voltage electrodes at the bottom face. Numerical predictions showed good agreement with the experimental results, and we determined that more extensive numerical studies and applications could be carried out based on the proposed simulation model, such as for the collection and discrimination of polarizable biological particles of various size scales. Meanwhile, we investigated the spatial distribution of cells in the process of separation by analyzing 3D fluorescence images of cells labeled with fluorescent markers. The 3D images of cell distribution were constructed from a series of 2D fluorescence images obtained by scanning the laser sheet of the confocal laser microscope in the vertical direction. The results showed that the live cells were focused at the height of equilibrium in the flow chamber, whereas the dead cells were attached to the bottom face. It was also found that the distribution of live and dead cells obtained in the experiment was very similar to that of the prediction; however, the height of the live cells levitating in the flow chamber obtained experimentally was half the predicted height. It is suspected that the fluorescent dyes loaded in the cells altered the DEP properties of the cells.
In conclusion, it is expected that the proposed DEP cell-separation device will be capable of attaining a throughput capacity over an order of magnitude higher than those of existing microfluidic systems with proper adjustment of the height and the length of the flow chamber and when the device is operated at an optimized flow rate, applied voltage, and field frequency. This could broaden the clinical utility of DEP devices for cell separation.
ACKNOWLEDGMENTS
Computations were performed on the multi-core parallel simulation system of the National Defense Academy. This work was funded in part by a JSPS Grant-in-Aid for Scientific Research (C) JP26420130.
References
- 1. Demircan Y., Özgür E., and Külah H., Electrophoresis 34, 1008–1027 (2013). 10.1002/elps.201200446 [DOI] [PubMed] [Google Scholar]
- 2. Khoshmanesh K., Nahavandi S., Baratchi S., Mitchell A., and Kalantar-zadeh K., Biosens. Bioelectron. 26, 1800–1814 (2011). 10.1016/j.bios.2010.09.022 [DOI] [PubMed] [Google Scholar]
- 3. Chang L., Gallego-Perez D., Zhao X., Bertani P., Yang Z., Chiang C. L., Malkoc V., Shi J., Sen C. K., Odonnell L., Yu J., Lu W., and Lee L. J., Lab Chip 15(15), 3147–3153 (2015). 10.1039/C5LC00553A [DOI] [PubMed] [Google Scholar]
- 4. Salimi E., Braasch K., Butler M., Thomson D. J., and Bridges G. E., Biomicrofluidics 10(1), 014111 (2016). 10.1063/1.4940432 [DOI] [PMC free article] [PubMed] [Google Scholar]
- 5. Henning A., Bier F. F., and Hölzel R., Biomicrofluidics 4(2), 022803 (2010). 10.1063/1.3430550 [DOI] [PMC free article] [PubMed] [Google Scholar]
- 6. Leu T. S. and Liao Z. F., Intl. J. Mod. Phys. Conf. Ser. 19, 185–189 (2012). 10.1142/S2010194512008732 [DOI] [Google Scholar]
- 7. Hung S. H., Huang S. C., and Lee G. B., Sensors 13(2), 1965–1983 (2013). 10.3390/s130201965 [DOI] [PMC free article] [PubMed] [Google Scholar]
- 8. Pethig R., “ Review article dielectrophoresis: Status of the theory,” Biomicrofluidics 4(2), 022811 (2010). 10.1063/1.3456626 [DOI] [PMC free article] [PubMed] [Google Scholar]
- 9. Čemažar J., Douglas T. A., Schmelz E. M., and Davalos R. V., Biomicrofluidics 10(1), 014109 (2016). 10.1063/1.4939947 [DOI] [PMC free article] [PubMed] [Google Scholar]
- 10. Marchalot J., Chateaux J. F., Faivre M., Mertani H. C., Ferrigno R., and Deman A. L., Biomicrofluidics 9(5), 054104 (2015). 10.1063/1.4928703 [DOI] [PMC free article] [PubMed] [Google Scholar]
- 11. Allahrabbi N., Chia Y. S. M., Saifullah M. S. M., Lim K. M., and Yung L. Y. L., Biomicrofluidics 9(3), 034110 (2015). 10.1063/1.4922276 [DOI] [PMC free article] [PubMed] [Google Scholar]
- 12. Gascoyne P. R. C., Shim S., Noshari J., Becker F. F., and Stemke-Hale K., Electrophoresis 34(7), 1042–1050 (2013). 10.1002/elps.201200496 [DOI] [PMC free article] [PubMed] [Google Scholar]
- 13. Camarda M., Scalese S., and La Magna A., Electrophoresis 36(13), 1396–1404 (2015). 10.1002/elps.201400385 [DOI] [PubMed] [Google Scholar]
- 14. Mathew B., Alazzam A., Abutayeh M., and Stiharu I., J. Sep. Sci. 39(15), 3028–3036 (2016). 10.1002/jssc.201600350 [DOI] [PubMed] [Google Scholar]
- 15. Tada S., Biorheology 52(3), 211–224 (2015). 10.3233/BIR-14039 [DOI] [PubMed] [Google Scholar]
- 16. Tada S., Nakanishi A., Eguchi M., Ochi K., Baba M., and Tsukamoto A., Biomicrofluidics 10(3), 034110 (2016). 10.1063/1.4950999 [DOI] [PMC free article] [PubMed] [Google Scholar]
- 17. Pethig R., Crit. Rev. Biotechnol. 16(4), 331–348 (1996). 10.3109/07388559609147425 [DOI] [Google Scholar]
- 18. Garcia-Sanchez P., Ramos A., Green N. G., and Morgan H., IEEE Trans. Dielectr. Electr. Insul. 13(3), 670–677 (2006). 10.1109/TDEI.2006.1657983 [DOI] [Google Scholar]
- 19. Jones T. B., Electromechanics of Particles ( Cambridge University Press, 1995), pp. 34–48. [Google Scholar]
- 20. Qiao G., Wang W., Duan W., Zheng F., Sinclair A. J., and Chatwin C. R., IEEE Trans. Biomed. Eng. 59(8), 2321–2329 (2012). 10.1109/TBME.2012.2202904 [DOI] [PubMed] [Google Scholar]
- 21. Han A., Yang L., and Frazier A. B., Clin. Cancer Res. 13(1), 139–143 (2007). 10.1158/1078-0432.CCR-06-1346 [DOI] [PubMed] [Google Scholar]
- 22. Pethig R., in Encyclopedia of Surface and Colloid Science, 2nd ed., edited by Somasundaran P. ( Taylor and Francis, London, 2006), pp. 1719–1736. [Google Scholar]
- 23. Schlichting H., Boundary-Layer Theory ( McGraw-Hill, New York, 1979). [Google Scholar]
- 24. Hu S., Liu G., Chen W., Li X., Lu W., Lam Raymond H. W., and Fu J., Small 12(17), 2300–2311 (2016). 10.1002/smll.201503620 [DOI] [PMC free article] [PubMed] [Google Scholar]
- 25. Bryan A. K., Hecht V. C., Shen W., Payer K., Grover W. H., and Manalis S. R., Lab Chip 14(3), 569–576 (2014). 10.1039/C3LC51022K [DOI] [PMC free article] [PubMed] [Google Scholar]
- 26. Brünger A., Brooks C. L. III, and Karplus M., Chem. Phys. Lett. 105, 495–500 (1984). 10.1016/0009-2614(84)80098-6 [DOI] [Google Scholar]


