

Abstract
EvC syndrome is a type of autosomal-recessive chondrodysplasia. Previous case studies in patients suggest abnormal craniofacial development, in addition to dwarfism and tooth abnormalities. To investigate how craniofacial development is affected in EvC patients, surface models were generated from micro-CT scans of control mice, Evc2 global mutant mice and Evc2 neural crest-specific mutant mice. The anatomic landmarks were placed on the surface model to assess the morphological abnormalities in the Evc2 mutants. Through analyzing the linear and angular measurements between landmarks, we identified a smaller overall skull, shorter nasal bone, shorter frontal bone, and shorter cranial base in the Evc2 global mutants. By comparing neural crest-specific Evc2 mutants with control mice, we demonstrated that the abnormalities within the mid-facial regions are not accounted for by the Evc2 mutation within these regions. Additionally, we also identified disproportionate length to width ratios in the Evc2 mutants at all levels from anterior to posterior of the skull. Overall, this study demonstrates a more comprehensive analysis on the craniofacial morphological abnormalities in EvC syndrome and provides the developmental insight to appreciate the impact of Evc2 mutation within the neural crest cells on multiple aspects of skull deformities.
Keywords: EVC2, LIMBIN, craniofacial development, skull morphology
INTRODUCTION
Ellis-van Creveld syndrome (EvC) is an autosomal-recessive chondrodysplasia (McKusick et al., 1964), with a wide spectrum of symptoms such as shorter limbs and ribs, hypomorphic nails and teeth, polydactyly, and cardiovascular malformations (Baujat and Le Merrer, 2007). Studies have identified EVC and EVC2 as causative genes, which are responsible for around two thirds of identified cases of EvC syndrome in humans (Ruiz-Perez et al., 2000; Ruiz-Perez et al., 2003). Genetic studies have also identified EVC2 / LIMBIN mutations in Japanese brown cattle (Takeda et al., 2002) and Tyrolean Grey cattle (Murgiano et al., 2014). In both cases, the affected cattle bear congenital dwarfism, suggesting a conserved function of EVC2 / LIMBIN during development among different species.
EvC syndrome has been categorized as a ciliopathy due to the ciliary localization of the proteins encoded by EVC and EVC2 (Baujat and Le Merrer, 2007). Recently, WDR35 was reported as the potential third causative gene for EvC syndrome (Caparros-Martin et al., 2015), though the cells with WDR35 mutation have quite distinct characteristics. Biochemical studies indicated that EVC and EVC2 are N-terminal anchored transmembrane proteins, which are mutually required for their ciliary localizations (Dorn et al., 2012; Caparros-Martin et al., 2013). The EVC-EVC2 complex interacts with SMO, the Hedgehog signaling effector protein. This interaction at the base of primary cilium is required for transducing Hedgehog signaling (Dorn et al., 2012).
Despite the reports on the function of EVC and EVC2 at the molecular level and the wide spectrum of clinical presentations in EvC patients, the existing documentations of the craniofacial manifestations of EvC syndrome are quite inconsistent. For example, the enlarged skull, depressed nasal bridge, mandibular prognathism characteristic of skeletal class III growth, and skeletal open bite are reported in several cases of EvC patients (Ellis and van Creveld, 1940; Goor et al., 1965; Susami et al., 1999), while other reports indicated that facial development is normal (Varela and Ramos, 1996; Hanemann et al., 2010). These inconsistencies are possibly due to a large variation in the patients’ genetic background and/or the limited information on the craniofacial abnormalities in EvC patients.
Previous reports have documented studies using mouse models to understand the pathophysiological mechanism leading to congenital abnormalities in EvC patients. For example, Evc2 mutant mice bear shortened limbs and abnormally developed teeth, which are similar to symptoms observed in EvC patients (Zhang et al., 2015; Zhang et al., 2016). Evc or Evc2 mutant mice were also used as models for understanding the craniofacial abnormalities. However, these works are either restricted to the cranial base at embryonic stages (Pacheco et al., 2012) or mainly focus on the skull deformities in the anterior-posterior dimension (Badri et al., 2016b). Interestingly, it is not known if the mid-facial defect identified in Evc2 mutant is due to the loss of Evc2 function within the mid facial region. In this study, to better understand the skull deformities in EvC patients, we use micro-CT based skull modeling to generate three-dimensional surfaces models for the Evc2 mutant mice. Additionally we also compared the global mutant mice for Evc2 with the neural crest-specific mutants for Evc2 to understand the impact of the Evc2 mutation within the neural crest cells on multiple aspects of the skull deformities.
METHODS and MATERIALS
Animal Model
Animals were maintained and used in compliance with the Institutional Animal Care and Use Committee (IACUC) of the University of Michigan in accordance with the National Institutes of Health Guidelines for Care and Use of Animals in research and all experimental procedures were approved by the IACUC of the University of Michigan. Evc2 global and conditional mutant mice used in the current studies were generated by our group and reported previously (Zhang et al., 2015). Global mutant mice (hereafter Evc2 m) were obtained by crossing heterozygous male and female mice. Neural crest-specific Evc2 (hereafter Evc2 cko) mutant mice were generated by crossing Evc2 floxed mice (Zhang et al., 2015) and neural crest specific Cre mice (P0-Cre, C57BL/6J-Tg(P0-Cre)94Imeg (ID 148), provided by Dr. Kenichi Yamamura) (Yamauchi et al., 1999). Evc2 global mutant and floxed mice were maintained in a mixed background of C57BL6/J and 129S6. All mice were crossed and maintained in our semi-closed mouse colony for at least 5 years.
Histological Analysis
Heads from mice with different genotypes at postnatal day 8 were collected and fixed in 4% Paraformaldehyde overnight. They were then preserved in phosphate buffered saline (PBS) until micro-CT scanning was obtained on all skulls.
Micro-CT (μCT)
Micro-CT scanning of fixed skulls was taken at the University of Michigan using a micro-CT system (μCT100 Scanco Medical, Bassersdorf, Switzerland). Scan settings were as following: voxel size 12 μm, 55 kVp, 109 μA, 0.5 mm AL filter, and integration time 500 ms.
Image Acquisition, Segmentation and Surface Models
To quantify the skull morphological differences among controls, Evc2 m and Evc2 cko at postnatal day 8, the surface models were first generated based on micro-CT data, as shown in Fig 1. Digital Image and Communications in Medicine (DICOM) files/images obtained from micro-CT were used to generate 3D model using ITK-SNAP (open-source software developed by grants and contracts from the U.S. National Institutes of Health, www.itksnap.org). 3D slicer (open-source software, www.slicer.org) was then used for placements of anatomical landmarks. Model superimpositions were carried out using 3D Slicer with the following landmarks on the occipital bones: right and left anterolateral tips of the interparietal bone, cross point between the median line and the line which connects left and right anterolateral tip of the interparietal bone, and posterior tip of the interparietal bone.
Fig 1.

Gross morphology of head in control, Evc2 cko and Evc2 m. Dorsal views (A, B and C) and left lateral views (D, E and F) of represented control, Evc2 cko, and Evc2 m, respectively.
Landmark Identification
Overall, fifteen surface models were generated and 19 landmarks (Table 1) were placed on each sample for linear measurements in all three dimensions, for angular measurements (Table 2) and for width to length ratio calculations.
Table 1.
Craniofacial Landmarks. Please note that bilateral anatomical points are labeled left side first. Anatomical landmarks in parentheses are midpoints of the bilateral landmarks.
| Anatomical landmarks | Description |
|---|---|
| A | Nasale, Rostral point of nasal bone |
| N | Nasion, Caudal point of nasal bone |
| F | Caudal point of frontal bone |
| Pr | Caudal point of Parietal bone |
| Pri | Most posterior point of interparietal bone at midline |
| XN | Most anterior point at intersection of premaxillae and nasal bones |
| XMx | Most inferior point of premaxilla at Premaxilla-maxilla suture |
| ZMx | Most anterior point of zygomatic process of zygoma at intersection of maxilla and zygoma |
| MxSp | Most posterior point of alveolar ridge at the Intersection of maxilla and sphenoid |
| ZT | Most anterior point of Zygomatic process of temporal bone at intersection of zygoma and zygomatic process of temporal bone |
| Tp | Most posterior portion of post-tympanic hook of temporal bone |
| PNS | Posterior nasal spine |
| Pf | Posterior palatine fissure |
| Sp | Intersection of presphenoid and frontal bone at midline of cranial base |
| Sos | At SOS, sphenoid-occipital suture, most anterosuperior point |
| Ba | Basion |
| Op | Opisthion |
| MxAl | Most inferior point at center of alveolar ridge on the lingual side of maxillary incisor, lingual |
| MxC | Maxillary incisor edge |
Table 2.
Linear and angular measurements
| Linear measurements | Anatomical landmarks | Angular measurements | Anatomical landmarks |
|---|---|---|---|
| Total skull length | A-Pri | Neurocranium to Cranial Base I | A-N/A-Ba |
| Nasomaxillary complex | Neurocranium to Cranial Base II | N-F/A-Ba | |
| Nasal bone length | A-N | Cranial base to Vault I | N-F/F-Pr |
| Frontal bone length | N-F | Cranial base to Vault II | F-Pr/Pr-Pri |
| Width of nasal bone at intersection with premaxillae | Xn-Xn | Cranial vault to cranial base I | F-Pri/F-Ba |
| Zygomatic arch length | ZMx-ZT | Cranial vault to cranial base II | F-Pri/Sp-SOS |
| Erupted upper incisor length | MxAl-MxC | Cranial vault to cranial base III | F-Pri/Sp-Ba |
| Viscerocranial length | F-MxAl | Cranial vault to cranial base IV | F-Pri/Sos-Ba |
| Calvaria | Nasal bone to cranial base I | A-N/F-Ba | |
| Parietal length | F-Pr | Nasal bone to cranial base II | A-N/Sp-Sos |
| Interparietal length | Pr-Pri | Nasal bone to cranial base III | A-N/Sp-Ba |
| Occipital Bone | Pri-Op | Nasal bone to cranial base IV | A-N/Sos-Ba |
| Width at Zygomatic arch (anterior) | ZMx-ZMx | Nasal bone to cranial vault | A-N/F-MxAl |
| Width at Zygomatic arch (posterior) | ZT-ZT | Premaxilla to cranial base | F-MxAl/F-Ba |
| Width of temporal bone | Tp-Tp | Upper incisors to cranial base | F-MxC/F-Ba |
| Cranial Base | Premaxilla to cranial vault | F-MxAl/F-Pri | |
| Total Cranial Base | A-Ba | Upper incisors to cranial vault | F-MxC/F-MxAl |
| Cranial base length I | Sp-Sos | ||
| Cranial base length II | Sp-Ba | ||
| Basioccipital length | Ba-Sos | ||
| Viscerocranial heights | |||
| Viscerocranial height at SOS | F-Sos | ||
| Viscerocranial height at basion | F-Ba | ||
Statistical Analysis
The Mann–Whitney U test was done by SPSS 21.0 to evaluate the linear and angular measurements between controls and mutants.
RESULTS
Generated Evc2 m and Evc2 cko (Zhang et al., 2015) had a gross morphology similar to those seen in EvC patients as well as in the Evc mutant mice (McKusick et al., 1964; Ruiz-Perez et al., 2007). In comparison to controls, both types of mutants showed shortened skull length, while the length of the skull is more severely affected in Evc2 m compared to Evc2 cko (Fig 1).
For cranial base length I (Sp-Sos), erupted upper incisor length (MxAl-MxC), and total Cranial Base (A-Ba), we observed significant differences when comparing Evc2 m to control and comparing Evc2 cko to control (Table 3, Fig 2 B, C, D, and Fig 3 B). These results suggest that Evc2 function in the neural crest cells affects the development of these regions. In contrast, we observed no differences in the width of the nasal bone at the intersection with premaxillae (Xn-Xn), parietal length (F-Pr), or viscerocranial height at basion (F-Ba) (Table 3), suggesting that these characteristics are not affected by Evc2 mutations. For skull length (A-Pri), nasal bone length (A-N), frontal bone length (N-F), zygomatic arch length (ZMx-ZT), viscerocranial length (F-MxAl), interparietal length (Pr-Pri), occipital bone length (Pri-Op), width of anterior zygomatic arch (ZMx-ZMx), width of posterior zygomatic arch (ZT-ZT), width of temporal bone (TP-TP), basioccipital length (Sos-Ba), cranial base length II (Sp-Ba), and viscerocranial height at Sos (F-Sos), we only detected significant differences between control and Evc2 m, but not between control and Evc2 cko (Fig 2 B-E, Fig 3 E, and Table 3), suggesting that Evc2 function in non-neural crest derived tissues may play a vital role in the development of these tissues. Overall, comparisons of the linear measurements between controls, Evc2 m, and Evc2 cko allow the identification of the origins of the tissues leading to the linear abnormalities during skull development. To examine if the shortened cranial base observed in the Evc2 m and Evc2 cko is due to early synchondrosis fusion, we generated the models including the cranial bases from the CT scans (Fig 3 F, G and H). The CT scans clearly indicate early fusion of the intersphenoidal synchondrosis in the Evc2 m, but not in the controls or in Evc2 cko.
Table 3.
1: Control group, 2: Evc2 P0m, 3: Evc2m. Changes in linear measurements are indicated as mm and percentage. Positive value indicates decrease in the latter sample comparing to former sample. Negative values indicate an increase in the latter sample comparing to former sample.
| Measurements | Group vs Group | Change | P value | Measurements | Group vs Group | Change | P value | ||
|---|---|---|---|---|---|---|---|---|---|
| mm | % | mm | % | ||||||
| A-Pri | 1-2 | 0.534 | 3.523 | # | ZT-ZT | 1-2 | 0.047 | 0.532 | # |
| 1-3 | 1.623 | 10.715 | *** | 1-3 | 0.702 | 7.985 | *** | ||
| 2-3 | 1.089 | 7.454 | ** | 2-3 | 0.656 | 7.493 | *** | ||
| A-N | 1-2 | 0.204 | 5.163 | # | Tp-Tp | 1-2 | -0.099 | -1.077 | # |
| 1-3 | 0.484 | 12.262 | *** | 1-3 | 0.684 | 7.439 | *** | ||
| 2-3 | 0.280 | 7.486 | * | 2-3 | 0.783 | 8.426 | *** | ||
| N-F | 1-2 | 0.072 | 1.207 | # | A-Ba | 1-2 | 0.787 | 5.870 | ** |
| 1-3 | 0.636 | 10.725 | ** | 1-3 | 1.902 | 14.196 | *** | ||
| 2-3 | 0.564 | 9.634 | ** | 2-3 | 1.116 | 8.845 | *** | ||
| XN-XN | 1-2 | -0.005 | -0.217 | # | Sp-Sos | 1-2 | 1.509 | 28.731 | # |
| 1-3 | 0.034 | 1.487 | # | 1-3 | 2.677 | 50.984 | * | ||
| 2-3 | 0.039 | 1.701 | # | 2-3 | 1.169 | 31.224 | # | ||
| ZMx-ZT | 1-2 | 0.148 | 5.118 | # | Sp-Ba | 1-2 | 1.097 | 14.658 | # |
| 1-3 | 0.448 | 15.479 | ** | 1-3 | 2.083 | 27.839 | ** | ||
| 2-3 | 0.300 | 10.920 | *** | 2-3 | 0.986 | 15.444 | # | ||
| MxAl-MxC | 1-2 | 0.122 | 19.295 | ** | Sos-Ba | 1-2 | -0.040 | -1.535 | # |
| 1-3 | 0.374 | 59.378 | *** | 1-3 | -0.210 | -8.004 | *** | ||
| 2-3 | 0.253 | 49.666 | *** | 2-3 | -0.169 | -6.371 | ** | ||
| F-MxAl | 1-2 | 0.132 | 1.312 | # | F-Sos | 1-2 | 0.113 | 1.759 | # |
| 1-3 | 1.052 | 10.495 | ** | 1-3 | 0.288 | 4.487 | * | ||
| 2-3 | 0.921 | 9.305 | * | 2-3 | 0.175 | 2.777 | # | ||
| F-Pr | 1-2 | 0.055 | 1.567 | # | F-Ba | 1-2 | 0.103 | 1.298 | # |
| 1-3 | 0.370 | 10.530 | # | 1-3 | 0.022 | 0.283 | # | ||
| 2-3 | 0.315 | 9.106 | # | 2-3 | -0.080 | -1.029 | # | ||
| Pr-Pri | 1-2 | -0.021 | -0.685 | # | |||||
| 1-3 | -0.624 | -19.990 | *** | ||||||
| 2-3 | -0.603 | -19.173 | *** | ||||||
| Pri-Op | 1-2 | 0.059 | 2.678 | # | |||||
| 1-3 | 0.330 | 14.946 | *** | ||||||
| 2-3 | 0.271 | 12.606 | *** | ||||||
| ZMx-ZMx | 1-2 | -0.064 | -0.852 | # | |||||
| 1-3 | 0.616 | 8.177 | *** | ||||||
| 2-3 | 0.681 | 8.953 | *** | ||||||
N=5,
p>0.05;
p<0.05;
p<0.01;
p<0.001.
Fig 2.
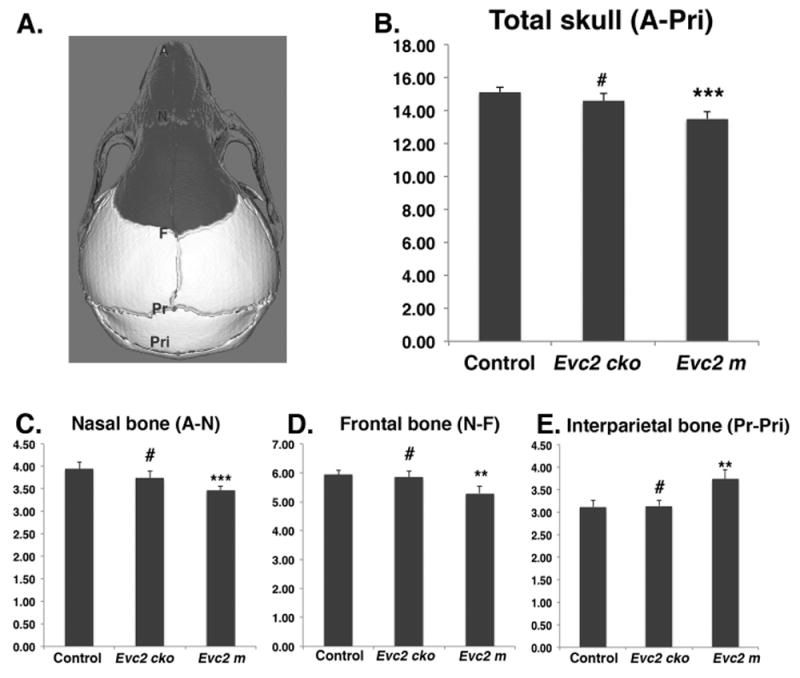
Evc2 mutation leads to abnormal head in anterior posterior dimension. A. Diagram indicates the landmarks in the anterior posterior dimension. Areas with dark color are derived from neural crest cells. The length of total (B), nasal bone (C), frontal bone (D) and interparietal bone (E) are shown. N=5, #, p>0.05; *, p<0.05; **, p<0.01; ***, p<0.001.
Fig 3.

Evc2 mutation leads to abnormal cranial base. A. Diagram indicates the landmarks in the cranial base. Areas with dark color are derived from neural crest cells. The lengths of the cranial base at different levels are shown in (B-E). N=5, #, p>0.05; ***, p<0.001. F-H. Cranial base models generated from the μCT scans of control (F), Evc2 cko (G) and Evc2 m (H). Dark circle indicate the fused ISS in Evc2 m.
Based on angular measurements comparing control with Evc2 m and control with Evc2 cko, we observed no differences (Table 4) in cranial vault to cranial base III (F-Pri/Sp-Ba) or cranial vault to cranial base IV (F-Pri/Sos-Ba), suggesting that these characteristics are not affected by Evc2 mutations. For neurocranium to cranial base II (A-F/A-Ba), Cranial base to Vault I (N-F/F-Br), nasal bone to cranial base I (A-N/F-Ba), premaxilla to cranial base (MxAl-F/F-Ba), upper incisors to cranial base (MxC-F/F-Ba), premaxilla to cranial vault (MxAl-F/Sp-Ba), and upper incisors to cranial vault (MxC-F/F-MxAl), we observed significant differences when comparing Evc2 m to control and comparing Evc2 cko to control, suggesting that Evc2 function in the neural crest-derived cells plays a vital role for the development of these tissues. For neurocranium to cranial base I (A-N/A-Ba), cranial base to Vault II (F-Pr/Pr-Pri), cranial vault to cranial base I (F-Pri/F-Ba), nasal bone to cranial base IV (A-N/Sp-Ba), and nasal bone to cranial vault (A-N/F-MxAl), we only detected significant differences (Table 4) between control and Evc2 m, but not between control and Evc2 cko. Overall, comparisons of the angular measurements between controls, Evc2 m, and Evc2 cko allow for the identification of the origins of the tissues leading to the angular abnormalities during skull development.
Table 4.
1: Control group, 2: Evc2 P0m, 3: Evc2m. Changes in angular measurements (degree only). Positive value indicates decrease in the latter sample comparing to former sample. Negative values indicate an increase in the latter sample comparing to former sample.
| Measurements | Group vs Group | Change in | p value | Measurements | Group vs Group | Change in | p value |
|---|---|---|---|---|---|---|---|
| degree | degree | ||||||
| A-N/A-Ba | 1-2 | -1.876 | # | A-N/Sp-Ba | 1-2 | -0.937 | # |
| 1-3 | -4.089 | ** | 1-3 | -5.997 | ** | ||
| 2-3 | -2.214 | # | 2-3 | -5.060 | * | ||
| A-F/A-Ba | 1-2 | -2.355 | ** | A-N/Sos-Ba | 1-2 | -4.404 | # |
| 1-3 | -7.439 | *** | 1-3 | -10.925 | ** | ||
| 2-3 | -5.084 | *** | 2-3 | -6.521 | * | ||
| N-F/F-Pr | 1-2 | 4.305 | ** | A-N/F-MxAl | 1-2 | -0.257 | # |
| 1-3 | 9.210 | *** | 1-3 | -4.306 | ** | ||
| 2-3 | 4.906 | *** | 2-3 | -4.049 | ** | ||
| F-Pr/Pr-Pri | 1-2 | 0.984 | # | MxAl-F/F-Ba | 1-2 | 4.665 | ** |
| 1-3 | 6.602 | *** | 1-3 | 11.063 | *** | ||
| 2-3 | 5.618 | *** | 2-3 | 6.398 | *** | ||
| F-Pri/F-Ba | 1-2 | -0.387 | # | MxC-F/F-Ba | 1-2 | 3.633 | ** |
| 1-3 | 2.430 | *** | 1-3 | 8.990 | *** | ||
| 2-3 | 2.817 | *** | 2-3 | 5.356 | *** | ||
| F-Pri/Sp-Ba | 1-2 | -1.017 | # | MxAl-F/F-Pri | 1-2 | 4.288 | ** |
| 1-3 | -0.971 | # | 1-3 | 13.504 | *** | ||
| 2-3 | 0.046 | # | 2-3 | 9.215 | *** | ||
| F-Pri/Sos-Ba | 1-2 | 0.379 | # | MxC-F/F-MxAl | 1-2 | -1.032 | ** |
| 1-3 | 1.736 | # | 1-3 | -2.074 | *** | ||
| 2-3 | 1.358 | # | 2-3 | -1.042 | ** | ||
| A-N/F-Ba | 1-2 | -4.408 | * | ||||
| 1-3 | -6.758 | *** | |||||
| 2-3 | -2.350 | # | |||||
N=5,
p>0.05;
p<0.05;
p<0.01;
p<0.001.
In addition to the linear and angular measurements, we also accessed the width to length ratios. These ratio calculations were taken by using two individuals in the anterior half of the skull and two individuals in the posterior half of the skull divided by the total skull length. For the ratio at the premaxilla level, we only detected significant differences (Fig 4 B) in the comparison between control and Evc2 m, but not in the comparison between control and Evc2 cko, suggesting that only Evc2 m bears a disproportionately wider skull at this level and Evc2 cko does not. For the ratios at the anterior of zygomatic level, posterior of zygomatic level and temporal level, we detected significant differences (Fig 4 C, D and E) within comparisons of control with Evc2 m and control with Evc2 cko, suggesting that both Evc2 m and Evc2 cko bear a disproportionately wider skull at these three levels.
Fig 4.
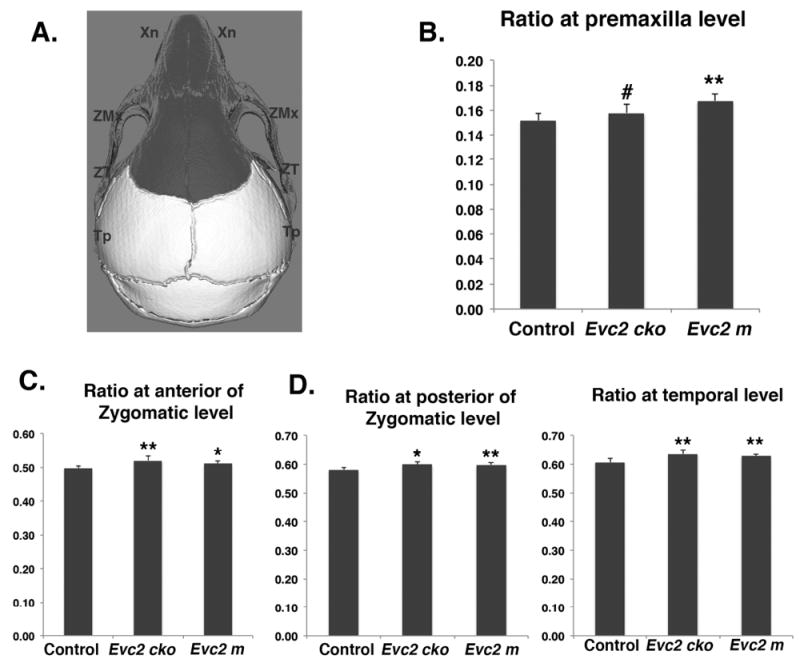
Width over length ratios of Evc2 mutant skulls at different levels. A. Diagram indicates the landmarks associated with width measurement. Areas with dark color are derived from neural crest cells. Width over length ratios at Premaxilla level (B), anterior of Zygomatic level (C), posterior of Zygomatic level (D) and temporal level (E) were shown. N=5, #, p>0.4; *, p<0.05; **, p<0.01.
To appreciate the overall skull differences in the anterior-posterior axis between control and Evc2 m and Evc2 cko, we generated the surface models for each genotype and superimposed the mutant skulls onto the control skulls (Fig. 5). Superimposition was anchored at the posterior end of the skull, because most of the deformities were identified in the anterior region. Consistent with the aforementioned linear and angular measurements, we observed most differences between control skulls and Evc2 m skulls in the anterior-posterior axis. Particularly, in the Evc2 m skull, an apparent shallow mid-facial region is observed. On the other hand, minimal differences in the mid-facial region are observed when comparing control skulls with Evc2 cko.
Fig 5.
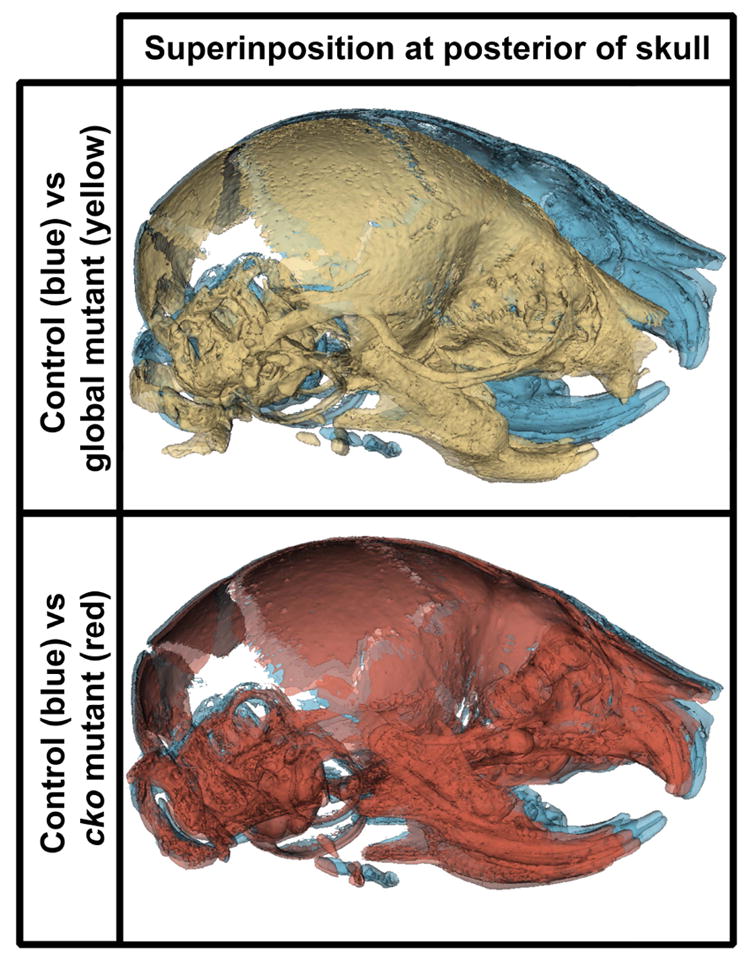
Superimpositions of skulls between controls and Evc2 cko and Evc2 m. A. Superimpositions of Evc2 m (yellow) with control skull (blue). B. Superimpositions of Evc2 cko (red) with control skull (blue).
DISCUSSIONS
Craniofacial abnormalities were previously documented and suggested by different EvC case studies (McKusick et al., 1964; Baujat and Le Merrer, 2007). To get more insight into how craniofacial development is affected in EvC syndrome, we carried out an investigation to understand the morphological abnormalities of EvC syndrome using 3D imaging software on Evc2 mutant mouse models. We also took advantage of a conditional deletion system to generate neural crest-specific Evc2 mutants, allowing us to trace the origin of morphological abnormalities during development. Overall, our studies demonstrated a more comprehensive analysis of the craniofacial morphological abnormalities and provided the developmental insight to appreciate the origin of these abnormalities.
EVC and EVC2, the proteins encoded by the two causative genes of EvC syndrome, form a protein complex at the base of primary cilium, which is mutually required for cilium localization and for transducing Hedgehog signaling (Dorn et al., 2012; Caparros-Martin et al., 2013). At postnatal day 8, Evc2 m exhibited smaller skull size compared to the control group. The gross morphology demonstrated in the Evc2 mutant mice is similar both to phenotypes of Evc mutant mice (Ruiz-Perez et al., 2007; Pacheco et al., 2012; Badri et al., 2016b) and to symptoms observed in EvC patients (Ellis and van Creveld, 1940; McKusick et al., 1964). These facts suggest that the molecular pathological mechanism leading to craniofacial abnormalities in Evc2 mutant mice is the same as those in Evc mutant mice and in EvC patients.
In the current studies, we identified that the skull length, nasal bone length, frontal bone length, incisor length, and total cranial base length are all significantly smaller in Evc2 m mutants than in controls at postnatal day 8. These observations are consistent with previous reports using different methods to study abnormal craniofacial development (Badri et al., 2016b) and abnormal tooth development (Zhang et al., 2015; Zhang et al., 2016). Our previous studies demonstrated that Evc2 is expressed in nearly all tissues in the skull (Badri et al., 2016a). Since the nasal and frontal bones are developmentally derived from neural crest cells, the reasonable speculation is that Evc2 function in the neural crest cells leads to shortened nasal and frontal bones. In contrast, the nasal bone length and frontal bone length in Evc2 cko mutants remain the same as in the controls. The efficient Cre recombination within the neural crest cells mediated by P0-Cre (data not shown) suggests that Evc2 function within the nasal and frontal bones does not play a major role in determining the length of these two bones.
In addition to the abnormalities detected in the mid facial region, we also detected a shortened cranial base. Our paired comparisons suggest that cranial base length is more severely affected in Evc2 global mutants (14.2% decrease) than in Evc2 cko (5.9% decrease). The cranial base is a midline structure which connects several bones in the cranial and facial regions (Nie, 2005). It has unique embryologic developmental origins, with the anterior region being derived from the neural crest and the posterior region from the mesoderm (Nie, 2005; McBratney-Owen et al., 2008). Consistently, at P8, we observed early closure of the intersphenoidal synchondrosis in Evc2 global mutants, but not in the Evc2 cko. Previous studies demonstrated that a shortening of the cranial base during development leads to a number of mid-facial abnormalities. For example, the retrognathic facial profile characteristic of Cretinism, Turner syndrome, and Down’s syndrome is due to reduced cranial base length (Israel et al., 1983; Jensen, 1985; Rongen-Westerlaken et al., 1992; Midtbo et al., 1996; Andersen et al., 2000; Quintanilla et al., 2002). Similar trends are also identified in Klinefelter syndrome and Williams’s syndrome (Mass and Belostoky, 1993; Brkic et al., 1994). Given the function of cranial base in mid-facial bone development, it is possible that the severely affected cranial base observed in the Evc2 global mutant mice leads to the shortened nasal and frontal bones during the early skull development. Currently we are carrying out studies to validate this possibility at different time points during post-natal skull development.
Additionally, we also observed that the widths at the zygomatic arch (both anterior and posterior regions) and the width at the temporal bone level are all significantly smaller compared to controls, while there are no differences in the width of the nasal bone at the premaxilla level. On the other hand, the decreased width is less likely due to the decreased size of the overall skull, because the ratios of the width to the skull length are all significantly increased in Evc2 m and Evc2 cko mutant mice.
Compared to controls, the skull from Evc2 m mutants showed increased interparietal length (Pr-Pri) and increased basioccipital length (Sos-Ba) (Fig 3 E), in contrast with decreased nasal bone length and frontal bone length. It is possible that these length increases are to compensate the decreased skull volume in the anterior region. However, in the Evc2 cko mutant, where we observed a similar mid-facial defect and decreased skull volume in the anterior head as in Evc2 m, we could not detect any increased interparietal length (Pr-Pri) and increased basioccipital length (Sos-Ba). It is possible that loss of Evc2 function in the non-neural crest-derived tissue promotes the over growth of these bones. Further genetic experiments to specifically delete Evc2 in the mesoderm-derived tissues are needed.
In conclusion, our study presents a comprehensive characterization of altered craniofacial development in the Evc2 mutant mice, and provides the developmental insight to appreciate the origin of each morphological abnormality.
Acknowledgments
This study is supported by the National Institutes of Health (R01DE019527 to Y. Mo. and R01DE020843 to Y. Mi.) and by Delta dental (to E.K.K). We want to thank Dr. Kaitrin Kramer for critical reading of the manuscript.
Footnotes
The authors declare no potential conflicts of interest.
LITERATURE CITED
- Andersen E, Sonnesen L, Kjaer MS, Fischer Hansen B, Kjaer I. The prenatal cranial base complex and hand in Turner syndrome. European journal of orthodontics. 2000;22:185–194. doi: 10.1093/ejo/22.2.185. [DOI] [PubMed] [Google Scholar]
- Badri MK, Zhang H, Ohyama Y, Venkitapathi S, Alamoudi A, Kamiya N, Takeda H, Ray M, Scott G, Tsuji T, Kunieda T, Mishina Y, Mochida Y. Expression of Evc2 in craniofacial tissues and craniofacial bone defects in Evc2 knockout mouse. Arch Oral Biol. 2016a;68:142–152. doi: 10.1016/j.archoralbio.2016.05.002. [DOI] [PMC free article] [PubMed] [Google Scholar]
- Badri MK, Zhang H, Ohyama Y, Venkitapathi S, Kamiya N, Takeda H, Ray M, Scott G, Tsuji T, Kunieda T, Mishina Y, Mochida Y. Ellis van Creveld2 is required for postnatal craniofacial bone development. Anat Rec (Hoboken) 2016b doi: 10.1002/ar.23353. [DOI] [PMC free article] [PubMed] [Google Scholar]
- Baujat G, Le Merrer M. Ellis-van Creveld syndrome. Orphanet J Rare Dis. 2007;2:27. doi: 10.1186/1750-1172-2-27. [DOI] [PMC free article] [PubMed] [Google Scholar]
- Brkic H, Kaic Z, Poje Z, Singer Z. Shape of the Craniofacial Complex in Patients with Klinefelter Syndrome. Angle Orthod. 1994;64:371–376. doi: 10.1043/0003-3219(1994)064<0371:SOTCCI>2.0.CO;2. [DOI] [PubMed] [Google Scholar]
- Caparros-Martin JA, Valencia M, Reytor E, Pacheco M, Fernandez M, Perez-Aytes A, Gean E, Lapunzina P, Peters H, Goodship JA, Ruiz-Perez VL. The ciliary Evc/Evc2 complex interacts with Smo and controls Hedgehog pathway activity in chondrocytes by regulating Sufu/Gli3 dissociation and Gli3 trafficking in primary cilia. Hum Mol Genet. 2013;22:124–139. doi: 10.1093/hmg/dds409. [DOI] [PubMed] [Google Scholar]
- Dorn KV, Hughes CE, Rohatgi R. A Smoothened-Evc2 complex transduces the Hedgehog signal at primary cilia. Dev Cell. 2012;23:823–835. doi: 10.1016/j.devcel.2012.07.004. [DOI] [PMC free article] [PubMed] [Google Scholar]
- Ellis RW, van Creveld S. A Syndrome Characterized by Ectodermal Dysplasia, Polydactyly, Chondro-Dysplasia and Congenital Morbus Cordis: Report of Three Cases. Arch Dis Child. 1940;15:65–84. doi: 10.1136/adc.15.82.65. [DOI] [PMC free article] [PubMed] [Google Scholar]
- Goor D, Rotem Y, Friedman A, Neufeld HN. Ellis-Van Creveld Syndrome in Identical Twins. Brit Heart J. 1965;27:797. doi: 10.1136/hrt.27.6.797. [DOI] [PMC free article] [PubMed] [Google Scholar]
- Hanemann JA, de Carvalho BC, Franco EC. Oral manifestations in Ellis-van Creveld syndrome: report of a case and review of the literature. J Oral Maxillofac Surg. 2010;68:456–460. doi: 10.1016/j.joms.2009.07.026. [DOI] [PubMed] [Google Scholar]
- Israel H, Johnson GF, Fierrobenitez R. Craniofacial Malformation among Endemic Cretins in Ecuador. J Cran Genet Dev Bio. 1983;3:3–10. [PubMed] [Google Scholar]
- Jensen BL. Craniofacial morphology in Turner syndrome. J Craniofac Genet Dev Biol. 1985;5:327–340. [PubMed] [Google Scholar]
- Mass E, Belostoky L. Craniofacial Morphology of Children with Williams Syndrome. Cleft Palate-Cran J. 1993;30:343–349. doi: 10.1597/1545-1569_1993_030_0343_cmocww_2.3.co_2. [DOI] [PubMed] [Google Scholar]
- McBratney-Owen B, Iseki S, Bamforth SD, Olsen BR, Morriss-Kay GM. Development and tissue origins of the mammalian cranial base. Dev Biol. 2008;322:121–132. doi: 10.1016/j.ydbio.2008.07.016. [DOI] [PMC free article] [PubMed] [Google Scholar]
- McKusick VA, Egeland JA, Eldridge R, Krusen DE. Dwarfism in the Amish I. The Ellis-Van Creveld Syndrome. Bull Johns Hopkins Hosp. 1964;115:306–336. [PubMed] [Google Scholar]
- Midtbo M, Wisth PJ, Halse A. Craniofacial morphology in young patients with Turner syndrome. European journal of orthodontics. 1996;18:215–225. doi: 10.1093/ejo/18.3.215. [DOI] [PubMed] [Google Scholar]
- Murgiano L, Jagannathan V, Benazzi C, Bolcato M, Brunetti B, Muscatello LV, Dittmer K, Piffer C, Gentile A, Drogemuller C. Deletion in the EVC2 gene causes chondrodysplastic dwarfism in Tyrolean Grey cattle. PLoS One. 2014;9:e94861. doi: 10.1371/journal.pone.0094861. [DOI] [PMC free article] [PubMed] [Google Scholar]
- Nie X. Cranial base in craniofacial development: developmental features, influence on facial growth, anomaly, and molecular basis. Acta Odontol Scand. 2005;63:127–135. doi: 10.1080/00016350510019847. [DOI] [PubMed] [Google Scholar]
- Pacheco M, Valencia M, Caparros-Martin JA, Mulero F, Goodship JA, Ruiz-Perez VL. Evc works in chondrocytes and osteoblasts to regulate multiple aspects of growth plate development in the appendicular skeleton and cranial base. Bone. 2012;50:28–41. doi: 10.1016/j.bone.2011.08.025. [DOI] [PubMed] [Google Scholar]
- Quintanilla JS, Biedma BM, Rodirguez MQ, Mora MTS, Cunqueiro MMS, Pazos MA. Cephalometrics in children with Down’s syndrome. Pediatr Radiol. 2002;32:635–643. doi: 10.1007/s00247-002-0703-x. [DOI] [PubMed] [Google Scholar]
- Rongen-Westerlaken C, vd Born E, Prahl-Andersen B, Rikken B, Teunenbroek V, Kamminga N, vd Tweel I, Otten BJ, Delamarre vd Waal HA, Drayer NM, et al. Shape of the craniofacial complex in children with Turner syndrome. J Biol Buccale. 1992;20:185–190. [PubMed] [Google Scholar]
- Ruiz-Perez VL, Blair HJ, Rodriguez-Andres ME, Blanco MJ, Wilson A, Liu YN, Miles C, Peters H, Goodship JA. Evc is a positive mediator of Ihh-regulated bone growth that localises at the base of chondrocyte cilia. Development. 2007;134:2903–2912. doi: 10.1242/dev.007542. [DOI] [PubMed] [Google Scholar]
- Ruiz-Perez VL, Ide SE, Strom TM, Lorenz B, Wilson D, Woods K, King L, Francomano C, Freisinger P, Spranger S, Marino B, Dallapiccola B, Wright M, Meitinger T, Polymeropoulos MH, Goodship J. Mutations in a new gene in Ellis-van Creveld syndrome and Weyers acrodental dysostosis. Nat Genet. 2000;24:283–286. doi: 10.1038/73508. [DOI] [PubMed] [Google Scholar]
- Ruiz-Perez VL, Tompson SW, Blair HJ, Espinoza-Valdez C, Lapunzina P, Silva EO, Hamel B, Gibbs JL, Young ID, Wright MJ, Goodship JA. Mutations in two nonhomologous genes in a head-to-head configuration cause Ellis-van Creveld syndrome. Am J Hum Genet. 2003;72:728–732. doi: 10.1086/368063. [DOI] [PMC free article] [PubMed] [Google Scholar]
- Susami T, Kuroda T, Yoshimasu H, Suzuki R. Ellis-van Creveld syndrome: Craniofacial morphology and multidisciplinary treatment. Cleft Palate-Cran J. 1999;36:345–352. doi: 10.1597/1545-1569_1999_036_0345_evcscm_2.3.co_2. [DOI] [PubMed] [Google Scholar]
- Takeda H, Takami M, Oguni T, Tsuji T, Yoneda K, Sato H, Ihara N, Itoh T, Kata SR, Mishina Y, Womack JE, Moritomo Y, Sugimoto Y, Kunieda T. Positional cloning of the gene LIMBIN responsible for bovine chondrodysplastic dwarfism. Proc Natl Acad Sci U S A. 2002;99:10549–10554. doi: 10.1073/pnas.152337899. [DOI] [PMC free article] [PubMed] [Google Scholar]
- Varela M, Ramos C. Chondroectodermal dysplasia (Ellis-van Creveld syndrome): a case report. European journal of orthodontics. 1996;18:313–318. doi: 10.1093/ejo/18.4.313. [DOI] [PubMed] [Google Scholar]
- Yamauchi Y, Abe K, Mantani A, Hitoshi Y, Suzuki M, Osuzu F, Kuratani S, Yamamura K. A novel transgenic technique that allows specific marking of the neural crest cell lineage in mice. Dev Biol. 1999;212:191–203. doi: 10.1006/dbio.1999.9323. [DOI] [PubMed] [Google Scholar]
- Zhang H, Takeda H, Tsuji T, Kamiya N, Kunieda T, Mochida Y, Mishina Y. Loss of Function of Evc2 in Dental Mesenchyme Leads to Hypomorphic Enamel. J Dent Res. 2016 doi: 10.1177/0022034516683674. 22034516683674. [DOI] [PMC free article] [PubMed] [Google Scholar]
- Zhang H, Takeda H, Tsuji T, Kamiya N, Rajderkar S, Louie KA, Collier C, Scott G, Ray M, Mochida Y, Kaartinen V, Kunieda T, Mishina Y. Generation of Evc2/Limbin global and conditional KO mice and its roles during mineralized tissue formation. genesis. 2015;53:612–626. doi: 10.1002/dvg.22879. [DOI] [PMC free article] [PubMed] [Google Scholar]