

Abstract
Objective
Glioblastoma multiforme (GBM) is an aggressive primary brain tumor with most dismal survival rates. This study aims to examine the prognostic value of primary tumor sites and race on survival outcomes.
Methods
Patient data obtained from the Scott & White Hospital Brain Tumor Registry (1976 to 2013) were stratified according to sex, age, race, primary tumor site, vital status, and survival rate.
Results
Of the 645 patients, 580 (89.9%) were diagnosed with GBM not otherwise specified (GBM NOS), 57 (8.8%) with GBM, and 8 (1.2%) with giant-cell GBM. The majority were male (53.5%), age 50 or older (78.7%). The white population had the highest GBM prevalence (87.1%) and the lowest overall survival rate vs. all other race groups (6.6% vs. 30.1%, p<0.01). The black population had a relatively low prevalence of GBM (5.9%) and the greatest overall survival rate vs. all others (47.4% vs. 7.3%, p<0.01). Primary tumor sites located in the temporal (25.8% vs. 20.2%, p=0.03), occipital (8.1% vs. 2.9%, p=0.05), and parietal lobes (24.2% vs. 20.8%, p=0.05) had a greater occurrence in surviving individuals. The overall survival for men vs. women was (62.9% vs. 37.1%, p=0.12).
Conclusions
Black racial background and temporal, occipital, or parietal primary tumor sites are suggestive of positive survival outcomes. Conversely, white racial background with primary tumor sites in the brain overlapping and NOS areas seem to be associated with negative outcomes and decreased survival. Thus, racial background and primary tumor site may be useful prognostic factors in GBM patients.
Keywords: Epidemiology, Glioblastoma, Prognostic Factors, Survival
Introduction
Primary brain tumors account for about 2% of all malignant neoplasms in adults. Approximately half of them represent gliomas. Glioblastoma multiforme (GBM) derived from neuro-epithelial cells is the most frequent and deadly primary malignant central nervous system (CNS) tumor in adults.1 GBM accounts for 60–70% of all gliomas in the adult population.2,3 According to the National Database of Central Brain Tumor Registry of the United States (CBTRUS), the age-adjusted GBM incidence rate is 3.97 cases per 100,000 for men and 2.53 cases per 100,000 for women. GBM cases represent about 20% of all primary CNS tumors in the adult population and about 75% of all anaplastic gliomas. Patients younger than 20 years of age have a lower incidence rate and frequency rapidly increases starting in the 5th decade of life.4
Epidemiologic studies of glioma have examined many risk factors over the past several decades; however, there are few consistent findings. GBM remains one of the most challenging treatment tasks in clinical oncology. Unfortunately, the median survival of patients with GBM treated only with the use of neurosurgical procedures and supportive care is 4.2 months.5 The median survival time after surgical treatment followed by chemo-radiation therapy also remains poor at 14.6 months.1 Radiation is the most effective treatment, with the notable exception of the chemotherapy drug temozolomide.4 Risk factors influencing survival include age, functional status (Karnofsky Performance Status Score), infiltrating nature, multidrug resistance, radio-resistance, an impermeable blood-brain barrier, a lack of preclinical models, extent of initial tumor resection, and genetic alterations.4,6–9 With this in mind, the currently combined therapeutic methods of radical surgical resection with adjuvant radio-chemotherapy is contributing to incremental improvements in survival and quality of life of patients with GBM.
To assess potentially novel predictors of GBM survival and the influence on the progression of disease, we analyzed our GBM data bank with a focus on the spatial relationships of race, age, sex, primary tumor site, and vital status of diagnosed patients.
Materials and Methods
Sources of data and study population
This study meets the National Institute of Health (NIH) and Baylor Scott & White Health Care Central Texas Institutional Review Board (IRB) guidelines. All human investigations were performed after approval by an IRB and in accordance with an assurance filed with and approved by the U.S. Department of Health and Human Services. Data were compared with the CBTRUS.
Patient data were obtained from the Scott & White Brain Tumor Registry (Temple, TX). GBM diagnoses were considered definitive when obtained through surgical biopsy, resection, and final histological examination. The data were stratified according to sex, age groups (0–20, 21–30, 31–40, 41–50, 51–60, 61–70, 71–80, 81–90, 91 and older), race (white, black, Hispanic, others/unknown), primary site of the tumor (frontal lobe, parietal lobe, temporal lobe, occipital lobe, brain overlapping, brain not otherwise specified (NOS), cerebrum, spinal cord (SC), corpus callosum (CC), brain stem (BS), and thalamus), vital status (subsistent or deceased), and overall survival in years. The Third Edition of the International Classification of Diseases for Oncology was used to categorize GBM by histology into GBM NOS, GBM, and giant-cell GBM.
Statistical analysis
Descriptive statistics, including means standard deviation (SDs) and frequencies (percentages) were used to describe patient characteristics (age, gender, race, GBM type, and primary tumor site), and survival status. Bivariate analyses assessed underlying differences in characteristics and overall survival among patients. Chi-square analysis (Fisher’s exact tests for small-expected cell counts) was employed to compare categorical variables and the nonparametric Wilcoxon rank-sum and Kruskal-Wallis tests were employed for continuous measures. All analyses were performed in SAS v9.2 (Cary, NC). A type I error of 0.05 was assumed throughout.
Results
A total of 645 patients were identified with a diagnosis of GBM reported between 1976 and 2013. Demographic characteristics for all ages and for children ages 0–20 were obtained from Scott & White Brain Tumor Registry in Central Texas. 1.1% of all patients were younger than 20 years of age at the time of diagnosis. 21.2% were under the age of 50 and 78.7% were 50 years of age or older. 53.5% of all examined GBM cases occurred in males and 46.5% in females.
Distribution of GBM by Histology and Primary Site
First, we determined the distribution of GBM by histology as shown in Table 1, 2. Of the 645 evaluated cases, 580 were GBM NOS (89.9%), 57 were GBM (8.8%) and 8 were giant cell GBM (1.2%). The distribution of GBM by primary tumor site is shown in Table 1, 2 and Figure 2B. The most common primary site was in the frontal lobe (28.5%), followed by parietal lobe (21.1%), temporal lobe (20.8%), brain overlapping (9.9%), and brain NOS (9.8%). Ten percent of total GBM cases were located within the occipital lobe (3.4%), cerebrum (2.8%), spinal cord (2.2%), corpus callosum (1.1%), brain stem (0.3%), and thalamus (0.2%).
Table 1.
Patient characteristics, overall and by GBM type (NOS, multiforme, & giant-cell; N=645). 645 cases were evaluated. Distribution by histology: 89.9% of total diagnosed white patients were classified as GBM, NOS. 8.8% were GBM, and just 1.2% were giant cell GBM. Prevalence by sex: 53.5% of GBM diagnosed were males, and 46.5% were females. Prevalence by race: 87.1% of patients were white, 5.9% were black, 4.2% were Hispanic, and 2.8% were other/unknown. Distribution of GBM by primary tumor site: 20.8% of diagnosed patients have a GBM located in temporal lobe, 28.5% in frontal, 21.1% in parietal lobe, 10.1% in brain overlapping area, 9.6% in brain NOS, 3.4% in occipital lobe, 2.8% in cerebrum, 2.2% in SC, 1.1% in CC, 0.3% in BS, and 0.2% in thalamus.
| Patient Characteristics |
Study Sample (N=645) N (%) |
NOS (N=580, 89.9%) N (%) |
Multiforme (N=57, 8.8%) N (%) |
Giant Cell (N=8, 1.2%) N (%) |
P-value |
|---|---|---|---|---|---|
| Age Mean (SD): | 61.6 (14.5) | 62.0 (14.4) | 60.4 (14.2) | 39.3 (7.2) | <0.01 |
| Median (Min-Max): | 64.0 (4–96) | 64.0 (4–95) | 60.0 (36–96) | 37.5 (33–49) | |
| Female | 300 (46.5) | 271 (46.7) | 25 (43.9) | 4 (50.0) | 0.90 |
| Race | |||||
| White | 562 (87.1) | 517 (89.1) | 38 (66.7) | 7 (87.5) | <0.01 |
| Hispanic | 27 (4.2) | 24 (4.1) | 3 (5.3) | 0 (0.0) | 0.77 |
| Black | 38 (5.9) | 27 (4.7) | 11 (19.3) | 0 (0.0) | <0.01 |
| Other/Unknown | 18 (2.8) | 12 (2.1) | 5 (8.8) | 1 (12.5) | <0.01 |
| Primary Site | |||||
| Temporal lobe | 134 (20.8) | 123 (21.2) | 11 (19.3) | 0 (0.0) | 0.03 |
| Frontal lobe | 184 (28.5) | 159 (27.4) | 18 (31.6) | 7 (87.5) | <0.01 |
| Parietal lobe | 136 (21.1) | 125 (21.6) | 11 (19.3) | 0 (0.0) | 0.31 |
| Occipital lobe | 22 (3.4) | 20 (3.5) | 1 (1.8) | 1 (12.5) | 0.29 |
| Brain, overlapping | 65 (10.1) | 62 (10.7) | 3 (5.3) | 0 (0.0) | 0.27 |
| Brain, NOS | 62 (9.6) | 54 (9.3) | 8 (14.0) | 0 (0.0) | 0.33 |
| Cerebrum | 18 (2.8) | 18 (3.1) | 0 (0.0) | 0 (0.0) | 0.35 |
| SC | 14 (2.2) | 14 (2.4) | 0 (0.0) | 0 (0.0) | 0.45 |
| CC | 7 (1.1) | 2 (0.3) | 5 (8.8) | 0 (0.0) | <0.01 |
| BS | 2 (0.3) | 2 (0.3) | 0 (0.0) | 0 (0.0) | 0.89 |
| Thalamus | 1 (0.2) | 1 (0.2) | 0 (0.0) | 0 (0.0) | 0.95 |
| Year Mean (SD): | 2001 (9.2) | 2000 (9.2) | 2010 (1.5) | 2005 (9.0) | <0.01 |
| Median (Min-Max): | 2003 (1976–2013) | 2001 (1976–2013) | 2009 (2007–2013) | 2011 (1994–2013) | |
| Died | 583 (90.4) | 537 (92.6) | 39 (68.4) | 7 (87.5) | <0.01 |
Table 2.
Survival and mortality rates comparison in association with age, sex, race, histology, and primary tumor location (N=645). Overall average for survivors was 9.6% of the sample. Among survivors, males (62.9%), females (37.1%), most prevalent locations were temporal lobe (25.8%), parietal lobe (24.2%), and occipital lobe (8.1%). Overall average for deceased patients was 90.4%. Among deceased, mortality was greater for brain overlapping (10.6%), brain NOS (10.1%), and frontal lobe (28.8%). Locations in SC (14 cases), BS (2 cases), thalamus (1 case) resulted in death. Significantly high mortality rate was in white population (59.7% vs. 90.1%, p<0.01). Significantly high survival rate was in black population (29.0% vs. 3.4%, p<0.01), when compared survived vs. deceased.
| Patient Characteristics |
Study Sample (N=645) N (%) |
Survived (N=62, 9.6%) N (%) |
Died (N=583, 90.4%) N (%) |
P-value |
|---|---|---|---|---|
| Age Mean (SD): | 61.6 (14.5) | 52.3 (14.4) | 62.6 (14.2) | <0.01 |
| Median (Min-Max): | 64.0 (4–96) | 49.0 (27–85) | 64.0 (4–96) | |
| Female | 300 (46.5) | 23 (37.1) | 277 (47.5) | 0.12 |
| Race | ||||
| White | 562 (87.1) | 37 (59.7) | 525 (90.1) | <0.01 |
| Hispanic | 27 (4.2) | 5 (8.1) | 22 (3.8) | 0.17 |
| Black | 38 (5.9) | 18 (29.0) | 20 (3.4) | <0.01 |
| Other/Unknown | 18 (2.8) | 2 (3.2) | 16 (2.7) | 0.69 |
| Histology | <0.01 | |||
| NOS | 580 (89.9) | 43 (69.4) | 537 (92.1) | |
| Multiforme | 57 (8.8) | 18 (29.0) | 39 (6.7) | |
| Giant Cell | 8 (1.2) | 1 (1.6) | 7 (1.2) | |
| Primary Site | ||||
| Temporal lobe | 134 (20.8) | 16 (25.8) | 118 (20.2) | 0.03 |
| Frontal lobe | 184 (28.5) | 16 (25.8) | 168 (28.8) | 0.62 |
| Parietal lobe | 136 (21.1) | 15 (24.2) | 121 (20.8) | 0.05 |
| Occipital lobe | 22 (3.4) | 5 (8.1) | 17 (2.9) | 0.05 |
| Brain, overlapping | 65 (10.1) | 3 (4.8) | 62 (10.6) | 0.15 |
| Brain, NOS | 62 (9.6) | 3 (4.8) | 59 (10.1) | 0.18 |
| Cerebrum | 18 (2.8) | 3 (4.8) | 15 (2.6) | 0.40 |
| SC | 14 (2.2) | 0 (0.0) | 14 (2.4) | 0.38 |
| CC | 7 (1.1) | 1 (1.6) | 6 (1.0) | 0.51 |
| BS | 2 (0.3) | 0 (0.0) | 2 (0.3) | 1.00 |
| Thalamus | 1 (0.2) | 0 (0.0) | 1 (0.2) | 1.00 |
| Year Mean (SD): | 2001 (9.2) | 2010 (3.9) | 2000 (9.2) | <0.01 |
| Median (Min-Max): | 2003 (1976–2013) | 2011 (1988–2013) | 2001 (1976–2013) |
Figure 2. Comparative analyses between total GBM diagnosed population, group of deceased, and subsistent patients based on race, primary tumor site distribution.
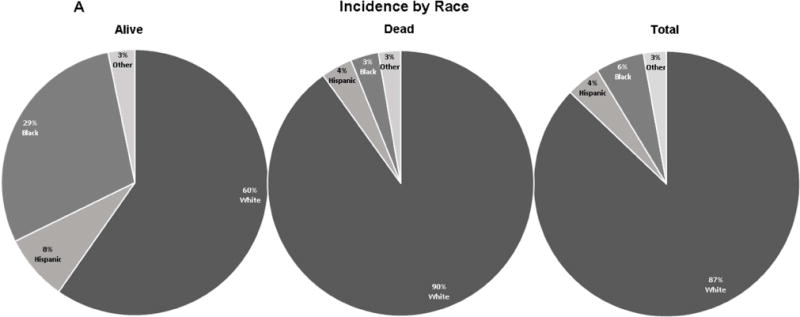
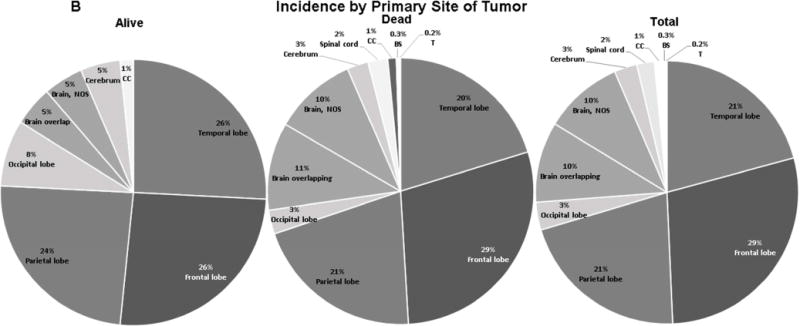
A. Comparative analysis based on prevalence by race. The GBM prevalence in subsistent vs. deceased GBM treated patients was 59.7% vs. 90.1% in white, 29.0% vs. 3.4% in black, 8.1% vs. 3.8% in Hispanic, and 3.2% vs. 2.7% in other/unknown. B. Comparative analysis based on primary tumor site. The GBM prevalence in subsistent vs. deceased group of patients in descending order was 25.8% vs. 28.8% in frontal lobe, 25.8% vs. 20.2% in temporal lobe, 24.2% vs. 20.8% in parietal lobe, 8.1% vs. 2.9% in occipital lobe, 4.8% vs. 10.6% in brain overlapping, 4.8% vs. 10.1% in brain NOS, 4.8% vs. 2.6% in cerebrum, 1.6% vs. 1.0% in CC, 0.0% vs. 2.4% in SC, 0.0% vs. 0.3% in BS, 0.0% vs. 0.2% in thalamus.
Prevalence by Age
A difference was found in prevalence between the nine age groups. Of the 645 GBM cases, 1.1% occurred in patients 0–19 years of age and the remaining 638 (98.9%) occurred in patients 20 years of age or older. Higher occurrence of disease, in descending order, occurred in patients aged 61–70 (28.5%), 71–80 (24.3%), 51–60 (19.9%), and 41–50 (14.3%) (Table 1, 2). Lower prevalence was observed in age groups 81–90 (5.4%), 31–40 (4.2%), 21–30 (1.6%), 0–20 (1.2%), and 91 and older (0.6%).
Prevalence by Sex
No significant gender-specific predilections of GBM were observed. Of the 645 cases, 345 were male (53.5%) and 300 were female (46.5%), resulting in similar disease prevalence in both genders. (Table 1, 2).
Prevalence by Race
The prevalence of GBM in our sample was significantly higher in white patients than in black, Hispanic or others/unknown (Table 1, 2 and Figure 2A). Among the four evaluated racial groups, 562 cases were white (87.1%), 38 cases were black (5.9%), 27 cases were Hispanic (4.2%), and 18 cases were in other racial groups (2.8%).
Prevalence by Vital Status
Sub-analysis of vital status prevalence of GBM is presented in Table 2. Vital status was analyzed in four racial groups. Of the 645 cases, 583 patients (90.4%) perished before data analysis in 2013, regardless of treatment. Only 62 patients (9.6%) were still alive at the time of data analysis.
GBM Distribution among White Patients
Of the 562 cases observed in white patients, 517 were diagnosed with GBM NOS (92.0%), 38 were with GBM (6.8%), and 7 with giant-cell GBM (1.2%) (Table 1).
Distribution of GBM in the white population by primary site of tumor was similar and insignificant when compared with the total GBM diagnosed population. Primary tumors were less commonly found in the frontal lobe among white individuals when compared with non-white population (27.1% vs. 40.6%, p=0.01).
When the prevalence of GBM was stratified by age, we observed 1.1% of cases occurring in patients under 20 years of age and 98.9% were among patients 20 years or older (Figure 1). The effect of gender on GBM occurrence in the white population aligns with that found in the total diagnosed. Of the 562 cases, 301 were male (53.6%) and 261 were female (46.4%), resulting in similar disease prevalence in both genders.
Figure 1. Distribution, prevalence and survival rate among white GBM diagnosed patients.
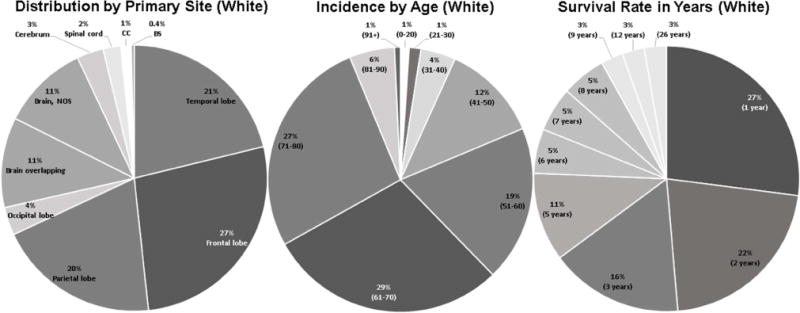
Distribution by primary tumor site: 27.1% of all GBM in white population were located in frontal lobe, 21.2% of all were in temporal lobe, 19.8% in parietal, 11.0% in brain overlapping, 10.6% in brain NOS, 3.4% in occipital lobe, 3.2% in cerebrum, 2.2% in SC, 1.3% in CC, and 0.4% in BS. Prevalence by age: among white patients, 29.2% were 61–70 years of age, 26.9% were 71–80, 19.0% were 51–60, 11.9% were 41–50, 5.5% were 81–90, 4.3% were 31–40, 1.4% were 21–30, 1.1% were 0–20, and 0.7% were 91 years or older, respectively. Distribution based on survival rate in years since first diagnosed: 2.7% of white were still living in each group after 26, 12, and 9 years since first time diagnosed, 5.4% after 8, 7, and 6 years each, 10.8% after 5 years, 16.2% after 3 years, 21.6% after 2 years, and 27.0% after 1 year.
Vital status evaluation revealed a lower survival among white patients when compared with non-white patients (6.6% vs. 30.1%, p<0.01) (Table 2). Figure 1 represents survival rate in years (percent representation of diagnosed with brain tumor patients which still alive) from the time of initial diagnosis. As a result, 27.0% of living patients survived for 1 year after treatment, 21.6% for 2 years, 16.2% for 3 years, 10.8% for 5 years, 5.4% survived for 6, 7 and 8 years each, and just 2.7% for 9, 12, and 26 years each.
Comparative Analyses Based on Race, Primary Site of Tumor, and Sex in Subsistent, Deceased, and in Total GBM Diagnosed Populations
To better understand the observed survival trend found in the white population in relation to the other racial groups, we analyzed the prevalence of GBM by race, primary site of tumor, and distribution by sex among surviving individuals (alive patients at the time of data analysis) and the total GBM diagnosed population.
A side-by-side comparison based on race between surviving, deceased, and the total sample is shown in Figure 2A. These data show a discrepancy in the number of surviving white versus non-white individuals (6.6% vs. 30.1%, p<0.01). This is significant considering only 37 white individuals survived of the total 562 diagnosed (Table 2).
Another significant finding was the survival rate of black vs. non-black patients (47.4% vs. 7.3%, p<0.01) (Figure 2A, Table 2). Our black sample showed a relatively low overall prevalence of disease (5.9%) compared with the white population (87.1%). Additionally, they have the highest survival rate among all analyzed race groups (Figure 2A).
The Hispanic and the other/unknown groups showed lower, but favorable survival rates of 18.5% vs. 9.2% (for Hispanic vs. non-Hispanic) and of 11.1% vs. 9.6% (for Other/Unknown vs. non-Other/Unknown).
When primary tumor sites in surviving individuals were compared with those in the deceased group (Figure 2B), we found that the greatest survival rates occurred when tumors were located in the temporal (25.8% vs. 20.2%, p=0.03), occipital (8.1% vs. 2.9%, p=0.05), and parietal lobes (24.2% vs. 20.8%, p=0.05) (Table 2). When primary tumor sites in surviving patients were compared with other locations (Table 1, Table 2), temporal lobe vs. other locations (11.9% vs. 9.0%, p=0.03), frontal lobe (8.7% vs. 10.0%, p=0.62), parietal (11.0% vs. 9.2%, p=0.53), occipital lobe (22.7% vs. 9.2%, p=0.05), brain overlapping (4.6% vs. 10.2%, p=0.15), brain NOS (4.8% vs. 10.1%, p=0.18), cerebrum (16.7% vs. 9.4%, p=0.40), spinal cord (0.0% vs. 9.8%, p=0.38), corpus callosum (14.3% vs. 9.6%, p=0.51), brain stem (0.0% vs. 9.6%, p=1.00), and thalamus (0.0% vs. 9.6%, p=1.00), we found significantly greater survival rates occurred with tumors located in occipital lobe (22.7% vs. 9.2%, p=0.05) (Table 2). Conversely, we found lower survival rates when comparing brain overlapping and brain NOS with other locations in surviving (4.6% vs. 10.8%, p=0.15) and deceased (4.8% vs. 10.1%, p=0.18) patients (Figure 2B, Table 1, 2).
Comparative analysis of gender related differences between surviving, deceased, and total sample are shown in Table 2. We found that overall survival rate for men was greater than for women (62.9% vs. 37.1%, p=0.12), but this was not found to be statistically significant.
Discussion
In this study, we examined the value of tumor primary site distribution, racial relationships, gender, and age-associated influence in relation to prognostic significance among GBM patient survival.
We observed that the primary tumor sites associated with greater survival were located in the temporal, occipital, and parietal lobes. These findings are consistent with results showing statistically significant longer survival in these sites.10 Meanwhile, locations with poorer survival rates were brain overlapping and brain NOS. This may be due to the fact treatment may be complicated due to posterior extension into areas such as the optic chiasm and midbrain, limiting the extent of radiation treatment and surgical resection.11 The greater percentage of deceased individuals diagnosed with overlapping tumors could be explained by their wide extent of critical parenchymal involvement.12
In newly diagnosed patients, the extent of the resection has been shown to carry prognostic value.13,14 However, certain tumor locations, such as eloquent cortex, basal ganglia, BS, or SC are not amenable to surgical intervention and these patients typically exhibit a worse prognosis. Recent breakthroughs in nanoparticle technology have proven effective in delivering chemotherapy to GBM tumor stem cell in the mouse model.15 This treatment could prove helpful in the case of tumors that are situated in such location.
A previous study described a correlation between GBM involving the sub-ventricular zone (SVZ).16 These findings implicate the existence of an aggressive GBM subtype that may be related to the recruitment of neuronal stem like cells in the SVZ.17 This is supported by experiments showing a higher migration potential of SVZ neuronal progenitor cells, and therefore, reflects on aggressiveness of GBM and overall survival.18,19 Approximately 50% of GBM patients treated with alkylating agents have been shown to have prolonged progression-free and overall survival.20,21
According to national statistical reports, GBM was identified as the most common CNS tumor subtype for black individuals in the age groups of 35–49, 50–64, 65–79, and 80+, accounting for 34%, 58%, 60%, and 54% of cases, respectively.22 In our study, black individuals have lower prevalence of GBM (5.9%) when compared with the white population (87.1%), and the black population had the greatest survival rate (47.4%) when compared with other racial groups. These data pertaining to Central Texas are above the national average. This may be due to the fact that the population of black individuals in Central Texas counties averages to be 8% with a range between 1.8% and 21.5%.23 However, a greater percentage of African American adults aged 18–64 years are without health insurance compared with the white population.24 This may hinder access to care and thus many ailments within the black community may go unreported.
The CBTRUS report represents the national rate of GBM relative survival, which estimates that less than 5% of patients survive five years post diagnosis. Our data presents evidence that the relative survival in Central Texas is 9.6% for all GBM diagnosed patients and 6.6% for the white population, which is well above the national average.
Relatively low survival rates in our white sample appears to be partly due to the relatively high survival rates observed in black and Hispanic populations, which are 47.4% and 18.5%, respectively. The vast majority of glioma cases are idiopathic in origin. Demographic differences in incidence by race, sex, and country suggest that genetics, hormones, and environmental risk factors may play a role in GBM. In line with this theory, a history of diabetes has been shown to lower the risk of glioma by 42%.22,25 However, study bias (e.g., participation, information, and survival), variations in health care access/utilization, residual confounders, and other unrealized influences may explain the differences in GBM incidence.26 An example of this is the greater mortality among Medicaid patients compared with those insured under Medicare.27 In a study of white and black individuals in Washington, DC around the time of the Civil Rights Movement, gliomas appeared to twice as frequently in white people than in black individuals, with a white to black case ratio of 12.1:1.28 However, when subdivided into pre and post-Civil Rights Movement, there is a clear increase in the percentage of cases of gliomas in black population. The initial ratio being 13.7:1 and decreasing to 9:1. The ratio of white to black cases for GBM was 15.5:1. This is likely a direct result of improved access to healthcare and diagnostic evaluation, producing a higher incidence and prevalence.27 However, the data still suggest that there is a genetic component at play.28 A more recent study showed that white individuals still have twice the incidence in comparison to black individuals nationwide.27 In addition, there is a controversy in the literature related to survival advantage for black individuals where it was found that they have a higher rate of survival at 60 months post-diagnosis.17,28 In the same study, gliomas were twice as prevalent in men as in women in both races.28 The CBTRUS report found that there was a higher incidence in the northeast and an overall lower incidence in the south-central region of the United States.27
Based on CBTRUS report, GBM is 1.57 times more common in males,29 which is in contrast to our data obtained in Central Texas. Males were also shown to be more likely to survive the first year after diagnosis, but had no advantage in subsequent years.27 Our data show that males have a 53.5% prevalence rate of GBM compared with 46.5% in females.
The CBTRUS report shows that the incidence of GBM increases with age, with rates highest in individuals between 75 and 84 years of age. However, our data suggest that prevalence of GBM is highest in the 61–70 age group. These results imply a peak prevalence of GBM among a relatively younger population in Central Texas than the national average. One potential explanation is based on obesity rates. It has been suggested that increased BMI and lack of physical activity during adolescence is correlated with increased risk of glioma.30 In Texas, 30% of women are obese compared with 28.5% of men.31 However, the distribution of obesity in the United States is 40.6% amongst women and 37.5% among men.32 This suggests that differences in obesity rates may not be a significant factor in explaining the discrepancy in men and women with GBM between Texas and U.S. populations.
The most common identified carcinogens include pesticides, herbicides, nitrosamines, petrochemical substances, electromagnetic irradiation, and vinyl chloride. However, the role of these pro-carcinogenic factors has not been unequivocally proven.3,33 Among potential carcinogens, therapeutic X-irradiation was the only definitive carcinogen found in an international meta-analysis study.3
Data suggest that GBM can be subdivided into distinct subtypes based on molecular expression. Epidermal growth factor receptor (EGFR), neurofibromatosis-related protein 1 (NF1), and platelet-derived growth factor receptor alpha (PDGFRA)/Isocitrate dehydrogenase 1 (IDH1) mutations each define classical, mesenchymal, and proneural subtypes of GBM, respectively.34 The neural subtype predominated in the frontal lobe and the mesenchymal subtypes predominated in the temporal lobe. Proneural and classical subtypes were found to be common in the frontal and temporal lobe.2,35,36 The p53 mutant-containing tumors occurred predominantly around the lateral ventricles in the frontal lobe.37 Thus, our results correlate with previously noted decreased malignancy shown in frontal lobe GBMs. These distinctions are important because they may account for the differences seen in prognosis in tumors that are histologically similar.
Future epidemiologic studies would benefit through improved measures of environmental exposures, more precise statistical methods for detecting interaction effects.38
Limitations
Considering the fact of historical medical data included in this study, confirmed MRI imaging may not performed for all patients, which is a limitation for this study. Scott and White Hospital Brain Tumor Registry has a large number of GBM NOS cases, and lack of socio-economic status of the patients, including insurance/rates related information, which is considered to be a limitation for this study.
Conclusion
The key epidemiologic determinants found to be important to negatively impact survival of GBM diagnosed patients include advanced age, primary tumor sites located in brain overlapping and brain NOS, Caucasian race, and female gender.
The important epidemiologic factors found to most likely confer long term survival of GBM diagnosed patients include young age, primary tumor sites located in temporal, occipital, or parietal lobes, black race, and male gender.
This epidemiological study can serve as a basis for future research in this area and offers insights into the race dependent GBM distribution and disease outcomes.
Acknowledgments
Funding Statement
This work was supported, in part, by NIH-R01-NS-067435 (JHH) and Baylor Scott & White Healthcare Plummer Chair’s Fund (JHH).
Footnotes
Publisher's Disclaimer: This is a PDF file of an unedited manuscript that has been accepted for publication. As a service to our customers we are providing this early version of the manuscript. The manuscript will undergo copyediting, typesetting, and review of the resulting proof before it is published in its final citable form. Please note that during the production process errors may be discovered which could affect the content, and all legal disclaimers that apply to the journal pertain.
Conflict of Interest Statement
The authors declare no conflicts of interest relevant to this work.
Disclosures
None.
References
- 1.Stupp R, Mason WP, van den Bent MJ, et al. Radiotherapy plus concomitant and adjuvant temozolomide for glioblastoma. N Engl J Med. 2005;352(10):987–996. doi: 10.1056/NEJMoa043330. [DOI] [PubMed] [Google Scholar]
- 2.Li R, Li H, Yan W, et al. Genetic and clinical characteristics of primary and secondary glioblastoma is associated with differential molecular subtype distribution. Oncotarget. 2015;6(9):7318–7324. doi: 10.18632/oncotarget.3440. [DOI] [PMC free article] [PubMed] [Google Scholar]
- 3.Ohgaki H, Kleihues P. Epidemiology and etiology of gliomas. Acta neuropathological. 2005;109(1):93–108. doi: 10.1007/s00401-005-0991-y. [DOI] [PubMed] [Google Scholar]
- 4.Furnari FB, Fenton T, Bachoo RM, et al. Malignant astrocytic glioma: genetics, biology, and paths to treatment. Genes Dev. 2007;21(21):2683–2710. doi: 10.1101/gad.1596707. [DOI] [PubMed] [Google Scholar]
- 5.Arvold ND, Reardon DA. Treatment options and outcomes for glioblastoma in the elderly patient. Clin Interv Aging. 2014;9:357–367. doi: 10.2147/CIA.S44259. [DOI] [PMC free article] [PubMed] [Google Scholar]
- 6.Lamborn KR, Chang SM, Prados MD. Prognostic factors for survival of patients with glioblastoma: recursive partitioning analysis. Neuro Oncol. 2004;6(3):227–235. doi: 10.1215/S1152851703000620. [DOI] [PMC free article] [PubMed] [Google Scholar]
- 7.Stark AM, van de Bergh J, Hedderich J, Mehdorn HM, Nabavi A. Glioblastoma: clinical characteristics, prognostic factors and survival in 492 patients. Clin Neurol Neurosurg. 2012;114:840–845. doi: 10.1016/j.clineuro.2012.01.026. [DOI] [PubMed] [Google Scholar]
- 8.Weller M, Pfister SM, Wick W, Hegi ME, Reifenberger G, Stupp R. Molecular neuro-oncology in clinical practice: a new horizon. Lancet Oncol. 2013;14(9):e370–e379. doi: 10.1016/S1470-2045(13)70168-2. [DOI] [PubMed] [Google Scholar]
- 9.Kanu O, Hughes B, Di C, et al. Glioblastoma multiforme oncogenomics and signaling pathways. Clin Med Oncol. 2009;3:39–52. doi: 10.4137/cmo.s1008. [DOI] [PMC free article] [PubMed] [Google Scholar]
- 10.Simpson JR1, Horton J, Scott C, et al. Influence of location and extent of surgical resection on survival of patients with glioblastoma multiforme: results of three consecutive Radiation Therapy Oncology Group (RTOG) clinical trials. Int J Radiat Oncol Biol Phys. 1993;26(2):239–244. doi: 10.1016/0360-3016(93)90203-8. [DOI] [PubMed] [Google Scholar]
- 11.Yuile P, Dent O, Cook R, Biggs M, Little N. Survival of glioblastoma patients related to presenting symptoms, brain site and treatment variables. J Clin Neurosci. 2006;13(7):747–751. doi: 10.1016/j.jocn.2005.10.011. [DOI] [PubMed] [Google Scholar]
- 12.Wallner KE, Galicich JE, Krol G, Arbit E, Malkin MG. Patterns of failure following treatment for glioblastoma multiforme and anaplastic astrocytoma. Int J Radiat Oncol Biol Phys. 1989;16(6):1405–1409. doi: 10.1016/0360-3016(89)90941-3. [DOI] [PubMed] [Google Scholar]
- 13.Stummer W, Novotny A, Stepp H, Goetz C, Bise K, Reulen HJ. Fluorescence-guided resection of glioblastoma multiforme by using 5-aminolevulinic acid-induced porphyrins: a prospective study in 52 consecutive patients. J Neurosurg. 2000;93(6):1003–1013. doi: 10.3171/jns.2000.93.6.1003. [DOI] [PubMed] [Google Scholar]
- 14.Stummer W, Reulen HJ, Meinel T, et al. Extent of resection and survival in glioblastoma multiforme: identification of and adjustment for bias. Neurosurgery. 2008;62(3):564–576. doi: 10.1227/01.neu.0000317304.31579.17. [DOI] [PubMed] [Google Scholar]
- 15.Cheng Y, Morshed R, Cheng SH, et al. Nanoparticle-programmed self-destructive neural stem cells for glioblastoma targeting and therapy. Small. 2013;9(24):4123–4129. doi: 10.1002/smll.201301111. [DOI] [PMC free article] [PubMed] [Google Scholar]
- 16.Lim DA, Cha S, Mayo MC, et al. Relationship of glioblastoma multiforme to neural stem cell regions predicts invasive and multifocal tumor phenotype. Neuro Oncol. 2007;9(4):424–429. doi: 10.1215/15228517-2007-023. [DOI] [PMC free article] [PubMed] [Google Scholar]
- 17.Adeberg S, König L, Bostel T, et al. Glioblastoma recurrence patterns after radiation therapy with regard to the subventricular zone. Int J Radiat Oncol Biol Phys. 2014;90(4):886–893. doi: 10.1016/j.ijrobp.2014.07.027. [DOI] [PubMed] [Google Scholar]
- 18.Aguirre A, Gallo V. Postnatal neurogenesis and gliogenesis in the olfactory bulb from NG2-expressing progenitors of the subventricular zone. J Neurosci. 2004;24(46):10530–10541. doi: 10.1523/JNEUROSCI.3572-04.2004. [DOI] [PMC free article] [PubMed] [Google Scholar]
- 19.Pina Batista KM, Vega IF, de Eulate-Beramendi SA, et al. Prognostic significance of the markers IDH1 and YKL40 related to the subventricular zone. Folia Neuropathol. 2015;53(1):52–59. doi: 10.5114/fn.2015.49974. [DOI] [PubMed] [Google Scholar]
- 20.Esteller M, Toyota M, Sanchez-Cespedes M, et al. Inactivation of the DNA repair gene O6-methylguanine-DNA methyltransferase by promoter hypermethylation is associated with G to A mutations in K-ras in colorectal tumorigenesis. Cancer Res. 2000;60(9):2368–2371. [PubMed] [Google Scholar]
- 21.Hegi ME, Diserens A-C, Gorlia T, et al. MGMT gene silencing and benefit from temozolomide in glioblastoma. N Engl J Med. 2005;352(10):997–1003. doi: 10.1056/NEJMoa043331. [DOI] [PubMed] [Google Scholar]
- 22.Gabriel A, Batey J, Capogreco J, et al. Adult Brain Cancer in the U.S. Black Population: A Surveillance, Epidemiology, and End Results (SEER) Analysis of Incidence, Survival, and Trends. Med Sci Monit. 2014;20:1510–1517. doi: 10.12659/MSM.890762. [DOI] [PMC free article] [PubMed] [Google Scholar]
- 23.2010 Census. U.S. Census Bureau 2010
- 24.CDC. Health Disparities and Inequalities Report — United States, 2013. Centers for Disease Control and Prevention; 2013. [Google Scholar]
- 25.Kitahara CM, Linet MS, Brenner AV, et al. Personal history of diabetes, genetic susceptibility to diabetes, and risk of brain glioma: a pooled analysis of observational studies. Cancer Epidemiol Biomarkers Prev. 2014;23(1):47–54. doi: 10.1158/1055-9965.EPI-13-0913. [DOI] [PMC free article] [PubMed] [Google Scholar]
- 26.Tanaka S, Meyer FB, Buckner JC, Uhm JH, Yan ES, Parney IF. Presentation, management, and outcome of newly diagnosed glioblastoma in elderly patients. J Neurosurg. 2013;118(4):786–798. doi: 10.3171/2012.10.JNS112268. [DOI] [PubMed] [Google Scholar]
- 27.Thakkar JP, Dolecek TA, Horbinski C, et al. Epidemiologic and molecular prognostic review of glioblastoma. Cancer Epidemiol Biomarkers Prev. 2014;23(10):1985–1996. doi: 10.1158/1055-9965.EPI-14-0275. [DOI] [PMC free article] [PubMed] [Google Scholar]
- 28.Fan KJ, Pezeshkpour GH. Ethnic distribution of primary central nervous system tumors in Washington, DC, 1971 to 1985. J Natl Med Assoc. 1992;84(10):858–863. [PMC free article] [PubMed] [Google Scholar]
- 29.CBTRUS. Statistical Report: Primary Brain and Central Nervous System Tumors Diagnosed in the United States in 2006–2010. doi: 10.1093/neuonc/not151. [DOI] [PMC free article] [PubMed] [Google Scholar]
- 30.Porter AB, Lachance DH, Johnson DR. Socioeconomic status and glioblastoma risk: a population-based analysis. Cancer Causes Control. 2015;26(2):179–185. doi: 10.1007/s10552-014-0496-x. [DOI] [PubMed] [Google Scholar]
- 31.Texas State Obesity Data, Rates and Trends: The State of Obesity. Trust for America’s Health and Robert Wood Johnson Foundation; 2014. [Google Scholar]
- 32.Cardiovascular Health Facts 1999–2006. Texas Department of State Health Services; 2006. [Google Scholar]
- 33.Yang M. A Current Global View of Environmental and Occupational Cancers. J Environ Sci Health C Environ Carcinog Ecotoxicol Rev. 2011;29(3):223–249. doi: 10.1080/10590501.2011.601848. [DOI] [PubMed] [Google Scholar]
- 34.Verhaak RG, Hoadley KA, Purdom E, et al. Integrated genomic analysis identifies clinically relevant subtypes of glioblastoma characterized by abnormalities in PDGFRA, IDH1, EGFR, and NF1. Cancer Cell. 2010;17(1):98–110. doi: 10.1016/j.ccr.2009.12.020. [DOI] [PMC free article] [PubMed] [Google Scholar]
- 35.Lai A, Kharbanda S, Pope WB, et al. Evidence for sequenced molecular evolution of IDH1 mutant glioblastoma from a distinct cell of origin. J Clin Oncol. 2011;29(34):4482–4490. doi: 10.1200/JCO.2010.33.8715. [DOI] [PMC free article] [PubMed] [Google Scholar]
- 36.Ellingson BM, Lai A, Harris RJ, et al. Probabilistic radiographic atlas of glioblastoma phenotypes. AJNR Am J Neuroradiol. 2013;34(3):533–540. doi: 10.3174/ajnr.A3253. [DOI] [PMC free article] [PubMed] [Google Scholar]
- 37.Zhang T, Wang Y, Fan X, et al. Anatomical localization of p53 mutated tumors: A radiographic study of human glioblastomas. J Neurol Sci. 2014;346(1–2):94–98. doi: 10.1016/j.jns.2014.07.066. [DOI] [PubMed] [Google Scholar]
- 38.Institute of Medicine (US) Committee on Assessing Interactions Among Social, Behavioral, and Genetic Factors in HealthHernandez LM, Blazer DG, editors. Genes, Behavior, and the Social Environment: Moving Beyond the Nature/Nurture Debate. Washington (DC): National Academies Press (US); 2006. 8, Study Design and Analysis for Assessment of Interactions. [PubMed] [Google Scholar]