Abstract
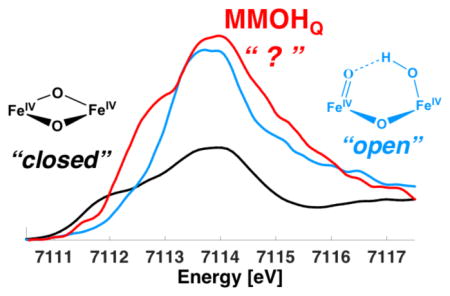
Kα High-Energy Resolution Fluorescence Detected X-ray Absorption Spectroscopy (HERFD XAS) provides a powerful tool for overcoming the limitations of conventional XAS to identify the electronic structure and coordination environment of metalloprotein active sites. Herein, Fe Kα HERFD-XAS is applied to the diiron active site of soluble Methane Monooxygenase (sMMO) and to a series of high-valent diiron model complexes, including a “diamond core” [FeIV2(μ-O)2(L)2](ClO4)4] (3) and an “open core” [(O=FeIV–O–FeIV(OH)(L)2](ClO4)3 (4) (where, L = tris(3,5-dimethyl-4-methoxypyridyl-2-methyl)amine) (TPA*)). Pronounced differences in the HERFD XAS pre-edge energies and intensities are observed for the open vs. closed Fe2O2 cores in the model compounds. These differences are reproduced by time-dependent density functional theory (TDDFT) calculations and allow for the pre-edge energies and intensity to be directly correlated with the local active site geometric and electronic structure. A comparison of the model complex HERFD XAS data to that of MMOHQ (the key intermediate in methane oxidation) is supportive of an open core structure. Specifically, the large pre-edge area observed for MMOHQ may be rationalized by invoking an open core structure with a terminal FeIV=O motif, though further modulations of the core structure due to the protein environment cannot be ruled out. The present study, thus, motivates the need for additional experimental and theoretical studies to unambiguously assess the active site conformation of MMOHQ.
Keywords: methane monooxygenase, x-ray absorption spectroscopy, HERFD XAS
Graphical Abstract
INTRODUCTION
The catalytic oxidation of methane to methanol in a selective and controlled manner is a grand challenge that has yet to be met in synthetic chemistry. Harnessing this catalytic reaction would enhance the utilization of natural gas via conversion to a liquid fuel.1–5 However, the current techniques to address the large activation energy required for this conversion remain costly and inefficient, and they crucially lack a means to prevent over-oxidation.2 Methanotrophs overcome these energetic limitations for the catalytic oxidation of methane by activating O2 at ambient pressures and temperatures within the protected active site of a metalloenzyme that allows only a single two-electron oxidation step.
It is well established that methanotrophs oxidize methane as their sole source of carbon and energy through methane monooxygenase enzymes (MMOs).1, 4–7 These enzymes can be classified into two main forms: a copper-containing trans-membrane particulate MMO (pMMO) and an iron-containing soluble MMO (sMMO). sMMO is the more kinetically, structurally, and spectroscopically characterized of the two enzymes and is expressed only under copper limiting conditions.
sMMO is comprised of three protein components: 1) the active site diiron cluster-containing hydroxylase6–7 (MMOH), 2) the regulatory protein (MMOB) and 3) the reductase (MMOR). The site of methane oxidation in MMOH is a carboxylate and oxygen-bridged diiron core established by spectroscopic and protein crystallographic studies.3–4, 6–9 Scheme 1 depicts an abbreviated schematic of the proposed catalytic mechanism, displaying only intermediates of key interest to this study. A two-electron reduction of the resting diiron(III) enzyme (MMOHox) produces a diiron(II) enzyme (MMOHred) that, when complexed with MMOB, reacts with O2 to yield a diiron(III) peroxo intermediate (MMOHP). MMOHP then undergoes proton-dependent O-O bond breaking to rapidly convert to a diiron(IV) intermediate MMOHQ.1, 3, 5 MMOHQ is the key reactive intermediate that cleaves the strong non-polar C–H bonds of methane, and hence, the details of its geometric and electronic structure are a subject of great interest.1, 3–7, 10–15
Scheme 1.
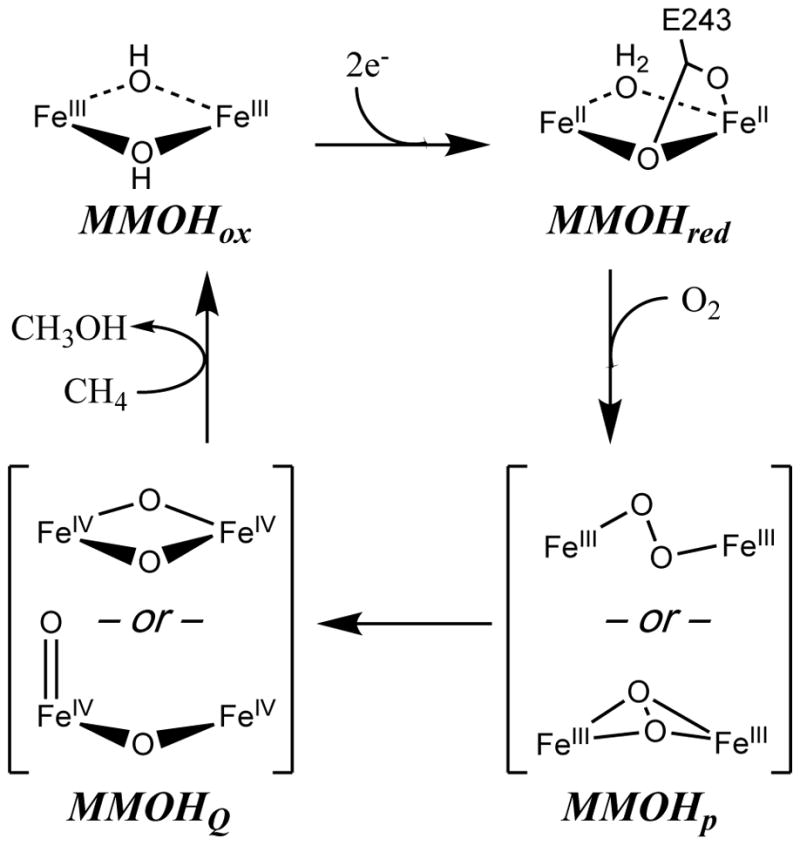
Proposed catalytic cycle of sMMO with spectroscopically characterized intermediates.
Based on Mössbauer spectroscopy, MMOHQ is known to be comprised of two antiferromagnetically coupled high-spin Fe(IV) ions in nearly identical enviroments.3, 13 However, whether MMOHQ exists in a “diamond core” or “open core” conformation (as shown in Scheme 1) has been a subject of controversy.1, 3–5, 10, 13–23 Based on EXAFS13 analysis of rapid freeze quench (RFQ) MMOHQ samples, the diiron cluster was modeled with two short, asymmetric Fe-O bonds to each iron (1.77 and 2.05 Å) and a remarkably short Fe•••Fe distance of 2.46 Å. This short distance and the observation that both Fe-O bonds are longer than the typical length of a terminal Fe(IV)=O bond (~1.65 Å)24–27 suggested a bis-μ-oxo diiron(IV) diamond core structure. However, high level computational studies have never been able to reproduce such a short Fe•••Fe distance, and instead produce optimized diiron(IV) diamond core structures with diiron distances of 2.6–2.8 Å.11–12, 14, 28–31
These computational studies are consistent with the geometry of the small molecule diamond core model complex [Fe2(μ-O)2 (TPA*)2](ClO4)4 (d(Fe•••Fe) = 2.72 Å) reported by Que and coworkers.17 Recent continuous flow resonance Raman15 studies on MMOHQ at 4 °C establish the insertion of two-equivalent oxygen atoms into the core of MMOHQ, both originating from O2. The vibrational frequency of 690 cm−1 down-shifting by 36 cm−1 when MMOHQ was prepared with 18O2 and the presence of a mode centered at 673 cm−1 when 16O18O was used, were consistent with the tetra-atomic vibrational mode of diamond core model complexes. Notably absent were the characteristic vibrational modes of either an Fe=O or Fe-OH moiety. Additionally, no frequency shift was obtained in the observed mode when MMOHQ was prepared in D2O, which would argue against a species with an exchangeable proton, as might be expected for the open core models. However, an exploration of these vibrational assignments through calculations has yet to be made. There is also debate as to whether the diamond core is sufficiently reactive to effect hydrogen atom abstraction from methane based on the much higher reactivity found for model compounds upon opening of the diamond core.19 It follows therefore that MMOHQ might exist as, or isomerize to, the open core form in order to gain the necessary reactivity.19 Due to this ongoing controversy, we believe that there is a need for further experimental and theoretical studies in order to validate the nature of MMOHQ.
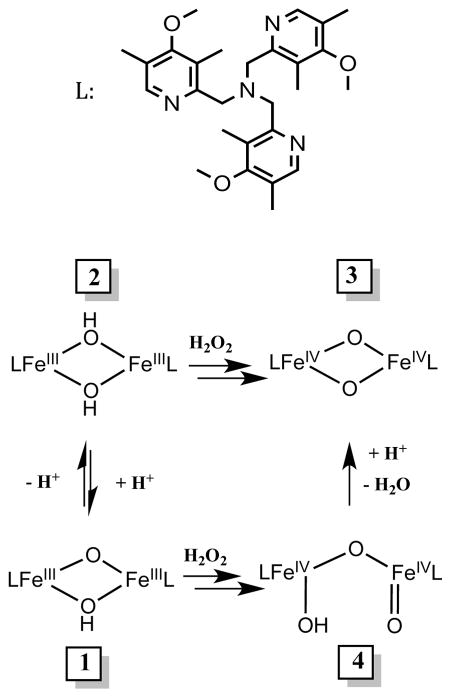
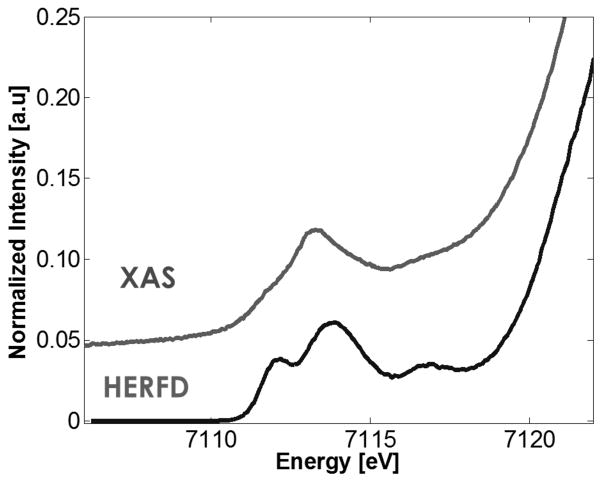
Herein, we adopt a new approach to address the nature of MMOHQ through the application of Fe Kα high-energy resolution fluorescence-detected X-ray absorption spectroscopy (HERFD XAS).32–35 The MMOHQ spectra are interpreted versus parallel studies on the open- and closed-core model compounds shown in Scheme 2. HERFD XAS is measured by scanning through the metal K-edge and measuring the resultant 2p-to-1s Kα-fluorescence using a high resolution Bragg optic. Through this indirect detection method, the 1s core hole lifetime broadening is suppressed and an ~2–4 fold improvement in experimental resolution relative to standard XAS is achieved. To illustrate this point, Figure 1 depicts a comparison of the pre-edge region of standard XAS data (measured in total fluorescence yield mode (TFY)) vs. a HERFD XAS spectrum for model 3. When the pre-edge features were modeled by pseudo-Voigt line shapes (excluding contributions from riding edge transitions), a comparison of the HERFD pre-edge area to the TFY pre-edge area shows that HERFD intensities are higher by a factor of ~1.3. The observed spectral features correspond to 1s to 3d transitions36–38 (at lowest energies, ~7110–7115 eV) with additional charge transfer contributions35, 39 observed to higher energies (~7118 eV).
Scheme 2.
Reaction of 1 with H2O2 to form diiron(IV) complexes. Each iron center has a supporting TPA* ligand where TPA* = tris[3,5-dimethyl-4-methoxy)pyridyl-2-methyl]amine.
Figure 1.
An expansion of the pre-edge region of the Fe XAS total fluorescence yield spectrum (top) vs the Fe Kα HERFD XAS spectrum (bottom) on model complex 3.
In addition, the obtained spectra are directly correlated to time-dependent density functional theory calculations (TDDFT). Due to the improved resolution in a HERFD measurement, we are able to more rigorously and quantitatively assess the contributions of the local geometric and electronic structure to the pre-edge region. Through this combination of experiment and theory applied to synthetic models with varied core conformations, and to the enzyme intermediate itself, we are able to obtain new insights into the controversial structure of MMOHQ. Furthermore, we demonstrate the utility of HERFD XAS for the identification of different core conformations. Hence, the results presented herein should have wide applicability to numerous bimetallic active sites in both biological and chemical catalysis.
METHODS
Sample preparation
Methylosinus trichosporium OB3b MMOB and 57Fe-enriched MMOH were purified according to protocols described previously.40 For all samples (MMOHox, MMOHred, MMOHQ), MMOH and the regulatory protein MMOB (which contains no metal cofactor) were present in a 1:1 ratio based upon MMOH active sites. There are two populations of the MMOH protein, one of which reacts with O2 with previously observed rate constants and forms catalytic intermediates. The other population reacts slowly with O2 and does not display the accumulation of intermediates during its turnover.40 As a result, the trapped Q intermediate samples show a large percent of unreacted MMOHred (~70%) and a smaller fractions of MMOHQ (~25%) and MMOHox (~5%). Therefore Mössbauer spectroscopy was necessary in order to report a pure HERFD XAS spectrum of MMOHQ based on Mössbauer deconvolutions (Figure S1). The reduced protein complex was rapidly mixed in a 1:1 ratio with oxygen-saturated buffer (0.1 M MOPS, pH 7.0) using an Update model 1019 Rapid Freeze Quench (RFQ) instrument to initiate the single turnover reaction. After aging the reaction for 1.1 s in an aging tube at 4 °C (time for maximal accumulation of MMOHQ at pH 7.0), the reaction mixture was frozen by being sprayed onto counter-rotating aluminum wheels chilled to liquid nitrogen temperatures. The wheels grind the frozen sample into a powder, which is collected under liquid nitrogen and packed into Delrin Mössbauer/XAS cells with 38 micron thick Kapton windows. To demonstrate the reproducibility of our measurements, HERFD XAS data from all sMMO samples were collected in 2 separate synchrotron experiments (Figure S4). For each experiment, 2 duplicates samples of MMOHred and MMOHox were measured and 3 to 5 samples of MMOHQ were measured. The samples concentrations were 3.8 mM in Fe for MMOHred and MMOHox and 1.9 mM in Fe for MMOHQ. All HERFD XAS measurements were performed in a liquid helium flow cryostat maintained at 10 K.
Model Complex Synthesis
All model complexes were prepared as previously reported,17, 19–21, 41–42 and frozen liquid samples were loaded in Delrin Mössbauer cells. When possible, samples were isolated as solids ([FeIII 2(μ-O)(μ-OH)(L)2](ClO4)3 (1), [FeIII 2(μ-OH)2(L)2](ClO4)4 (2) and [FeIV 2(μ-O)2L)2](ClO4)4 (3), L = TPA* = tris(3,5-dimethyl-4-methoxypyridyl-2-methyl)amine). The CH2 hydrogen atoms were deuterated for samples 3 and 4 in order to extend their lifetimes. 17, 41 All solid samples were measured as dilutions in boron nitride, packed in 1 mm aluminum spacers, and sealed with 38 μm Kapton windows. Samples were maintained at 10 K in a liquid helium flow cryostat during the course of XAS measurements.
[(O=FeIV–O–FeIV(OH)(L)2](ClO4)3 (4) was prepared in 20–30 % yield as a frozen solution. Product formation was monitored by the increase of an absorbance feature at 705 nm (ε= 2.5 mM−1 cm−1) and all components present in the sample were characterized based on Mössbauer spectroscopy. Sample 4 also contained its starting material and decay product, as shown in Figures S2 and S3. The decay product was isolated by allowing the compound to react for 2 hours at −30 °C. The major decay product is assumed to be [(FeIV(μ-O)2FeIII(L)2] based on previous results21 and Mössbauer analysis.
Kα HERFD XAS Data Collection
All data were measured at beamline ID26 at the European Synchrotron Radiation Facility (ESRF) operating at 200 mA and 6 GeV. The experiment was performed using both total fluorescence yield (using photodiode detector) and high-energy resolution fluorescence detection (using a crystal spectrometer in combination with an avalanche photodiode detector for model complexes and a KETEK Silicon Drift Detector for the protein samples). A Helium-filled bag was placed between the sample, the analyzer crystals, and the detector in order to reduce attenuation of the fluorescence signal. The incident energy was selected using a Si (311) double crystal monochromator. Internal Energy calibration was performed by assigning the first inflection point of an iron foil to 7111.2 eV. The beam was focused to a 0.2 mm (v) × 1.0 mm (h) spot at the sample providing ~4×10¹² photons/second. Energy selection of the emitted x-rays was accomplished using four spherically bent Ge(440) crystals aligned on intersecting Rowland circles.33 For data collection the spectrometer energy was set to the maximum of the Kα1 emission line. Scans of the HERFD XAS edge region were measured from 7090 – 7175 eV with 0.2 eV steps and longer XAS scans for normalization were obtained from 7000 – 8000 eV in 0.5 eV steps. The dwell time per spot was determined by performing damage studies based on collecting successive edge scans (10 sec/scan) at the same point on the sample. No sign of photoreduction was observed within 30 seconds/spot for both MMOHox and MMOHQ and 240 seconds/spot for MMOHred. Dwell time for model complexes varied from 15 to 40 seconds/spot. When necessary, the incident beam was attenuated by the placement of aluminum foils within the beam path. For data reduction, both short and long XAS scans were averaged separately utilizing PyMCA43 program, while fitting was accomplished by using BlueprintXAS.44 All HERFD XAS spectra of MMOHQ and 4 shown in this paper correspond to pure sample (after deconvolution based on Mössbauer quantification). Reproducibility of the HERFD data was verified by comparing the results of 2 separate beam time experiments with samples prepared from different protein batches and also by a comparison between data collected on each of the 3–5 different cells with in the same experiment, see Figure S4.
In order to appropriately and quantitatively compare the experimental spectra of all proteins and synthetic model complexes, the XAS edge and pre-edge region were analyzed using previously established protocols.38 Intensity-weighted average pre-edge energies (IWAE) and integrated pre-edge areas are summarized in Table 2. Pre-edge areas were obtained from the BlueprintXAS program and multiplied by 100.
Table 2.
Intensity Weighted Average Energies for the Edge and Pre-edge Regions and Areas for the Pre-edge Features
|
|
|
||||||
|---|---|---|---|---|---|---|---|
| Edge | Pre-edge | ||||||
|
| |||||||
| Compound | Energy (eV) | Energy (eV) /p1 | Area/p1 | Energy (eV)/p2 | Area/p2 | IWAE | Total Area |
| MMOHred | 7120.2 | 7111.8 | 8.85 | 7113.1 | 3.92 | 7112.3 | 12.77 |
|
| |||||||
| MMOHox | 7123.5 | 7112.7 | 8.06 | 7114.3 | 5.31 | 7113.3 | 13.37 |
|
| |||||||
| MMOHQ | 7126.2 | 7112.5 | 4.88 | 7114.2 | 30.60 | 7114.0 | 42.10 |
|
| |||||||
| 1 | 7123.5 | 7112.4 | 5.63 | 7114.0 | 13.73 | 7113.2 | 19.36 |
|
| |||||||
| 2 | 7124.0 | 7112.5 | 5.70 | 7114.3 | 6.75 | 7113.4 | 12.45 |
|
| |||||||
| 3 | 7123.8 | 7112.1 | 3.18 | 7114.1 | 15.26 | 7113.8 | 18.44 |
|
| |||||||
| 4 | 7124.2 | 7112.4 | 4.87 | 7114.1 | 30.43 | 7113.7 | 36.15 |
Mössbauer spectroscopy and quantification
For complete quantitative deconvolution of XAS spectra, Mössbauer spectroscopy of all samples was employed to identify and quantify the composition of each individual sample. All spectra were collected at 80K and in the absence of an applied magnetic field (see SI).
Identification of all iron species within the RFQ trapped samples of sMMO is possible due to the differing spin-states of three components; MMOHQ contains HS diiron(IV) active site, while MMOHred and MMOHox have HS diiron(II) and HS diiron(III) active sites, respectively.6, 13 Mössbauer parameters, along with spin state information of both proteins and model complexes, are provided in Table 1. The MMOHQ samples contained 24–26% of MMOHQ, 68–70% of MMOHred and 6–7% of MMOHox. Mössbauer quantification on model complex 4 showed the sample contained decay product (~30%), consistent with [(FeIV(μ-O)2FeIII(L)2]. Moreover, a diferric species (corresponding to unreacted starting material and/or hydrolysis product) (~33%) was also found in the sample. The Mössbauer quantification of all compounds present in the sample allowed for accurate deconvolution of the HERFD XAS spectra.
Table 1.
Experimental Mössbauer parameters, spin states and Fe•••Fe distances for sMMO and the model complexes.a
| MMOHred | MMOHox | MMOHQ | 1 | 2 | 3 | 4 | |
|---|---|---|---|---|---|---|---|
| ΔEQ[mm/s] | 2.93/1.71 | 1.67 | 0.42 | 0.71 | - | 2.09 | 0.92/1.92 |
| δ [mm/s] | 1.26/1.35 | 0.49 | 0.15 | 0.44 | - | 0.04 | −0.03/0.00 |
|
| |||||||
| Stot (Sloc) | 4 (2,2) | 0 (2,2) | 0 (2,2) | 0 (5/2,5/2) | 0 (5/2,5/2) | 0 (1,1) | 2 (1,1) |
|
| |||||||
| Fe•••Fe (Å) (DFT) | 3.4–3.46 b | 3.11–3.34c | 2.6–2.8 d | 2.80 | 3.14 | 2.73 | 3.29 |
|
| |||||||
| Fe•••Fe (Å) (experimental) | 3.4 e | 3.1 f | 2.46 g | 2.792 h | 3.02 h | 2.71 h | 3.32 i |
All values presented in this table correspond to the current study except otherwise with the corresponding references:
(11),
(9),
(11–12, 14, 28–31),
(6 ),
(8),
( 13),
(17), and
( 41).
Computational details
All pre-edge calculations have been performed on the model complexes by TDDFT calculations37–38, 45 using ORCA46 version 4.0. Geometry optimizations were carried out starting from crystal structure coordinates.42 Optimizations were performed using the BP86 functional in combination with the def2-TZVP basis set and the dispersion correction (D3BJ) used in ORCA that utilizes Grimme’s DFT-D3 approach.47 In the present work, model complexes 1, 2 and 3 possess diamagnetic ground states, as a result of two antiferromagnetically coupled irons centers with bis(μ-oxo) bridges mediating the super exchange contribution between metals (Table 1). The obtained geometries were closer to experimental structures when the optimizations were done on the broken symmetry surface following published procedures on DFT single point broken symmetry calculations.48
The Hybrid TDDFT calculations were performed using B3LYP functional with 90 roots in combination with the CP(PPP) basis set49 and an increased integration accuracy (Grid 7) on the metal sites.38 Spectra were plotted with an applied broadening of 1.0 eV (FWHM) and were shifted by a constant value of 151 eV. Since not all models have equivalent irons, all calculated spectra were performed by excitation of both metal sites to ensure rigorous comparisons. Sample input files can be found in the Supporting Information.
RESULTS AND ANALYSIS
sMMO
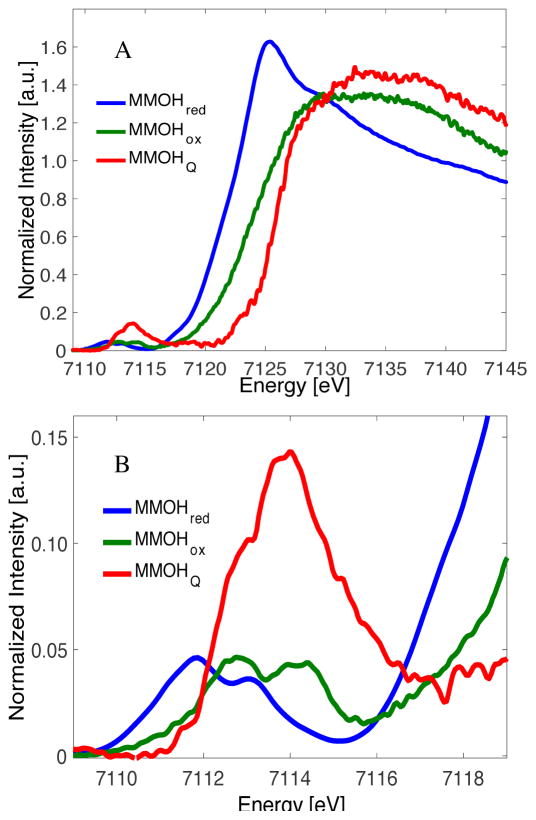
The Kα HERFD XAS spectra for MMOHred, MMOHox and MMOHQ are shown in Figure 2. The HERFD XAS spectra are comprised of two easily identifiable regions: 1) the intense edge which occurs within the 7120–7128 eV region and 2) the weaker pre-edge in the 7111–7115 eV region. The edge results primarily from a dipole-allowed 1s to 4p transition, and as such reflects the effective nuclear charge of the photoabsorber. As shown in Figure 2A and Table 2, the rising edge position increases by ~3 eV on going from MMOred to MMOHox, consistent with the increase in oxidation state on going from a diferrous to a diferric active site. Similarly, on going to MMOHQ the rising edge shifts up in energy to ~7126.2 eV, again consistent with a diiron(IV) active site. The weaker pre-edge features correspond to 1s to 3d transitions (Figure 2B), which are formally dipole forbidden transitions, but gain intensity due to iron 3d-4p mixing in the non-centrosymmetric environment of the protein active site. As Table 2 shows, both the pre-edge energy and the intensity distribution vary for different redox levels of the protein. The lowest pre-edge energy and area is found for MMOHred, with an IWAE of 7112.3 eV and pre-edge area of 12.8 units. Upon oxidation to MMOHox the IWAE pre-edge energy increases by ~1 eV, and the splitting in the pre-edge increases by ~0.3 eV, consistent with increasing effective nuclear charge and a stronger ligand field, respectively. The pre-edge areas, however, for MMOHred and MMOHox are very similar, suggesting that the symmetry of active site ligands to the iron atoms does not change significantly between these two states.
Figure 2.
A) Kα HERFD XAS of MMOHox, MMOHred and MMOHQ. B) Expansion over the pre-edge region.
For MMOHQ, the IWAE for the pre-edge increases to ~7114 eV, consistent with the formation of a diiron(IV) active site. More notable, however, is the dramatic increase in pre-edge area to ~42 units of intensity. In order to obtain insights into the electronic structure of MMOHQ and the origin of its characteristic pre-edge features, a series of diiron model complexes with differing oxidation states and core structures were utilized to systematically investigate the correlation between core geometry and the HERFD pre-edge energy and intensity distribution.
Diiron(III) Model Complexes
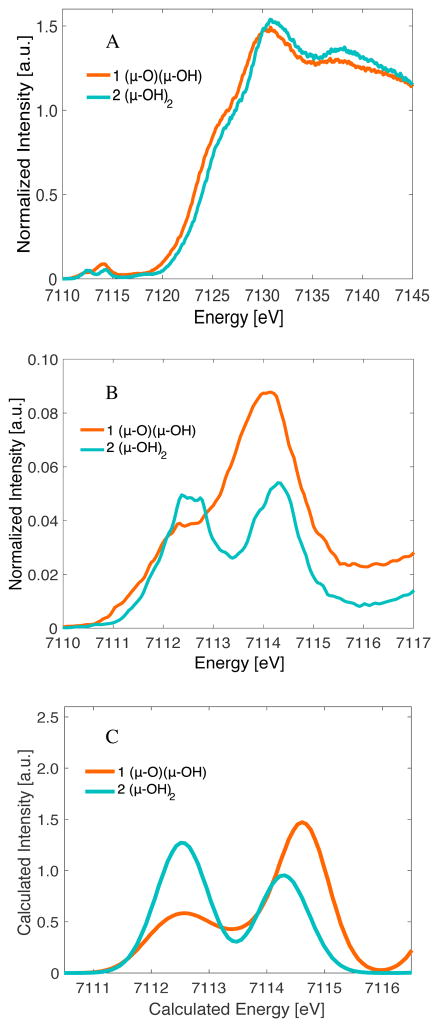
Figure 3 shows the Kα HERFD XAS spectra of two HS diferric models: [Fe2(μ-O)(μ-OH)(TPA*)2](ClO4)3 (1) and [Fe2(μ-OH)2(TPA*)2](ClO4)4 (2). The similarity between the two models allows for the effect of a single protonation event within the diiron core to be evaluated.
Figure 3.
A) Kα HERFD XAS on models 1 and 2. B) Expansion over the pre-edge region. C) Calculated Fe-K-pre-edge XAS spectra applying a 1 eV broadening and an energy shift of 151 eV.
Inspection of Figure 3A and Table 2 shows that, despite 1 and 2 having the same oxidation states, there is still an increase in the rising edge energy on going from 1 to 2, which reflects the replacement of a covalent O2− by a less covalent OH−. Similar trends in binuclear Fe complexes have been observed by Westre et al.36
An expansion over the pre-edge region can be found in Figure 3B. It is clearly seen that the bis(μ-hydroxo)diiron(III) complex 2 has a much lower pre-edge intensity (~12.5 units) than the (μ-oxo)(μ-hydroxo)diiron(III) complex 1 (~19.4 units). These differences in pre-edge areas can be understood as a direct reflection of the lower centrosymmetry of the individual iron centers in 1 due to the increased covalency of the oxo ligand that serves to further mediate iron 3d-4p mixing.50–51
This simple picture can be computationally validated through TDDFT calculations, which are shown in Figure 3C. We note that optimizations of 1 and 2 with B3LYP generated geometries that are slightly closer to the XRD geometry. However, in order to keep consistency in our computational study, all the calculated spectra are performed on geometries generated by using the BP68 GGA functional, which somewhat overestimates delocalization in HS systems. Nevertheless, the calculated spectra clearly reproduce the general energy and intensity trends of the HERFD XAS spectra. Due to the reasonable agreement between experiment and theory, the geometric and electronic structural origins of these differences can be evaluated in greater detail.
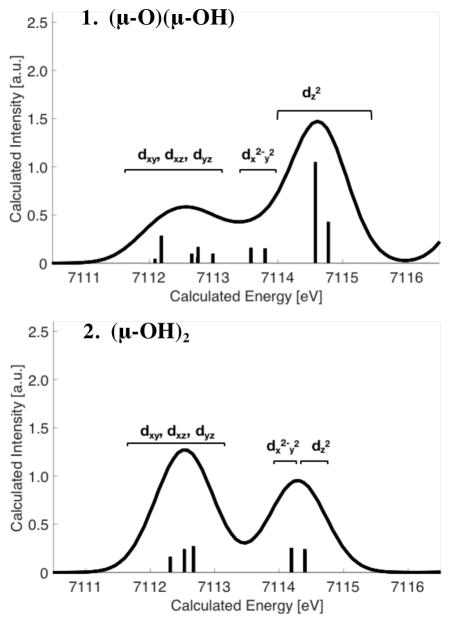
As shown in Figure 3, complexes 1 and 2 have very different pre-edge intensity distributions despite the fact that both models have closed-core geometries with antiferromagnetically coupled ferric ions (see Table 1). This can be best understood by inspection of the local iron site symmetry in 1 and 2. While the individual iron sites of complex 2 have pseudo-Oh symmetry, those of complex 1 are locally ~C4v. These differences result from the nearly identical Fe-μ-OH− bond lengths in 2 (based on the DFT geometries), compared to the more distinct Fe-μ-O and Fe-μ-OH distances for 1. The presence of the short Fe-μ-O bond in 1 results in a larger distortion of the individual metal centers from centrosymmetry. As the distortion occurs along the z-axis and the 4p orbitals transform as e(px,py) and a1(pz) in C4v symmetry, the strongest perturbation in the pre-edge intensity is due to mixing of the 4pz orbital (with a1 symmetry) into the dz2 orbital, which is oriented along the Fe-μ-O axes. TDDFT calculations of the XAS spectra, together with the calculated transitions, are shown in Figure 4. It is demonstrated here that the highest energy intense transition for 1 is indeed dominated by 4pz mixing into the dz2 orbital of both metals (two sticks at highest energies). When the μ-O bridge is protonated in 2, symmetry is largely restored and the experimental pre-edge area decreases from ~19 units to ~12 units (see Table 2 and Figure S5 for TD-DFT pre-edge areas from). Changes in the protonation state of the bridges are just one example of the sensitivity of HERFD to changes in the iron coordination environment.
Figure 4.
Calculated Fe-K-pre-edge XAS spectra applying a 1eV broadening and an energy shift of 151 eV for complex 1 (top) and complex 2 (bottom).
Diiron(IV) Model Complexes
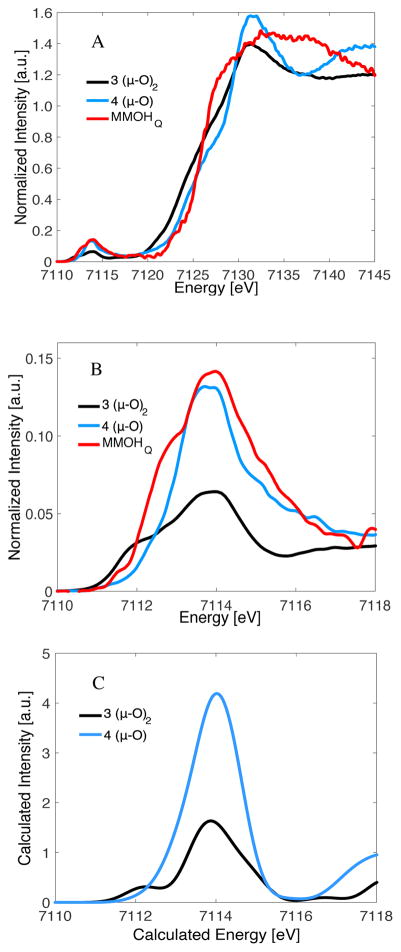
To lend further support to the correlation between HERFD XAS pre-edge intensities and diiron active site structure, we also investigated two diiron(IV) model complexes: the diamond core model 3 and the open core model 4. These data are presented in Figure 5, together with the MMOHQ data originally presented in Figure 2 and shown for reference. As can be seen in Figure 5A, both models possess a rising edge in the same vicinity as MMOHQ, consistent with diiron(IV) complexes. However, Figure 5B very clearly illustrates that there is a significant difference between model complex 3 and the open core structure of model 4 in the pre-edge region. Table 2 shows that the pre-edge area for the open-core model is ~36 units, while the diamond core model 3 has only ~18 units of pre-edge area. This indicates much greater 3d-4p mixing in the former than in the latter. This difference is also validated by TDDFT calculations of the XAS spectra (Figure 5C), which are again in good agreement with experiment. This finding highlights the predictive power of such an approach.
Figure 5.
A) Kα HERFD XAS of models 3 and 4, together with the data for MMOHQ. B) Expansion over the pre-edge region. C) Calculated Fe-K-pre-edge XAS spectra applying a 1 eV broadening and an energy shift of 151 eV.
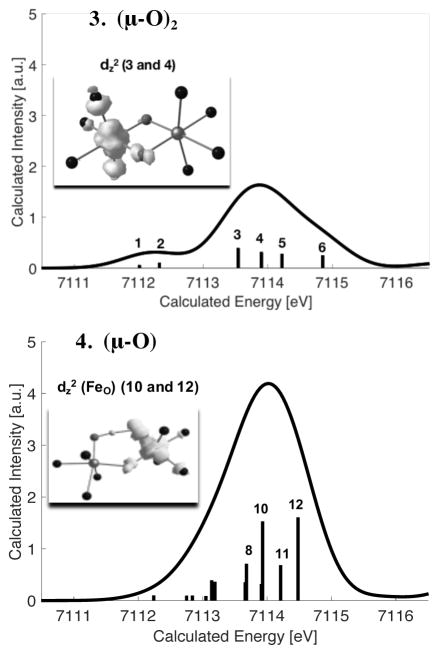
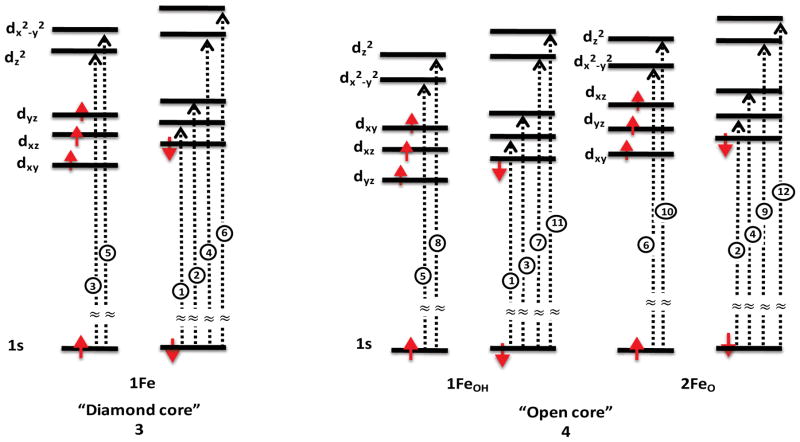
Once again, it is useful to evaluate in greater detail the geometric and electronic structural origins of the observed changes in pre-edge intensity. Figure 6 displays the calculated preedge transitions for both diiron(IV) models 3 and 4. As shown in Table 1, the diamond core model 3 contains two iron(IV) metal centers that are antiferromagnetically coupled (S = 0) with Sloc = 1. The open core 4 on the other hand is a ferromagnetically coupled diiron(IV) system (S = 2) with Sloc = 1 units. For a more accurate investigation of the origin of the pre-edge transitions of these complexes, Scheme 3 depicts a simple d-orbital diagram for diiron models 3 and 4. Although both models have the same local (Sloc = 1) spin state at each Fe, the d-orbital ordering and magnetic coupling are different due to the differences in geometry (Figure S6). In 3, the two Fe atoms have equivalent electronic structures (hence only one Fe is depicted in Scheme 3 for simplicity), with the dz2 orbital being the LUMO and the dx2–y2 orbital highest in energy due to the strong interaction of the bridging oxo groups with the xyplane. In 4, the two irons are inequivalent due to the presence of a hydroxo on one iron (1FeOH) and a terminal oxo on the other iron (2FeO) (Scheme 3, right). Here the dx2–y2 orbital is now the LUMO and the dz2 is raised highest in energy. These differences in electronic structure give rise to 6 possible preedge transitions for 3, and 12 possible pre-edge transitions for 4, due to the presence of inequivalent irons in the latter (as labeled in Scheme 3 and in Figure 6). In complex 3, the lowest energy pre-edge features correspond to the beta transitions to the dxz and dyz orbitals (transitions 1 and 2, in Figure 6, top). To higher energy, both alpha and beta transitions to the unoccupied dz2 (transitions 3 and 4) and dx2–y2 orbitals (transitions 5 and 6) are observed. The transitions to the spin up and spin down orbital are split by ~0.6 eV splitting due to spin polarization. 38, 51 Upon going to the open core structure in 4, the lowest energy pre-edge transitions (< ~7113 eV) again correspond to excitations to the dπ orbitals. However, due to the inequivalence of 1FeOH and 2FeO in terms of the local ligand field (Table 3 and Figure S6), the 2FeO dπ-transitions appear at higher energies than those of 1FeOH.52 This results in the absence of a well-resolved shoulder in 4, as compared to 3. More notably, the primary change that occurs in 4 is increased 4p mixing into the 2FeO dz2 orbitals (due to the short Fe-O(oxo) bond), which gives rise to the intense stick spectra from transitions 10 and 12 in Scheme 3, bottom. In contrast, the corresponding 1FeOH transitions to the dz2 orbitals (transitions 8 and 11) are much weaker. This results from the longer Fe-OH bond, relative to the Fe–O bond, producing a much more centrosymmetric site at 1FeOH. In addition, we note for model 4, as for model 3, spin polarization contributions result in a ~0.6 eV splitting between corresponding alpha and beta transitions. This observation indicates that the splitting is a reflection of the “local” iron spin state. The implications of the local spin state at Fe will be addressed in further detail along with the analysis of the MMOHQ core structure in the section that follows.
Figure 6.
TDDFT calculated spectra of model complexes 3 (top) and 4 (bottom). The insets show the corresponding difference densities for selected transitions.
Scheme 3.
1s–3d transitions scheme for models 3 and 4. Transitions are labeled from lowest to highest energy.
Table 3.
Selected metrics for optimized geometries of closed (3, 3a, 3b and 5) and open core models (4 and 4a). Atomic numbering as indicated for the closed core structures (left) and open core structures (right).

| ||||||||
|---|---|---|---|---|---|---|---|---|
| Model | Stot(Sloc) | Fe1-Fe2 (Å) | Fe1-O1 (Å) | Fe2-O1 (Å) | Fe1-O2 (Å) | Fe2-O2 (Å) | Fe2-O3 (Å) | Fe1-O-Fe2 (°) |
| 3 | 0 (1,1) | 2.72 | 1.778 | 1.823 | 1.823 | 1.778 | - | 98.33 |
| 3a | 0(2,2) | 2.63 | 1.769 | 1.813 | 1.813 | 1.769 | - | 94.85 |
| 3b1 | 0(1,1) | 2.65 | 1.777 | 2.05 | 2.05 | 1.777 | - | 87.45 |
| 4 | 2(1,1) | 3.29 | 1.853 | 1.814 | 1,756 | - | 1.681 | 128,23 |
| 4a | 4(2,2) | 3.39 | 1.761 | 1.885 | 1.750 | - | 1.668 | 136,83 |
| 5 | 0 (2,2) | 2.74 | 1.797 | 1.814 | 1.816 | 1.814 | - | 98.9 |
For model 3b the Fe-O core distances were fixed and the remaining ligands were allowed to optimize
Core geometry of MMOHQ
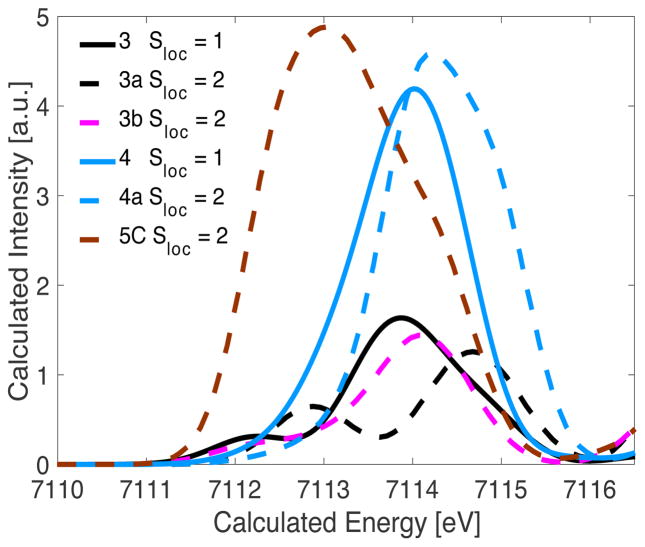
As shown in Figure 4, the HERFD XAS pre-edge region of MMOHQ is far more similar to the open model 4 than it is to the diamond core model 3. Hence, at least from a qualitative comparison, the data would appear to better support an open core structure in MMOHQ. However, here it is first important to discuss the electronic structural differences between the model complexes and MMOHQ. Both models 3 and 4 possess Sloc = 1 local spin states at the Fe site, with 3 and 4 being antiferromagnetically and ferromagnetically coupled, respectively (Table 3).17, 52 In contrast MMOHQ has Sloc = 2 local spins at the Fe sites, with a diamagnetic ground state arising from the antiferromagnetic coupling of the metals. Thus, it is important at this point to evaluate hypothetical model complexes in order to determine the contributions of local spin to the HERFD XAS pre-edge spectra. A modified model of compound 3 with Stotal = 0 and Sloc = 2 (referred to as 3a) was optimized and resulted in a shorter Fe•••Fe bond distance (2.63 Å) than the actual model 3 (2.72 Å). The calculated pre-edge of 3a is clearly altered relative to 3 (Figure 7). While the spectrum of 3 is dominated by an intense pre-edge feature at 7113.7 eV, in 3a intense preedge features are present at 7112.7 and 7114.8 eV. Analysis of the calculations shows that this modulation arises from an increased splitting between the α and β orbitals, for Sloc = 2 relative to Sloc = 1. This is a result of an increased contribution from spin polarization upon increasing the number of unpaired electrons at Fe.29 In addition, a ~25% decrease in calculated pre-edge intensity is observed, when comparing 3 and 3a. The short Fe•••Fe distance in 3a decreases the Fe–O–Fe angles, and results in decreased dipole contributions to the pre-edge area. This comparison demonstrates that the local spin at the Fe clearly modulates the pre-edge intensity. However, the increasing spin state results in a decrease rather than an increase in pre-edge area for the closed core model. Hence, within the limits of this model, it does not appear that a closed core model is consistent with the HERFD XAS data on MMOHQ.
Figure 7.
TDDFT calculated spectra of models 3 (solid, black) and 4 (solid, blue) and the corresponding hypothetical models 3a (dashed, black), 3b (dashed, pink) and a 5-coordinate diiron closed core 5C (dashed, brown).
The effect of local spin state at the Fe was similarly explored for the open core case. For the open core model 4 and the hypothetical model 4a (with Stotal = 4 and Sloc = 2) intense preedge features are predicted regardless of the local spin state (Figure 7). We note that it is not possible to obtain a converged geometry for this model with Stotal = 0 and Sloc = 2. However, as also demonstrated above, it is expected that the local geometry and spin state at each iron dominate the preedge spectrum. Similar to model 3, upon increasing the local spin at the Fe, the pre-edge spectrum becomes broader. Analysis of the calculations shows that this broadening is again attributed to spin polarization which increases the splitting between the α and β dz2 orbitals (from 0.6 eV in 4 to ~0.9 eV in 4a). This observation may also explain the origin of the intense low energy shoulder in MMOHQ. Again, as MMOHQ has Sloc = 2 spin, significant splitting of the α and β dz2 orbitals is expected. We note that the increased intensity in 4a relative to 4 is attributed to structural distortion upon increasing the spin state. By evaluating the optimized structure, it was determined that model 4a is more asymmetric than model 4. In 4a, the difference between the Fe1–(μ-O) and Fe2–(μ-O) distances is 0.12 Å, while for model 4 the difference is only 0.04 Å. These structural differences result in a ~16 % increase in the pre-edge area. Interestingly, this same increase in pre-edge area (~16%) is observed experimentally on going from the open core model 4 to MMOHQ. In the same vein, asymmetry in the closed core model could also provide a mechanism for increased pre-edge intensity.13 EXAFS studies on MMOHQ previously proposed that the oxo bridges were asymmetrically placed with Fe1(2)-O1(2) and Fe1(2)-O2(1) at 1.77 Å and 2.05 Å, respectively. We note, however, that this degree of asymmetry has been rejected in computational studies by Noodleman and coworkers, where they clearly state that “the presence of HS metal ions and a very short Fe•••Fe separation as well as substantial asymmetry in the Fe–O bond lengths (from EXAFS) are mutually incompatible”.12 We too were unable to obtain an optimized structure that reflects such a high degree of asymmetry. Nonetheless, we performed a calculation in which the core Fe2O2 distances were fixed at the EXAFS13 modeled distances of 1.77 Å and 2.05 Å, and the rest of the structure was allowed to optimize (3b). These computations show a similar pre-edge intensity and energy distribution as seen for model 3. In a simple picture, one might expect that the increased asymmetry in 3b should produce a more intense pre-edge. However, the increase in Fe1-O2/Fe2-O1 distance from ~1.82 Å in 3 to 2.05 Å in 3b diminishes the covalent contribution to p-d mixing,50 which appears to counter this effect. Additional calculations were explored in which further asymmetry was induced in the Fe2O2 core, by using the optimized structure of 3 as a starting point and systematically varying the asymmetry in the Fe-oxo bridges (see Figure S7). These results show that in order to obtain a pre-edge intensity for the closed core model that is as intense as the open core model, an ~1.63 Å bridging Fe-O distance is required. This possibility appears unreasonable, however, as such a short Fe–O distance is inconsistent with a bridging μ-oxo moiety and much more indicative of a terminal Fe-oxo unit.
SUMMARY and DISCUSSION
Herein, we have used a combination of HERFD XAS and TDDFT calculations to quantitatively assess the geometric and electronic structure of MMOHQ and related model complexes. It is observed that the diiron closed core model, the open core model and MMOHQ all have pre-edge features at ~7114 eV. However, the pre-edge areas vary significantly with the closed core at ~18 units of intensity, the open core at ~36 units of intensity, and MMOHQ with 42 units of intensity. Our computational results confirm that an Fe2O2 open core site has a preedge area ~2 times greater than a closed core site. Modulations in the local iron spin to Sloc = 2 change the spectral energy distribution, thereby increasing the area slightly for the open core conformation (by up to ~16%) and showing a decrease in intensity for the diamond core model (~25%). The diamond core pre-edge intensity can, however, be increased by forcing the diamond core to be asymmetric, as discussed above.
We have also tried to examine the effects of reduced coordination number at the iron site. In principle, a 5-coordinate environment around each iron in a closed core confirmation could also account for the high pre-edge intensity in MMOHQ. To this end, we optimized a 5-coordinate diamond core structure (5C) using [FeIV2O2(tacn)2]4+ (where tacn = 1,4,7-triazacyclononane) and the core geometry of 3 as the starting point (Figure S8). The computations on this hypothetical 5-coordinate diamond core model favors a high spin state Sloc = 2 with Stot = 0. Figure 7 shows that, while the calculated preedge is even more intense than the open core, the IWAE of the pre-edge is however shifted ~1 eV to lower energy. A ~1-eV decrease in the pre-edge energy upon reducing coordination number is consistent with previous model studies on high-valent iron monomers.38 To account for possible effects due to changes in the ligand donor properties, we also computed a 5-coordinated model, 5C′, with pyridine ligands (see Figure S5), with similar electron donating behavior to TPA*. This model also favors a HS configuration; however, the pre-edge energy is shifted to ~0.5 eV higher energy than 5C due to the more strongly donating pyridine ligands. Nonetheless, the pre-edge is still clearly at lower energies than the 6-coordinate models 3 and 4. Hence, these computations seem to suggest that MMOHQ is unlikely to possess 5-coordinate iron atoms, given its similar pre-edge energy to the 6-coordinate models 3 and 4.
In summary, the HERFD XAS data appear to best support an open core model for MMOHQ. We caution, however, QM/MM calculations of the protein active site should be explored in order to rule out possible contributions from the protein environment. Furthermore we note that the present observations must be reconciled with the existing literature on MMOHQ. In our view, the EXAFS of MMOHQ must be revisited in order to reassess the anomalously short Fe•••Fe distance. A recent study by Dassama et al53 showed that the previously reported54 2.5 Å Fe•••Fe distance in ribonucleotide reductase intermediate X is in fact at ~2.8 Å. The authors were not able to ascertain the origin of these discrepancies, though we speculate that it may have originated from background Fe contamination in the initial EXAFS measurements. Nonetheless, Dassama’s findings provide precedence for also reassessing the Fe•••Fe distance in MMOHQ. These data will provide an essential constraint for properly modeling the active site structure. Importantly, any proposed model for MMOHQ must also be further constrained by the existing UV-Vis, Mössbauer and resonance Raman data.4, 6–7, 13, 15 We note that, while the Mössbauer and HERFD XAS studies have both been performed on freeze-quenched solutions at low temperatures, the UV-Vis and resonance Raman data were both measured as solutions at 4 °C and at lower protein concentration than the present study. Hence, future HERFD XAS studies on MMOHQ under transient solution conditions and measurement of resonance Raman and UV-Vis spectra at low temperature will be important in reconciling the origin of the differences in the interpretations of the XAS, UV-Vis and resonance Raman data. These studies are ongoing in our laboratories.
In conclusion, we present experimental and computational data consistent with an open core structure for the key intermediate in biological methane oxidation. While we believe that further experimental and theoretical studies are warranted in order to reach broad consensus, the present study provides important new experimental data for rigorously assessing the exact nature of MMOHQ.
Supplementary Material
Acknowledgments
Former and current members on the Molecular Theory and Spectroscopy Department and Inorganic Spectroscopy Department at MPI CEC are thanked for helpful discussions regarding the computational studies and for assistance with data collection. Financial support was provided by the Max Planck Society (S.D.). J.D.L. and L.Q. acknowledge the National Institutes of Health for funding (grants GM118030 to J.D.L and GM38767 to L.Q and postdoctoral fellowship GM113333 to C.J.A.). RGC acknowledges the International Max Planck Research School on Reactive Structure Analysis for Chemical Reactions (IMPRS RECHARGE) for funding. The European Synchrotron Radiation Facility is acknowledged for providing beamtime and technical support.
Footnotes
ASSOCIATED CONTENT
Additional details concerning Mössbauer quantification on samples, reaction mechanism of model complexes, reproducibility of the HERFD XAS experiment and computational details related to the present study. This material is available free of charge via the Internet at http://pubs.acs.org.
References
- 1.Que L, Tolman WB. Nature. 2008;455:333. doi: 10.1038/nature07371. [DOI] [PubMed] [Google Scholar]
- 2.Haynes CA, Gonzalez R. Nat Chem Biol. 2014;10:331. doi: 10.1038/nchembio.1509. [DOI] [PubMed] [Google Scholar]
- 3.Lee SK, Fox BG, Froland WA, Lipscomb JD, Munck E. J Am Chem Soc. 1993;115:6450. [Google Scholar]
- 4.Wallar BJ, Lipscomb JD. Chem Rev. 1996;96:2625. doi: 10.1021/cr9500489. [DOI] [PubMed] [Google Scholar]
- 5.Tinberg CE, Lippard SJ. Acc Chem Res. 2011;44:280. doi: 10.1021/ar1001473. [DOI] [PMC free article] [PubMed] [Google Scholar]
- 6.Rosenzweig AC, Frederick CA, Lippard SJ, Nordlund P. Nature. 1993;366:537. doi: 10.1038/366537a0. [DOI] [PubMed] [Google Scholar]
- 7.Elango NA, Radhakrishnan R, Froland WA, Wallar BJ, Earhart CA, Lipscomb JD, Ohlendorf DH. Protein Sci. 1997;6:556. doi: 10.1002/pro.5560060305. [DOI] [PMC free article] [PubMed] [Google Scholar]
- 8.Whittington DA, Lippard SJ. J Am Chem Soc. 2001;123:827. doi: 10.1021/ja003240n. [DOI] [PubMed] [Google Scholar]
- 9.Lovell T, Li J, Noodleman L. Inorg Chem. 2001;40:5251. doi: 10.1021/ic010115j. [DOI] [PubMed] [Google Scholar]
- 10.Kovaleva EG, Neibergall MB, Chakrabarty S, Lipscomb JD. Acc Chem Res. 2007;40:475. doi: 10.1021/ar700052v. [DOI] [PMC free article] [PubMed] [Google Scholar]
- 11.Rinaldo D, Philipp DM, Lippard SJ, Friesner RA. J Am Chem Soc. 2007;129:3135. doi: 10.1021/ja0654074. [DOI] [PMC free article] [PubMed] [Google Scholar]
- 12.Han WG, Noodleman L. Inorg Chim Acta. 2008;361:973. doi: 10.1016/j.ica.2007.06.007. [DOI] [PMC free article] [PubMed] [Google Scholar]
- 13.Shu LJ, Nesheim JC, Kauffmann K, Munck E, Lipscomb JD, Que L. Science. 1997;275:515. doi: 10.1126/science.275.5299.515. [DOI] [PubMed] [Google Scholar]
- 14.Siegbahn PEM, Crabtree RH, Nordlund P. JBIC Journal of Biological Inorg Chem. 1998;3:314. [Google Scholar]
- 15.Banerjee R, Proshlyakov Y, Lipscomb JD, Proshlyakov DA. Nature. 2015;518:431. doi: 10.1038/nature14160. [DOI] [PMC free article] [PubMed] [Google Scholar]
- 16.Brunold TC. Proc Nat Acad Sci. 2007;104:20641. doi: 10.1073/pnas.0710734105. [DOI] [PMC free article] [PubMed] [Google Scholar]
- 17.Xue G, Wang D, De Hont R, Fiedler AT, Shan X, Münck E, Que L. Proc Nat Acad Sci. 2007;104:20713. doi: 10.1073/pnas.0708516105. [DOI] [PMC free article] [PubMed] [Google Scholar]
- 18.Johansson AJ, Noack H, Siegbahn PEM, Xue G, Que L., Jr Dalt Trans. 2009:6741. doi: 10.1039/b907263b. [DOI] [PMC free article] [PubMed] [Google Scholar]
- 19.Xue G, De Hont R, Münck E, Que L. Nat Chem. 2010;2:400. doi: 10.1038/nchem.586. [DOI] [PMC free article] [PubMed] [Google Scholar]
- 20.Do LH, Xue G, Que L, Lippard SJ. Inorg Chem. 2012;51:2393. doi: 10.1021/ic202379b. [DOI] [PMC free article] [PubMed] [Google Scholar]
- 21.Stoian SA, Xue GQ, Bominaar EL, Que L, Munck E. J Am Chem Soc. 2014;136:1545. doi: 10.1021/ja411376u. [DOI] [PMC free article] [PubMed] [Google Scholar]
- 22.Rosenzweig AC. Nature. 2015;518:309. doi: 10.1038/nature14199. [DOI] [PMC free article] [PubMed] [Google Scholar]
- 23.Kodera M, Ishiga S, Tsuji T, Sakurai K, Hitomi Y, Shiota Y, Sajith PK, Yoshizawa K, Mieda K, Ogura T. Chem Eur J. 2016;22:5924. doi: 10.1002/chem.201600048. [DOI] [PubMed] [Google Scholar]
- 24.Hill EA, Weitz AC, Onderko E, Romero-Rivera A, Guo Y, Swart M, Bominaar EL, Green MT, Hendrich MP, Lacy DC, Borovik AS. J Am Chem Soc. 2016;138:13143. doi: 10.1021/jacs.6b07633. [DOI] [PMC free article] [PubMed] [Google Scholar]
- 25.Rohde JU, In JH, Lim MH, Brennessel WW, Bukowski MR, Stubna A, Munck E, Nam W, Que L. Science. 2003;299:1037. doi: 10.1126/science.299.5609.1037. [DOI] [PubMed] [Google Scholar]
- 26.Shan XP, Que L. J Inorg Biochem. 2006;100:421. doi: 10.1016/j.jinorgbio.2006.01.014. [DOI] [PubMed] [Google Scholar]
- 27.Klinker EJ, Kaizer J, Brennessel WW, Woodrum NL, Cramer CJ, Que L. Angew Chem Int Ed. 2005;44:3690. doi: 10.1002/anie.200500485. [DOI] [PubMed] [Google Scholar]
- 28.Siegbahn PEM. Inorg Chem. 1999;38:2880. doi: 10.1021/ic981332w. [DOI] [PubMed] [Google Scholar]
- 29.Lovell T, Han WG, Liu TQ, Noodleman L. J Am Chem Soc. 2002;124:5890. doi: 10.1021/ja0121282. [DOI] [PubMed] [Google Scholar]
- 30.Friedle S, Reisner E, Lippard SJ. Chem Soc Rev. 2010;39:2768. doi: 10.1039/c003079c. [DOI] [PMC free article] [PubMed] [Google Scholar]
- 31.Huang SP, Shiota Y, Yoshizawa K. Dalt Trans. 2013;42:1011. doi: 10.1039/c2dt31304a. [DOI] [PubMed] [Google Scholar]
- 32.Hämäläinen K, Siddons DP, Hastings JB, Berman LE. Phys Rev Lett. 1991;67:2850. doi: 10.1103/PhysRevLett.67.2850. [DOI] [PubMed] [Google Scholar]
- 33.Lima FA, Bjornsson R, Weyhermuller T, Chandrasekaran P, Glatzel P, Neese F, DeBeer S. Phys Chem Chem Phys. 2013;15:20911. doi: 10.1039/c3cp53133c. [DOI] [PubMed] [Google Scholar]
- 34.Kowalska JK, Lima FA, Pollock CJ, Rees JA, DeBeer S. Israel J Chem. 2016;56:803. [Google Scholar]
- 35.Rees JA, Bjornsson R, Kowalska JK, Lima FA, Schlesier J, Sippel D, Weyhermuller T, Einsle O, Kovacs JA, DeBeer S. Dalt Trans. 2017;46:2445. doi: 10.1039/c7dt00128b. [DOI] [PMC free article] [PubMed] [Google Scholar]
- 36.Westre TE, Kennepohl P, DeWitt JG, Hedman B, Hodgson KO, Solomon EI. J Am Chem Soc. 1997;119:6297. [Google Scholar]
- 37.DeBeer George S, Petrenko T, Neese F. J Phys Chem A. 2008;112:12936. doi: 10.1021/jp803174m. [DOI] [PubMed] [Google Scholar]
- 38.Chandrasekaran P, Stieber SCE, Collins TJ, Que L, Neese F, DeBeer S. Dalt Trans. 2011;40:11070. doi: 10.1039/c1dt11331c. [DOI] [PMC free article] [PubMed] [Google Scholar]
- 39.Roemelt M, Beckwith MA, Duboc C, Collomb MN, Neese F, DeBeer S. Inorg Chem. 2012;51:680. doi: 10.1021/ic202229b. [DOI] [PubMed] [Google Scholar]
- 40.Banerjee R, Meier KK, Munck E, Lipscomb JD. Biochem. 2013;52:4331. doi: 10.1021/bi400182y. [DOI] [PMC free article] [PubMed] [Google Scholar]
- 41.Xue G, Fiedler AT, Martinho M, Münck E, Que L. Proc Nat Acad Sci. 2008;105:20615. [Google Scholar]
- 42.Rohde GT. PhD Thesis. University of Minnesota; Pleasant St SE, Minneapolis, MN 55455: 2015. [Google Scholar]
- 43.Sole VA, Papillon E, Cotte M, Walter P, Susini J. Spectrochim Acta B. 2007;62:63. [Google Scholar]
- 44.Delgado-Jaime MU, Mewis CP, Kennepohl P. J Synchrotron Rad. 2010;17:132. doi: 10.1107/S0909049509046561. [DOI] [PubMed] [Google Scholar]
- 45.Neese F. Coord Chem Rev. 2009;253:526. [Google Scholar]
- 46.Neese F. Wires Comput Mol Sci. 2012;2:73. [Google Scholar]
- 47.Grimme S, Antony J, Ehrlich S, Krieg H. J Chem Phys. 2010;132:154104. doi: 10.1063/1.3382344. [DOI] [PubMed] [Google Scholar]
- 48.Krewald V, Lassalle-Kaiser B, Boron TT, Pollock CJ, Kern J, Beckwith MA, Yachandra VK, Pecoraro VL, Yano J, Neese F, DeBeer S. Inorg Chem. 2013;52:12904. doi: 10.1021/ic4008203. [DOI] [PMC free article] [PubMed] [Google Scholar]
- 49.Neese F. Inorg Chim Acta. 2002;337:181. [Google Scholar]
- 50.DeBeer George S, Brant P, Solomon EI. J Am Chem Soc. 2005;127:667. doi: 10.1021/ja044827v. [DOI] [PubMed] [Google Scholar]
- 51.Berry JF, DeBeer George S, Neese F. Phys Chem Chem Phys. 2008;10:4361. doi: 10.1039/b801803k. [DOI] [PubMed] [Google Scholar]
- 52.Martinho M, Xue G, Fiedler AT, Que JL, Bominaar EL, Münck E. J Am Chem Soc. 2009;131:5823. doi: 10.1021/ja8098917. [DOI] [PMC free article] [PubMed] [Google Scholar]
- 53.Dassama LMK, Silakov A, Krest CM, Calixto JC, Krebs C, Bollinger JM, Green MT. J Am Chem Soc. 2013;135:16758. doi: 10.1021/ja407438p. [DOI] [PMC free article] [PubMed] [Google Scholar]
- 54.Riggs-Gelasco PJ, Shu L, Chen S, Burdi D, Huynh BH, Que L, Stubbe J. J Am Chem Soc. 1998;120:849. [Google Scholar]
Associated Data
This section collects any data citations, data availability statements, or supplementary materials included in this article.


