

Abstract
Combinatorial expansion by the cerebellar granule cell layer (GCL) is fundamental to theories of cerebellar contributions to motor control and learning. Granule cells (GrCs) sample approximately four mossy fiber inputs and are thought to form a combinatorial code useful for pattern separation and learning. We constructed a spatially realistic model of the cerebellar GCL and examined how GCL architecture contributes to GrC combinatorial diversity. We found that GrC combinatorial diversity saturates quickly as mossy fiber input diversity increases, and that this saturation is in part a consequence of short dendrites, which limit access to diverse inputs and favor dense sampling of local inputs. This local sampling also produced GrCs that were combinatorially redundant, even when input diversity was extremely high. In addition, we found that mossy fiber clustering, which is a common anatomical pattern, also led to increased redundancy of GrC input combinations. We related this redundancy to hypothesized roles of temporal expansion of GrC information encoding in service of learned timing, and we show that GCL architecture produces GrC populations that support both temporal and combinatorial expansion. Finally, we used novel anatomical measurements from mice of either sex to inform modeling of sparse and filopodia-bearing mossy fibers, finding that these circuit features uniquely contribute to enhancing GrC diversification and redundancy. Our results complement information theoretic studies of granule layer structure and provide insight into the contributions of granule layer anatomical features to afferent mixing.
SIGNIFICANCE STATEMENT Cerebellar granule cells are among the simplest neurons, with tiny somata and, on average, just four dendrites. These characteristics, along with their dense organization, inspired influential theoretical work on the granule cell layer as a combinatorial expander, where each granule cell represents a unique combination of inputs. Despite the centrality of these theories to cerebellar physiology, the degree of expansion supported by anatomically realistic patterns of inputs is unknown. Using modeling and anatomy, we show that realistic input patterns constrain combinatorial diversity by producing redundant combinations, which nevertheless could support temporal diversification of like combinations, suitable for learned timing. Our study suggests a neural substrate for producing high levels of both combinatorial and temporal diversity in the granule cell layer.
Keywords: cerebellum, combinatorial expansion, combinatorics, granule cell, motor learning, Purkinje
Introduction
Expansion recoding is a leading hypothesis for the role of the dense cerebellar granule cell layer (GCL) (Marr, 1969; Albus, 1971). This network consists of vast numbers of small granule cells (GrCs) that possess on average just four dendrites (Eccles et al., 1967; Herculano-Houzel, 2010). Inputs to this layer are dominated by mossy fiber rosettes (MFRs), which are large presynaptic terminals that branch off of mossy fiber axons (MFs) and convey sensorimotor information from numerous structures into the cerebellum. MFRs form the core of synaptic glomeruli where they are contacted by numerous GrC dendrites, such that each GrC samples ∼4 MFRs and sparsely represents convergent afferent input in higher dimensional space, which is thought to be critical for sensorimotor integration in service of motor learning (see Fig. 1A) (Marr, 1969; Blomfield and Marr, 1970; Albus, 1971). Many studies support these ideas, and similar anatomical organization has been observed in brain areas as diverse as electric fish electrosensory lateral line lobe, fruit fly mushroom bodies, mammalian olfactory cortex, and dorsal cochlear nucleus, suggesting a conserved computational function (Sawtell, 2010; Caron et al., 2013; Kennedy et al., 2014).
Figure 1.

Theoretical limitations of GrC input combinations based on MFR-to-GrC ratios. A, Schematic diagram illustrating the MFR-GrC-Purkinje circuit and terminology. MFRs with IDs w-z converge onto a specific GrC. This combination of MFRs to this GrC represents the quartet for the illustrated GrC. Throughout the study, we examined how the diversity of MFR combinations onto GrCs relates to patterns of MFR inputs. B, The number of theoretical permutations of MFRs is given by the binomial coefficient, defined by n choose k with replacement, where n is the number of MFRs and k is the number of inputs combined per GrC. The binomial coefficient, for n choose 4 with replacement (black), is overlaid with the linear function (red) showing the ratio of GrCs to MFRs. The intersections of the curves indicate that, based on the linear relationship of MFRs to GrCs, GrCs could fully permute a maximum of 5 unique MFRs. C, Similar to B, but with the linear function relating GrCs to MFs, taking into account multiple MFRs per MF axon. D, The binomial coefficient (black trace; n choose 4 with replacement) is plotted against the number of unique MF IDs that could theoretically be permuted (equivalent to n). The cat cerebellum contains an estimated 2–4 billion GrCs (red lines), indicating that the cat GCL could fully permute 470–560 different MFRs. To distribute those MFR identities over the 77 million MFRs estimated to occupy the cat cerebellum, these unique sources would have to be duplicated between 2735 and 4595 times. PKJ, Purkinje.
A central tenet of the recoding hypothesis is that GrC activity is very sparse because of the extensive combinatorial diversity of GrC inputs, where the likelihood of two GrCs sharing the same combination of MFR inputs is low. Yet recent studies using Ca2+ imaging to monitor GrC population activity have called into question the sparseness of GrC activity. These studies have noted higher densities of active GrCs than predicted by classic theory (Giovannucci et al., 2017; Knogler et al., 2017; Wagner et al., 2017). How dense activation of GrCs would be supported by highly diverse combinations of inputs onto GrCs is unclear. Furthermore, these dense activity patterns would seem to suggest degradation of the high dimensionality produced by sparse GrC activity, raising the question of the computational utility of redundant GrCs.
While the original study by Marr (1969) assumed relatively uniform access of GrCs to MF afferents, precerebellar sources encoding diverse signals often ramify in dense patches, suggesting nonuniform mixing of inputs. Such anatomical features have contributed to refinement of cerebellar cortical theory (Billings et al., 2014; Spanne and Jorntell, 2013, 2015; D'Angelo, 2017; Cayco-Gajic et al., 2017). For instance, spatial correlations of MFR inputs can enhance information transmission in models of the GCL (Billings et al., 2014). Furthermore, studies of delay eyelid conditioning reveal that well-timed learning occurs even with dense electrical activation of MFs (Steinmetz et al., 1986; Freeman and Rabinak, 2004, Halverson et al., 2009). These observations have led to theories proposing temporal expansion of GrC population activity, where GrCs receiving similar inputs nevertheless sparsely fire throughout the conditioning window (Mauk and Donegan, 1997; Medina et al., 2000).
We propose that dense GrC activity patterns could be explained by MF ramification patterns, and that this density could support temporal expansion processes in the GCL. We used an anatomically realistic model to test the hypothesis that dense ramification patterns of MFRs would produce redundant MFR combinations on GrCs, potentially contributing to denser activations than originally proposed. We also examined how other morphological and organizational features of the GCL (i.e., MF diversity, GrC dendrite length, and a morphological specialization of MFRs composed of long, thin synaptic extensions that contact GrCs, called filopodia) contribute to and constrain GrC combinatorial diversity. Anatomical details in the model were validated in empirical observations of the nucleocortical and pontine MF systems, described here. Together, our findings illuminate both the capacity of the layer to confer mixed selectivity to GrCs in service of pattern separation (Rigotti et al., 2013; Litwin-Kumar et al., 2017), and the level of redundancy (i.e., the number of identical MFR combinations) likely to emerge within the layer in support of temporal expansion encoding.
Materials and Methods
The goal of this study was to address how anatomical features of the cerebellar GCL influence GrC combinatorial diversity (i.e., the uniqueness of MFR combinations made by GrCs). To address these questions, we combined anatomical observations with a model that mimics the geometric organization of the GCL. We varied model parameters to test the role of specific anatomical features to GrC combinatorial diversity. Anatomical and modeling methods are described below.
Anatomy: subjects.
Adult C57/B6 mice (Charles River; n = 9 mice) of either sex were used in accordance with the National Institutes of Health Guidelines and the Institutional Animal Care and Use Committee at the University of Colorado Anschutz Medical Campus. Animals were housed in an environmentally controlled room, kept on a 12:12 light/dark cycle, and had ad libitum access to food and water. A total of 9 mice were used in the entire study.
Virus injections.
For all surgical procedures, mice were anesthetized with intraperitoneal injections of a ketamine hydrochloride (100 mg/kg) and xylazine (10 mg/kg) mixture, placed in a stereotaxic apparatus, and prepared for surgery with a scalp incision. Craniotomies were made above the cerebellar nuclei (1 injection from lambda: 2.0 mm posterior, 1.0 mm lateral, 2.5 ventral; n = 9/9 mice); and the basilar pontine nuclei (from bregma) 4.0–4.5 mm posterior, 0.4 mm lateral, and 5.5 mm ventral (n = 4/9 mice). Pressure injections of 0.15–0.25 μl AAV1.hSyn1.mCherry (University of North Carolina Vector Core) and AAV1.hSyn1.eYFP were made using a 1 μl Hamilton Neuros syringe attached to the stereotaxic apparatus (Stoelting). Virus use was approved by and in accordance with the University of Colorado Anschutz Institutional Biosafety Committee. All surgeries included postoperative analgesia with intraperitoneal injections of carprofen (5 mg/kg) once per 24 h for 48 h. Mice were housed postoperatively for 3–6 weeks before perfusion to allow for reporter expression throughout the entirety of the axonal arbor.
Tissue preparation for light microscopy.
Mice were deeply anesthetized with an intraperitoneal injection of sodium pentobarbital (Fatal Plus, Vortech Pharmaceuticals) and perfused transcardially with 0.9% saline followed by 4% PFA in 0.1 m phosphate buffer. Brains were removed and postfixed for at least 24 h and then cryoprotected in 30% sucrose. Brains were sliced in 40 μm serial coronal sections using a freezing microtome, stored in phosphate buffer, and coverslipped in Fluoromount-G (SouthernBiotech) mounting medium.
Anatomical measurements.
A total of 1658 MFRs in 9 mice were analyzed, spanning cerebellar lobules, including Crus I, Crus II, Paramedian, Simple, and vermal lobules 3, 4, 5, and 6. MFRs were labeled from cerebellar nuclear and/or pontine injections. Rosettes were imaged on a Marianas spinning disc confocal microscope with a 63× objective. To quantify nearest neighbors, montages of Lobules 6 and Crus 1 were produced from high-resolution images, and the location of each MFR was mapped (n = 874 boutons; n = 4 dual injected mice, Lobules 6 and Crus 1). We noted the presence or absence of filopodia on these MFRs and an additional 784 MFRs from 5 additional mice located throughout the cerebellum for a total of 1658 MFRs. Euclidean distance from each rosette to its 4 nearest neighbors was then computed and analyzed in MATLAB (RRID:SCR_001622). To quantify the number and distance of the filopodia from the MFR, 84 rosettes were analyzed, with 70 fully reconstructed in 3D using Neurolucida 360 software (RRID:SCR_001775) (see Fig. 6). Filopodial boutons were defined as swellings at least 1 μm wide on processes that extended from the main rosette but did not leave the section (Gao et al., 2016).
Figure 6.
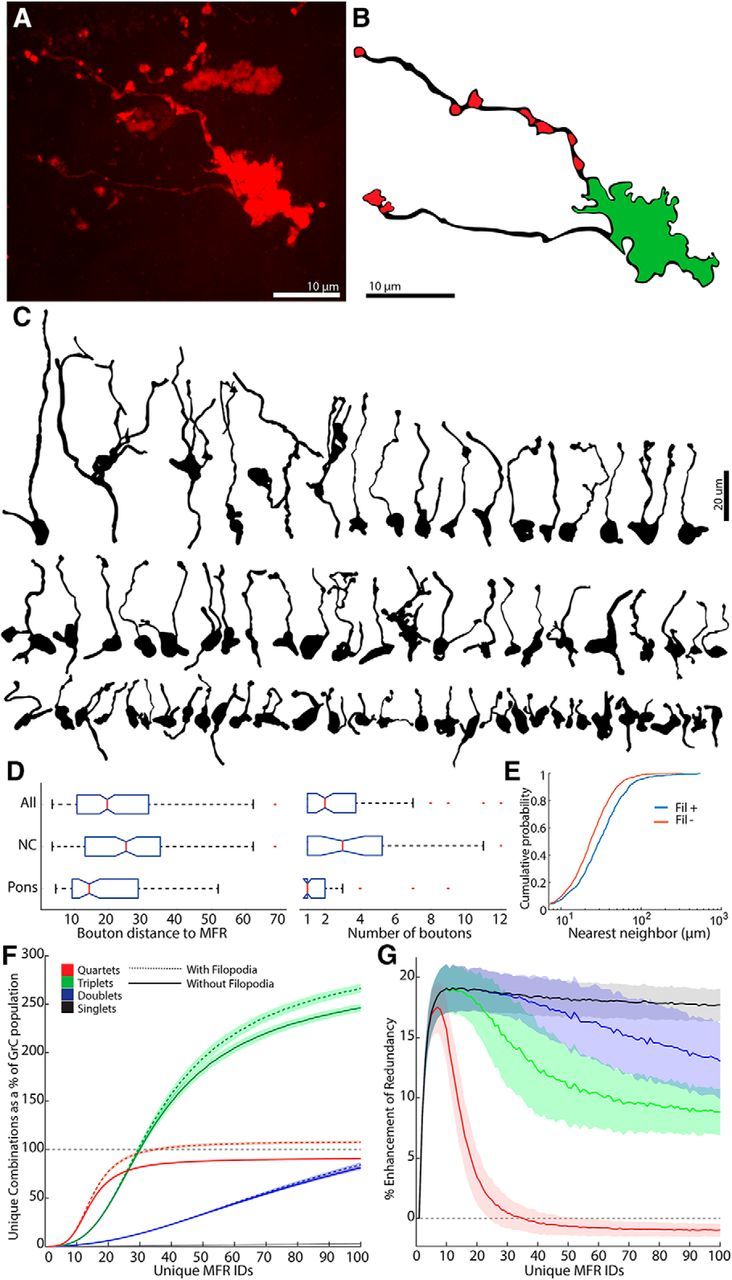
MF filopodia enhance both combinatorial diversity and redundancy produced by GCL. A, Representative image of an MFR bearing filopodia. B, A reconstruction of MFR in A that illustrates the MFR in green and putative filopodial boutons in red. C, Reconstructions of 70 MFRs from 9 mice that bore filopodia, illustrating morphological diversity. D, Box plots of median and interquartile ranges of distances of filopodial boutons to the MFR and the number of boutons/MFR for pontine fibers, nucleocortical fibers, and both sources (n = 84 MFRs, 9 mice). E, Cumulative distribution plot of nearest neighbors between filopodia bearing and nonfilopodia bearing MFR, showing that filopodia-bearing rosettes are more sparsely positioned (n = 874 boutons, 4 mice, 8 injections). F, Total number of unique combinations of inputs plotted as a function of MFR diversity when 20% MFRs bore between 1 and 5 filopodial boutons, contacting GrCs within 22 μm in the spatially constrained model. Filopodia enhance the total number of all sizes of combinations, such that the total unique quartets outnumber GrCs. G, Percentage increase in MFR combination redundancy seen when filopodia are added to 20% of MFRs (see Materials and Methods).
Experimental design and statistical analyses.
Anatomical observations were made in 4–9 mice. Nearest neighbor measurements were made with custom scripts in MATLAB and computed the Euclidean distances of the 4 nearest neighbors of each MFR in 2 dimensions in the coronal plane. Summary data of nearest neighbors are visualized in cumulative distribution functions and populations compared with the two-sample Kolmogorov–Smirnov test in MATLAB, with p values and n values reported in the text. Simulations were validated by performing multiple instantiations of modeled systems described in each section below.
Modeling: model-free calculations.
Theoretical numbers of MFR combinations, given the number of synapses per GrC, were computed using n choose k with replacement, where n is the number of MFRs and k is the number of inputs per GrC (see Fig. 1).
Simulations.
We modeled groups of MFs and GrCs in MATLAB with density and spatial relationships based on anatomical and physiological data (Palkovits et al., 1971; Sultan, 2001; Solinas et al., 2010). Specifically, the model incorporated physiological density and distribution of GrCs and MFRs, the length of GrC dendrites, and the divergence and convergence of MFRs onto GrCs (Table 1).
Table 1.
Anatomical data used in simulations
| Value | Used in simulation | Reference | |
|---|---|---|---|
| GrC density | 2.6 × 10⁶/1 mm3 | 2.6 × 10⁶/1 mm3 | Palkovits et al., 1971 |
| GrC synapses/MFR | 52–112 | 56–77, 10 systems | Palkovits et al., 1971; Jakab and Hámori, 1988 |
| MFRs/GrC | 4 | 4 | Palkovits et al., 1971 |
| GrC radius | 3 μm | 3 μm | Palay and Chan-Palay, 1974 |
| GrC dendrite length | 14 μm | 20 μm maximum | Palkovits et al., 1971 |
| MFR radius | 5.5 ± 1.8 μm | 5 μm | Sultan, 2001 |
| MFR density | 9.88 × 10⁴/1 mm3 | 9.88 × 10⁴/1 mm3 | Palkovits et al., 1971 |
| Glomerular spacing | 18.4 μm | 18.4 ± 2 μm | Palkovits et al., 1971 |
| GCL thickness | 254 μm | 250 μm | Palkovits et al., 1971 |
Measurements and citations for values used in simulations.
MFRs and GrCs were programmed to represent their 3D position in space and associated radii. Model systems were generated by first populating a defined space with MFRs. System dimensions were 100 × 100 × 250 μm and contained 3458 GrCs and 247 MFRs, except where noted. Each MFR was checked against every other existing MFR to ensure spatial nonoverlap, rejecting a placement if the distance between the centers was less than the sum of the radii. MFR tiling obeyed a flexible spacing constraint such that each MFR had three neighbors with a mean distance of 18.4 μm between them from center to center, consistent with anatomical measurements of glomerular spacing (Palkovits et al., 1971). To do this, we chose randomly from existing MFRs and placed a new rosette at 16.4–20.4 μm intervals. Perfectly even spacing of MFRs generated tetrahedrons, which do not tile in 3D space, so up to 2 μm of jitter about the mean spacing allowed for generation of nearly evenly spaced MFRs. MFR tiling approximated a tetrahedral matrix.
GrC placement followed a series of steps. First, seed locations were selected from either existing MFRs or GrCs; then a new GrC was placed a random distance away, excluding locations overlapping within the sum of the radii of existing elements. Second, GrCs made four random synaptic connections with nearby MFRs, limited to distances less than or equal to the sum of the dendrite length and MFR radii (28 μm, unless where noted). If the random location was not within reach of 4 MFRs, it was discarded. Third, GrCs synapsed preferentially onto MFRs that had <56 synapses with other GrCs, but MFR connectivity was capped at 80 GrCs. Overall, there was a range of 53–77 GrC synaptic connections per MFR, with a mean of 56 (SEM = 0.82, n = 151 systems). The final result was a modeled population with closely packed elements resembling the dense packing of GrCs within the GCL (see Fig. 2A).
Figure 2.

The spatial organization of the GCL restricts combinatorial expansion. A, We constructed spatially realistic models of the GCL, shown here in a simplified rendering. Large spheres represent simulated MFRs, with colors representing ID numbers. Gray spheres represent GrCs. Gray lines indicate GrC dendrites. A 247 MFR system is depicted here, with all synaptically connected GrCs per MFR rendered. Scale bar, ∼25 μm. B, Diagrams illustrating low- and high-diversity systems. Bottom rows, MFRs with ID indicated by color. GrCs (middle) combine local MFR inputs to assume a unique combinatorial identity (blended colors). Throughout the remainder of the study, we examine how MFR diversification and clustering in a spatial model of the GCL influence GrC combinatorial diversity, testing, for example, how spatial segregation of inputs favors particular combinations (e.g., the purple GrC, indicating that a theoretical combination of red and blue MFRs cannot exist because red and blue MFRs are too far apart). C, Effect of GrC dendrite length on access to unique MFRs (mean ± SEM; n = 10 systems with 10 trials each, for each MFR diversity level). An anatomically realistic dendritic range between 12 and 20 μm restricts access to ∼6 unique inputs, regardless of the diversity of the system. D, Populations of combinatorially unique GrCs as defined by their k-input combinations (quartets, triplets, etc.) as a function of increasing numbers of unique MFR identities uniformly distributed across the population. Dashed line indicates the total number of GrCs in the system. E, A function plotting the relative contribution of each additional MFR ID to the total number of MFR combinations made by GrCs (Eq. 1). As the model diversifies with increasing numbers of unique MFRs, fewer new combinations are produced per additional MFR ID number, peaking at 5%–20% diversity (i.e., between 5 and 20 MFRs/100 share the same ID) for quartet and triplet systems. This peak indicates the point beyond which increasing diversity contributes relatively less to the number of unique MFR combinations made by GrCs. F, The effect of MF LTP on combinatorial representation. With a GrC firing threshold of 4 active inputs, a full quartet of active MFRs is required to drive activity. As the strengths of inputs increase, the mean number of potential combinations that can drive a given GrC increase.
MFR diversity and spatial distribution modeling.
One goal of the present study was to understand how MFR diversity influences GrC combinatorial diversity. Because we were interested in identifying specific combinations of MFRs onto GrCs, we assigned an identity (ID) to each MFR. The ID terminology is a proxy for the source and/or uniqueness of the MFR, such that we can think of modeled MFRs as originating from different cells or different nuclei if they do not share an ID number. Throughout the text, we refer to MFRs as a general term that assumes each MFR has an ID, such that groups of MFRs imply the specific combination of ID numbers of MFRs converging on a GrC.
To examine the relationship between MFR diversity and GrC combinatorial diversity, we varied the number of different ID numbers assigned to a fixed number of MFRs. We refer to the number of different ID numbers in a system as n. In low-diversity systems, many MFRs had the same ID number, whereas in high-diversity systems, few to no MFRs shared an ID. We analyzed the combinations of MFR ID numbers formed by GrCs within the simulation, tracking the number of shared ID number combinations between different GrCs. The combinatorial diversity of GrCs refers to the number of different MFR combinations produced by the population of GrCs within the simulation. In some analyses, groups of MFRs converging on a GrC were subdivided into the quartet (the combination of 4 MFRs), triplets (any 3 of the 4 convergent MFRs), etc., noting that these MFR combination sizes are equivalent to the “codon” terminology used in Marr (1969). We also investigated the relative change in GrC combinatorial diversity produced by adding one additional ID number to the MFRs in the system, defined as follows:
 |
where unique GrCs refers to the number of unique MFR ID number combinations produced by the system GrCs, total MFRs is the number of MFRs in the system, and n is the number of ID numbers assigned to the MFRs.
Another feature of MF patterning that we simulated was clustering of similar MFRs. To examine the effect of MFR clustering on the diversity of MFR combinations produced by GrCs, we populated the simulation with MFRs assigned ID numbers drawn from a Gaussian-like probability distribution generated using the randn function in MATLAB. In effect, this method led to nonuniform representation of specific ID numbers within the system, with many MFRs assigned highly probable ID numbers, mimicking clustering. These systems were compared with nonclustered models, in which ID numbers were selected from a flat ID probability distribution, producing a space in which each ID number was equally likely. These systems were analyzed for diversity, redundancy, and fraction of theoretically possible combinations produced, with analyses repeated in 100 trials across 100 systems (120 × 120 × 100 μm in size, containing 142 MFRs and 1988 GrCs). Redundancy of a particular combination of MFRs on modeled GrCs was defined as the number of GrCs in that system possessing identical combinations of MFRs (i.e., the same quartet). The system redundancy was the mean number of repeats of MFR combinations formed by GrCs in that system. Diversity was defined as the total number of unique combinations of MFR inputs of a given size in the GrC population. We refer to redundancy changes as a function of MFR diversity as redundancy(n) where n is the number of different ID numbers.
A related spatial pattern of MFR termination that we modeled was sparsity. Here, a random MFR was chosen from a standard model and was given a new, unique ID number. This analysis was repeated across a range of ID diversity levels in 150 different system instantiations with 5 trials each. To analyze the diversity and redundancy of MFR combinations with sparse fibers included, three different types of systems were compared: (1) systems with n inputs, called baseline systems, where n is the number of different ID numbers; (2) systems with n inputs, in which a single rosette is changed to a unique input, called sparse systems; and (3) systems with n + 1 inputs distributed uniformly, termed expanded systems. The expanded system was essential to the comparisons because it allowed us to compute whether the effect of sparseness on GrC combinatorial diversity was solely a consequence of adding an additional input. Using these systems, we first calculated differences in diversity and redundancy in the sparse and expanded systems relative to baseline. We then compared changes in diversity and redundancy between these conditions, expressed as a percentage difference in the effect of the sparse or uniformly expanded inputs, defined by the following:
 |
The diversity measurements were identical, substituting redundancy for diversity.
We postulated that dense afferents serve a computational purpose that could be disrupted by adding another uniformly distributed input. We therefore asked whether a sparse input, when added to a preexisting system, preserves GrC combinatorial patterns differently than adding another uniform input.
We analyzed the retention of existing GrC combinations in the baseline system upon addition of a sparse or expanded input type by computing a retention index: First, each MFR quartet in the baseline system was given a value of 1, with redundant MFR combinations summed, such that the value reflected the number of repeats of a given combination. Next, each combination in the sparse or expanded systems was scored similarly. Finally, each combination in the baseline system was then compared with each combination in the new system, receiving a retention score given by baseline value divided by new system value. If a combination was lost in the new system, it was scored as a 0. The mean score for all combinations was computed for comparisons between baseline and sparse and baseline and expanded. Finally, to compare how different types of systems retained combinations, we computed a metric that took the ratio of retention scores between the systems, defined as follows:
 |
Dimensionality calculations.
The GCL is hypothesized to act as a combinatorial expander, increasing the dimensionality of inputs (Marr, 1969; Albus, 1971). Because dimensionality is a function of the independence of neuronal activity, coincident neural activity produced by redundant MFR combinations would be expected to reduce the dimensionality. Therefore, to explore the dimensionality of systems as a function of MFR diversity, we generated 150 different systems of GrCs and MFRs as described above. Within each system, we simulated a range of MFR diversity levels where between 1 and 100 different MFR ID numbers were assigned to the MFR population. We established a proxy for neuronal activity where GrCs were considered active when three of their four MFRs were synchronously active (Jörntell and Ekerot, 2006; Billings et al., 2014). The MFR activity level was set such that, on average, 10% of MFRs in the simulation were active at a given time (Litwin-Kumar et al., 2017), over 1000 epochs. The activity of a given MFR ID number was determined by assigning it a value from a random number generator every epoch. When the random number exceeded a predetermined threshold, the ID number was active. In low-diversity systems, many MFRs share the same ID number, rendering many MFRs coincidently active. The threshold for determining an active ID number from the random number generator was therefore varied to ensure that, even in low-diversity systems, with many MFRs possessing the same ID, the mean total active population was maintained at 10%. A total of 1000 epochs were generated in each simulation, and all pairwise GrC correlations and variance of correlations were measured over all the epochs. Five trials of each simulation were performed, and the average correlation and variance measured and used in Equation 4 (below). In total, 500,000 epochs for each diversity level were analyzed.
To assay the dimensionality produced by combinatorial expansion (CE) of the model GCL as a function of diversity level, n, we used the following equation:
 |
where n is the number of unique MFR ID numbers in the model, M is the number of GrCs, <corr(GrCi,GrCj)>2 is the squared mean correlation coefficient of the activities of GrCi and GrCj over all pairwise GrC comparisons, i and j, across all epochs, and <var(corr(GrCi,GrCj))> is the mean variance of all pairwise correlations across all epochs as described by Litwin-Kumar et al. (2017). This calculation was repeated for each system and averaged for each value of n.
A prominent hypothesis in cerebellar literature proposes that GrCs receiving correlated inputs become temporally diversified (i.e., fire at different times despite receiving the same input), leading to increased dimensionality supporting learned timing (see Fig. 3A,C) (Mauk and Donegan, 1997; Medina et al., 2000), which is not captured in Equation 4. Behavioral measurements of intervals over which an animal can learn a conditioned response suggest that information can be diversified up to 500 ms, with physiological measurements showing individual GrCs bursting for ∼20 ms (Schneiderman and Gormezano, 1964; Smith et al., 1969; Ishikawa et al., 2015). At the limit, every GrC could be decorrelated from every other GrC, producing maximal dimensionality even if each GrC received identical inputs. However, based on GrC burst times, this would predict unrealistically long temporal expansion windows. We therefore used physiological estimates of temporal learning windows to constrain a metric for temporal expandability (TE) where we penalized over- or under-representation of dimensions produced by CE, for a given time window. We defined over-representation (Ro) and under-representation (Ru) as follows:
 |
 |
where n is the number of different MFR ID numbers, M is the number of GrCs, and CE(n) is the dimensionality of the system computed using Equation 4. The Ro formula returns the number of “extra” GrCs over all dimensions that are unnecessary for complete temporal expansion over the trespmax interval (500 ms), assuming a given GrCresponse burst duration (20 ms). The Ru formula returns the difference between the number of GrCs that would be needed to completely represent the time window and the number of GrCs per dimension, scaled by the optimal number of GrCs needed per dimension to represent the time interval. When either Ro or Ru returned a negative value, we set the metric to 0.
Figure 3.

Spatial patterning enhances temporal expansion of GrC representation. A, Diagram illustrating the hypothesized tradeoff between CE and TE, which requires redundant MFR combinations (shared colors) by multiple GrCs. B, CE dimensionality plotted as a function of MFR diversity for the spatially constrained model “physiological” and nonspatial model. C, The composite of TECE for physiologically constrained (red) and nonspatial (black models) for a time window of 500 ms. At higher MFR diversity levels, the spatially realistic model possesses greater TECE dimensionality than the nonspatial model because it both expands combinations and produces redundancy required for temporal expansion of dimensions.
We then used these penalties to compute a function that captures both the temporal expansion (TE) and CE (TECE) as follows:
Where M is the number of GrCs (and maximum dimensionality), from which the lost dimensionality that occurs due to the Ro and Ru terms is subtracted.
Finally, we tested differences in the TECE(n) calculated for models in which spatial relationships were included (physiological) and models in which there were no spatial constraints considered (nonspatial). The nonspatial model used here was simulated by assigning 4 MFR IDs at random to each GrC in a model system of the same size as the physiological system, regardless of space.
Filopodia modeling.
Statistics of MFR filopodia gathered from the anatomical experiments were used in the spatial GCL model to mimic fiolopodia. We simulated filopodia by adding between 1 and 5 (median, 2) synaptic connections with GrCs within 22 μm of the MFR. We added simulated filopodia to between 8% and 20% of MFRs. This was simulated in 450 different systems, with 5 trials each.
Results
Theoretical limits on combinatorics imposed by GrC-to-MF ratios
Expansion recoding is a leading hypothesis for the role of the dense cerebellar granule layer network formed with MFRs. First proposed by Marr (1969) and elaborated by Albus (1971), the idea that GrCs sample ∼4 MFRs and represent convergent afferent input in higher dimensional space is central to ideas of cerebellar sensorimotor integration (Fig. 1A). Before analyzing how GCL organizational features influence the number of different combinations of MFRs represented by the GrCs (i.e., combinatorial diversity), we made a series of simple calculations defining the maximum number of MFR permutations possible, given MFR diversity. These calculations highlight the fact that complete permutation of cerebellar inputs is not physiologically realistic, and motivate the spatially constrained modeling. The theoretical number of permutations of MFRs can be computed using the binomial coefficient, n choose k, with replacement, where n is the number of unique MFRs and k is the number of inputs per GrC. We compared these values with the number of GrCs that exist per MFR (14:1), based on numerical ratios derived from anatomical estimates (Jakab and Hámori, 1988). The rapid increase in the binomial coefficient as a function of MFR numbers quickly exceeds the number of GrCs that exist (Fig. 1B,C) such that, when there are >5 or 6 MFRs in a system of 84 GrCs, some MFR quartets go unrepresented in the GrC population (Fig. 1B). Even when considering divergence, where each MF forms between 20 and 200 MFRs (McCrea et al., 1977; Shinoda et al., 1992; Wu et al., 1999; Quy et al., 2011), theoretical complete mixing is limited to between 18 and 31 unique sources in the GrC population of ∼6000–46,000, depending on the level of divergence (Fig. 1C, intersection of shaded regions and black curve). These calculations indicate that the cat granule layer, containing 2–4 billion GrCs and 77 million MFRs (Palkovits et al., 1971), could fully permute just 470–560 unique MFR sources, depending on the level of MF divergence. Therefore, the cerebellum would not represent all quartets unless each input is duplicated between 2700–4600 times, a highly unlikely scenario (Fig. 1D, blue shading).
Spatial constraints on granule layer combinatorics
The previous calculations do not take into account any spatial features of GCL organization, which would be expected to influence the diversity of convergence of MFRs onto GrCs. As an extreme example, two MFs that terminate in different lobules would obviously not converge on a common GrC. We speculated that the morphological features of the GCL might extend these spatial restrictions at local levels, where combinations of MFs ramifying even in a relatively local area might not be combined if GrC dendrites are too short to reach them (schematized in Fig. 2B). We therefore examined how the anatomy of the GCL influences the performance of the layer as a combinatorial expander. To address this, we developed a model that mimics the geometric organization of the GCL and manipulated spatial features to determine the role of specific anatomical features to GrC combinatorial diversity (Fig. 2A; see Modeling).
We first investigated the role of GrC dendrite length on access to local MFRs. We measured the effect of GrC dendrite length on the access to diverse MFRs in modeled systems with varying MFR diversity. We found that dendrite lengths falling within a physiological range (8–20 μm; shaded region) strongly limit access to MFRs. As the MFR diversity increases, GrCs cannot access that diversity because of the shortness of their dendrites (Fig. 2C). Therefore, locally, the number of MFRs accessible to GrCs is capped at <10, regardless of MFR heterogeneity. As expected, lengthening dendrites permitted GrCs to access a greater diversity of MFRs. Increasing the dendrite length from 20 to 60 μm allows a GrC to access 5- to 10-fold more unique MFRs, depending on the diversity of the local MF population (Fig. 2C).
We next computed the number of unique combinations of 4 MFRs produced by a modeled population of ∼3500 GrCs and ∼240 MFRs, taking into account spatial relationships of GrCs and MFRs. We assigned ID numbers to MFRs in the model and varied the diversity of the population of MFRs from being entirely homogeneous (where each MFR has the same ID) to entirely heterogeneous (where each MFR has a unique ID; Fig. 2D). Focusing here first on quartets (combinations of 4 inputs), the relationship between MFR diversity and number of different combinations formed on GrCs showed two striking features. First, GrCs are quickly saturated with unique MFR combinations as MFR diversity increases, illustrated by the asymptote in the number of unique GrC combinations (Fig. 2D, red curve). This cap on unique MFR combinations suggests that, with just moderate MFR diversity, most GrC input combinations are unique. As the MFR population continues to diversify, new unique MFR combinations replace other unique MFR combinations, illustrating the effectiveness of the GCL as a combinatorial expander. The apparent cap on diversification of quartets at ∼30 MFR IDs in this system indicates that quartets quickly approach the combinatorial limit imposed by GrC population sizes.
A second feature of GrC combinatorial diversity as a function of MFR diversity was that GrC combinatorial diversity is never maximal, asymptoting near 80% of GrCs bearing unique MFR combinations. That is, the number of unique combinations remains below the number of GrCs in the system, even when the MFR population is completely diverse. This phenomenon reflects local resampling of MFRs and indicates that multiple representations of specific combinations, while not dominant in the population, are a byproduct of short dendrites and glomerular presynaptic structures.
We next examined how the number of GrCs with different MFR combinations changes if we considered just a subset of the combination of 4 convergent MFRs (3, 2, or 1 MFR) because a subset of MFR afferents could produce redundant GrC activity (Jörntell and Ekerot, 2006; Billings et al., 2014). We found that, as the diversity of MFRs increases, the number of combinations of 3 MFRs produced by GrCs continues to increase beyond the point where quartets are saturated (Fig. 2D, green curve).
Regardless of combination size, we noticed a roll-off in the number of unique MFR combinations produced as the system diversifies. We explicitly computed the relationship between GrC combinatorial diversity and the addition of each new MFR, plotted in Figure 2E, by weighing each additional GrC-MFR combination against the ratio of total MFRs to unique MFRs (Eq. 1). The peaks in these curves indicate the point at which each additional MFR ID adds relatively less to overall GrC combinatorial diversity.
These analyses assume equal strength of MFR inputs to GrCs and spiking thresholds requiring coincident activity of quartets, triplets, or doublets. Interestingly, LTP at the MFR->GrC synapse has been observed, which might be predicted to change the effective subset of convergent MFRs onto a GrC. To test this idea, we established a thresholding rule on a GrC, but then increased the contribution of each MFR, simulating LTP at this synapse (Mapelli and D'Angelo, 2007). When inputs were allowed to strengthen, we found an increase in the number of combinations that could drive this population of GrCs (Fig. 2F). This diversity in driving inputs might be exploited by an adaptive filter via the Golgi cell (Billings et al., 2014). Furthermore, it would be predicted to produce denser recruitment of GrCs than in an unpotentiated state (Diwakar et al., 2011).
Spatial constraints enhance the capacity for temporal diversification of GrCs
These data show that the spatial organization of the granule layer limits the number of MFR permutations possible and produces redundant MFR combinations. The presence of redundant combinations of MFRs on GrCs in the spatially constrained model raised the question of whether there may be utility to redundancy that is not well captured by the dimensionality produced by CE. Theories of the expansion of specific information in the temporal domain (Mauk and Donegan, 1997; Medina et al., 2000) could explain the utility of redundant combinations because identical information sources could activate GrCs, which could be further diversified in time, in support of learned timing. For instance, if many GrCs share a dimension produced by combinatorial identity (Fig. 3A, “Low ID system” indicated by color), that dimension could be temporally expanded (TE). Alternatively, if GrCs are already extremely combinatorially diverse, and few GrCs are shared per dimension, the combinatorially defined dimension cannot be temporally expanded as extensively (Fig. 3A, bottom).
These features would predict reduced dimensionality of information represented by the system. We used a simplified model of GrC activity based on MFR activity and analyzed dimensionally as a function of MFR diversity (see Eq. 4). We calculated the dimensionality of the system with and without spatial constraints and found that, consistent with recent findings, the anatomically constrained “physiological” system showed a decrease in dimensionality relative to a nonspatial, randomly connected network (Fig. 3B) (Litwin-Kumar et al., 2017). We therefore considered the idea that GrCs with redundant combinations of MFRs could fire at different times because of either GCL circuitry or synaptic diversity (Medina et al., 2000; Chabrol et al., 2015). This scenario would both recover dimensionality lost by redundancy and support specific information being represented over extended time windows. Based on the temporal dynamics of GrCs and the limit of learned timing in delay eyelid conditioning, we modeled GrC activity such that each GrC was active for a 20 ms epoch (GrCresponse) over a 500 ms window (trespmax) (Schneiderman and Gormezano, 1964; Smith et al., 1969; Ishikawa et al., 2015). We assumed a cost to over- and under-representing a given combination over time (Eq. 5, 6) and measured the dimensionality of the time expanded simulation (TECE) over a range of MFR diversity levels (Eq. 7). Figure 3C shows the results of this simulation and analysis when added to the calculation of dimensionality produced by CE. Intuitively, the more redundant the combinations, the greater the capacity of the specific combinations to diversify over time. This intuition is supported by a peak in the temporal expansion (TECE) curve at low-diversity levels, which then dropped off with increasing MFR diversity. As the diversity of inputs increases, the layer falls short of providing enough GrCs to expand this information in time.
Importantly, the model with physiological spatial constraints showed improved performance over the nonspatial connectivity model, achieving both high combinatorial dimensionality and temporal expandability (Fig. 3C). The peaks of these curves occur when the number of GrCs per dimension is equal to the minimal number of GrCs required to completely fill the time interval (see Materials and Methods) and is therefore dependent on the temporal assumptions (GrCresponse and trespmax; Eqs. 5,6). The physiological model has higher TECE than the nonspatial model with temporal expansion windows >200 ms, within the range that rabbits readily learn conditioned stimuli (Schneiderman and Gormezano, 1964). At shorter trespmax (i.e., <200 ms), the nonspatial model has higher TECE. These calculations suggest that the granule layer may balance requirements to expand information temporally as well as diversify inputs as a result of CE.
Impact of MF heterogeneity on spatial organization of GrCs sharing inputs
Receptive fields of GrCs tend to be somatotopically patchy, suggesting redundant MF input to GrCs (Welker et al., 1984; Voogd and Glickstein, 1998; Jörntell and Ekerot, 2006; Garwicz et al., 1998). Because MFRs are sampled by many neighboring GrCs, local sharing of a given MFR is expected, and we therefore examined the spacing of GrCs that share a given number of MFRs in our model. We measured the spatial relationship between GrCs that shared one or more common inputs (i.e., inputs had common MFR ID numbers). As MFR diversity increased, the distance between GrCs sharing inputs diminished rapidly (Fig. 4A,B). We analyzed this phenomenon by measuring the Euclidian distance between all GrCs and classified them into groups determined by the similarity of their combinations. For example, with only five MFR ID numbers assigned to the MFR population, the spatial distribution of GrCs that share four specific MFR inputs or share no inputs are equally spaced, illustrated in a cumulative distribution of the distances between GrCs sharing inputs (Fig. 4A). By contrast, when the MFR population is diversified to the point that it is ∼25% diverse (1 in 4 MFRs shares an ID), GrCs that share the same 4 input ID numbers cluster within ∼20 μm of one another and GrCs that share no inputs remain homogeneously spaced within the volume (Fig. 4B,C). This can be seen comparing the red and black curves in Figure 4B, which plots distances of GrCs that share all or no inputs, respectively. These analyses were extended for modeled systems in which we varied MFR diversity systematically, ranging from all identical to all dissimilar. Distances between GrCs with shared input combinations drop with increased MFR diversity (Fig. 4C).
Figure 4.

Spatial clustering of GrCs with similar combinations emerges as a consequence of MFR access and diversity. A, Cumulative distributions plotting the distance between a GrC and every other GrC in the model that shares a given number of its MFR inputs (i.e., GrCs that share quartets, GrCs that share triplets) in a system with 5 different MFs (5 ID). B, Same as in A, but in a system with 20 different MFs (20 ID). Colors as in A. C, Summary of clustering effect as a function of MFR diversity, illustrating that dense spatial restriction of like combinations is most pronounced with high MFR diversity. Colors as in A. D, Illustration of spatial extent of GrCs sharing 4 inputs “quartets” (red), triplets (green), and doublets (blue). E, Summary of volumes occupied by like quartets, triplets, and doublets as a function of the diversity of MF IDs in the system.
While redundant quartets become highly restricted in space, GrCs that share 3, 2, or 1 MFR ID can remain fairly distant from one another, as shown in Figure 4B, C (green and blue curves). We visualized the space of shared MFR IDs in a modeled system with 20 MFR ID numbers (Fig. 4D). GrCs are plotted as gray points, and colored boxes surround GrCs that share MFR ID numbers. The volume occupied by GrCs with identical quartets (red box) is extremely circumscribed. The volume of the bounding box for identical quartets drops rapidly as MFR diversity increases (Fig. 4E, red curve), asymptoting ∼36 μm3, the volume occupied by the reach of a single MF. Similarly, bounding volumes of GrCs sharing MFR triplets or doublets also decrease as diversity increases (Fig. 4E, green and blue curves), implying that, although specific GrC MFR quartet combinations saturate quickly, the number of shared MFRs in the population continues to drop as MFR diversity increases, reducing the space over which GrCs share MFRs.
In summary, by increasing diversity of MFs, patchy representations emerge because of the spatial restrictions of the GrC dendrites and MFRs. Grouping also occurs as a consequence of MFR combination probabilities dropping off sharply in space, although subsets of inputs are shared by more widely spaced GrCs. This phenomenon suggests that local inhibition could regulate the size of the MFR combination relayed to Purkinje neurons, without sacrificing the subsets of the combinations completely, as would occur with maximal local diversity.
Impact of MF spacing on combinatorial diversity
MF afferents frequently appear to terminate within clusters in the GCL. For example, both the nucleocortical pathway and the basilar pontine nuclei pathway terminate in patches of cortex (Fig. 5A–C) (Huang et al., 2013; Houck and Person, 2015). Such clustering is common, with MFs from diverse sources terminating densely along zebrin stripes or in similarly spaced stripes within the layer (Sillitoe et al., 2010; Quy et al., 2011; Gebre et al., 2012; Gao et al., 2016; Valera et al., 2016). While MFs originating from the same nucleus do not necessarily carry the same information, single-cell label supports the idea that rosettes from the same fiber terminate densely (Sultan, 2001; Quy et al., 2011), and physiological data support the notion that GrCs can receive information from like fibers (Jörntell and Ekerot, 2006). Before including spatial clustering in our model, we measured the patchiness of two MF pathways, analyzing the distribution of MFRs. We labeled the nucleocortical and pontocerebellar pathways using AAVs expressing fluorescent proteins and analyzed MFRs in Crus 1 and Lobule 6, used as representative locations (see Materials and Methods). Nearest neighbor analyses from 874 rosettes revealed that most MFRs are clustered, existing within 100 μm of another MFR from the same source (Fig. 5C).
Figure 5.

Clustered MFs enhance redundancy at the expense of diversity. A, Representative example of patches of nucleocortical (green) and pontine (magenta) MFRs in mouse Lobule 7 (n = 4 mice, 8 injections). Scale bar, 200 μm. B, Representative example of both clustered (pontine, magenta) and sparse (nucleocortical, green) MFRs at the apex of Crus 1. Scale, 10 μm. C, Histogram of the mean distance of MFRs to their 4 closest neighbors labeled from the same injection (n = 874 rosettes, 4 mice). D, Percentage of the total theoretical combinations (n choose k with replacement) produced by the modeled system, as a function of the number of different MFRs in the system. Rosettes were positioned following a uniform probability distribution (i.e., no explicit rosette clustering). E, Percentage of maximal GrC combinatorial diversity produced as a function of MFR diversity when MFR IDs were clustered. F, The difference in the diversity of MFR combinations produced with clustered versus unclustered inputs, computed by subtracting curves in D, E. Unclustered MF distributions support more combinatorial diversity compared with clustered MF distributions. G, Percentage change in the redundancy of represented combinations in clustered systems versus uniform systems as a function of the number of unique MFRs in the system. At modest MFR diversity (∼20 IDs), clustering nearly doubles redundancy of combinations relative to unclustered fibers. H, The effect of sparseness on redundancy and diversity compared with a system with n + 1 uniformly distributed MFRs, plotted as a function of MFR diversity. A sparse rosette enhances redundancy but decrements diversity. I, Mean sparse retention index plotted as a function of MFR diversity. Sparse inputs retain more of the existing combinations than adding a uniform input.
We therefore explored the effect of these spatial characteristics on GrC combinatorial diversity in our model. We compared the GrC combinatorial diversity produced with unclustered versus clustered MFRs. To do this, we computed the number of unique GrC MFR combinations produced by the model as a function of MFR diversity relative to the number of theoretically possible combinations, based on n choose k with replacement, where k = 4, 3, or 2 for quartet, triplet, and doublet combinations, respectively (Fig. 5D,E, color coded by combination size). In unclustered models, MFR ID numbers were drawn at random from a uniform probability distribution. In clustered models, MFR ID numbers were drawn at random from a Gaussian-like probability distribution function, leading to over- and under-representation of specific ID numbers in the population. Clustering MFR ID numbers attenuated the fraction of theoretical diversity produced by the model compared with unclustered inputs (Fig. 5D–F) and enhanced the redundancy of MFR combinations (Fig. 5G).
The trade-off between diversity and redundancy observed with clustering raised related questions of whether other features of MF organization affect these parameters. In addition to clustered inputs (Fig. 5A,C), we noted that, although rarer, MFRs can appear hundreds of microns away from rosettes from the same source (Fig. 5B,C). We therefore asked how these sparse, numerically limited, MFRs contribute to GrC combinatorial diversity. We analyzed diversity and redundancy of GrC combinations produced in model systems mimicking these anatomical features. We modeled three systems to facilitate comparisons. The baseline system contained MFRs with n ID numbers uniformly distributed within the system; the sparse system contained MFRs with n ID numbers but additionally, a single MFR was assigned an ID number unique to the system; and the expanded condition, in which a new ID was uniformly added to the baseline system (n + 1 ID numbers). Compared with the baseline system, sparse rosettes decreased redundancy and increased the diversity of combinations, similar to the effect of adding an additional input (Fig. 5H). However, compared with the expanded system, the sparse input better preserved the redundancy of combinations that were present in the baseline system, suggesting that sparse fibers increase diversity with less detriment to redundancy compared with adding another input uniformly to the space (Fig. 5I; for details, see Materials and Methods).
Impact of MF filopodia on GrC combinatorial diversity
MF filopodia are long, thin, bouton-bearing processes that extend from MFRs (Fig. 6A–C). They have recently been shown to form synapses on GrCs (Gao et al., 2016), raising the question of their potential role in GrC combinatorial diversity. We reconstructed and analyzed pontine and nucleocortical MFRs from throughout the cerebellar cortex (Fig. 6B–D), quantifying the fraction of MFRs possessing filopodia (n = 1658 boutons), the number of boutons per filopodium (n = 84 boutons), and the distance between these boutons and the MFR (n = 84 boutons). Filopodial boutons were typically within 22 μm of the rosette, and there were between 1 and 4 filopodial boutons per rosette (Fig. 6D; median, 2). We found that nearly 32.2% of nucleocortical MFRs possessed filopodia, whereas pontine MFRs possessed filopodia at a lower rate, 11.3%, such that the likelihood of bearing filopodia for the entire population we observed was 16.3%.
We used these measurements in our GCL model, adding 1–5 synapses to GrCs located within 22 μm of a randomly selected 8%–20% of MFRs, simulating filopodia. We analyzed the effect of these filopodia-like synapses on GrC combinatorial diversity and redundancy. In the model, filopodia-like extensions enhanced the diversity of GrC combination (Fig. 6E), increasing the number of unique combinations of 4 MFR inputs beyond the number of GrCs present. This effect was a consequence of increasing the number of MFRs contacting many GrCs, which was previously limited to 4 (Fig. 6F). As the diversity of MFRs increased differences between systems with and without filopodia became more pronounced (Fig. 6F). MFR filopodia also enhanced redundancy of quartets in low-to-modest diversity systems, expanding the representation of individual inputs, particularly of rarer MFRs (Fig. 6G).
These modeling results indicate that filopodia mainly enhanced combinatorial diversity when MFR diversity was high (i.e., in instances when individual MFR identities are sparser). We tested whether sparseness of MFRs was related to the presence or absence of filopodia in our anatomical samples, measuring the nearest neighbors of filopodia-bearing and nonbearing MFRs. In keeping with predictions from the model, MFRs bearing filopodia were more sparsely spaced from like neighbors. Median nearest neighbors for MFRs that did not bear rosettes was 23.1 μm, whereas those bearing filopodia were 30 μm apart. Differences in the distributions were highly significant (Fig. 6E; K-S goodness-of-fit test, p = 1.5 × 10⁻²¹). Together, filopodia could serve an important role in the function of the GCL to enhance representation of sparse fibers, increasing combinatorial diversity and redundancy.
Discussion
Here we explored the effects of GCL morphological features on combination of afferents and diversification of GrCs. Our studies reveal a surprising theme of anatomical features favoring redundancy of afferent mixing rather than simply maximizing diversity. These findings raised the question of whether the spatial restrictions confer any advantage to information processing by the layer. We found that redundancy produced by spatially clustered afferents not surprisingly reduces dimensionality but enhances the capacity for temporal diversification of GrC activity. Empirical analysis of MFs validated features of the model and suggest potential evolutionary pressures structuring afferent mixing in the cerebellum.
Fundamental theoretical work on the GCL first proposed that GrCs combine afferents to support pattern separation and noise reduction by Purkinje neurons, under the guidance of climbing-fiber-mediated teaching signals (Marr, 1969; Albus, 1971). Considerable empirical support for this view exists, and similar circuits are seen in diverse brain areas and species, suggesting common computational principles (Caron et al., 2013; Kennedy et al., 2014). We investigated how seemingly nonrandom features (i.e., patchiness) of cerebellar anatomy impact GrC combinatorial diversity. Although it is perhaps obvious that every permutation of MFRs is not produced by the GCL, the specific limitations of this recoding scheme have, to our knowledge, not been described previously.
Dendrite length and afferent diversity influence combinatorial load
We found that the short dendrites strongly limit GrC access to the full diversity of inputs to a region. Regardless of the diversity of inputs, individual GrCs access <10 different inputs (Fig. 2). The consequences of this limitation are evident when comparing the number of different MFR combinations produced by GrCs to the total number of GrCs: the diversification is submaximal, and the number of unique combinations of 4 inputs remains below the number of GrCs in the population. This indicates that, as MFs diversify within a region of cortex, GrCs share similar inputs, producing redundancy and reducing the dimensionality of information representation in the layer (Fig. 3) (Litwin-Kumar et al., 2017).
Benefits conferred by anatomical organization
GrC redundancy is surprising given that the computational power of combinatorial diversity is degraded with correlated and overlapping inputs (Barak et al., 2013; Rigotti et al., 2013; Litwin-Kumar et al., 2017). We speculated that over-representation of particular combinations, produced both by GrC morphology (Fig. 2) and MFR clustering (Fig. 5), may facilitate temporal expansion of GrC coding, a property hypothesized to occur in the service of learned timing (Medina et al., 2000). If similar combinations of inputs carrying specific information engage many GrCs, then inhibitory feedback mechanisms could conceivably diversify the temporal representation more effectively than if that representation is overly sparse. We tested this assumption by developing a series of equations that weighted both diversification in identity and redundancy (Fig. 3), penalizing over-representation and under-representation of combinations. We found that the spatially organized model outperformed the random connectivity model when output featured both high dimensional recombination of inputs and temporal expandability (Fig. 3C).
These findings are interesting in light of recent studies showing denser engagement of GrCs than predicted by statistical models of the GCL (Marr, 1969). In both mice and fish, between 20% and 80% of monitored GrCs could be active within a short epoch, far >1% predicted (Giovannucci et al., 2017; Knogler et al., 2017; Wagner et al., 2017). Our data suggest that this difference need not preclude combinatorial diversity as a major feature of granule layer coding but predict that this redundant code is temporally diversified, although not yet visible with relatively slow Ca2+ indicators used in these studies.
Anatomical diversity of MF afferents
Although specific estimates of MF diversity are lacking, recent work using bulk viral label of diverse precerebellar structures indicate extensive intermixing of two sources and convergence on individual GrCs (Huang et al., 2013), consistent with inferences from individual MF ramification patterns. Brainbow-labeled MFs in the cerebellar flocculus indicate highly heterogeneous fibers in a small volume (Livet et al., 2007), whereas rosette spacing measured in individual fibers averaged 66 ± 55 μm (Sultan, 2001). Individual fiber data therefore suggest that an average of 8 MFR duplications occur within 100 μm3, with an ID density of ∼30, slightly higher than the location of peaks describing the marginal increase in GrC diversity produced by an addition MFR (between 10 and 20 IDs/247MFRs).
MF distributions from bulk-labeled nuclei show much denser innervation patterns (McCrea et al., 1977; Shinoda et al., 1992; Akintunde and Eisenman, 1994; Brodal and Bjaalie, 1997; Quy et al., 2011; Huang et al., 2013; Houck and Person, 2014, 2015). Although these clusters represent ramification of different neurons, physiological data suggest that there is likely some overlap in information encoded from individual precerebellar nuclei (Jörntell and Ekerot, 2006). We explored the effect of MFR clustering on combinatorial diversity and found that redundancy is enhanced more than diversity is reduced (Fig. 5). This trade-off suggests that MF afferents may have evolved densities that exploit both CE by the layer and redundancy of local representation.
The nucleocortical pathway has recently regained attention as an intriguing feedback pathway within the cerebellum (Tolbert et al., 1978; Houck and Person, 2014, 2015; Gao et al., 2016). This pathway produces a fairly well-circumscribed input to the cerebellar cortex, which include sparse rosettes (Fig. 5) (Houck and Person, 2015; Gao et al., 2016). We found that sparse fibers increase GrC diversity, but at the cost of redundancy. However, sparse rosettes preserved more redundancy than simply adding a new MFR uniformly to the system (Fig. 5). This effect suggests that sparse inputs are able to moderately diversify systems without disrupting redundancy.
Finally, we explored the contribution of MFR filopodia to combinatorial diversity. MFR filopodia have been noted for decades (Palay and Chan-Palay, 1974; Mason and Gregory, 1984; Kalinovsky et al., 2011) and are now appreciated to form synapses on both Golgi cells (Ruediger et al., 2011) and GrCs (Gao et al., 2016). In the model, we found that filopodia allow MFRs to support more CE without the spatial cost of producing a new rosette. In diverse MFR systems, where individual IDs are sparser, filopodia enhanced GrC combinatorial diversity, which was in keeping with the observation that sparser MFRs were more likely to bear filopodia. Conversely, filopodia enhanced redundancy, especially in triplet and doublet systems (Fig. 6G). Our reconstructions, moreover, highlight the morphological diversity of filopodia and suggest further experiments defining the relative synaptic strength of these inputs relative to MFRs. Although it is unlikely that all MFR filopodia contact GrCs, effects were graded proportional to the number of synapses added.
Physiology of MFs and influences on combinatorial representation
Physiological data on multimodal convergence are beginning to emerge, and the details of findings in these studies highlight potential nuances to the combinatorial hypothesis. Although GrCs in both mammals and fish integrate diverse information (Arenz et al., 2008; Sawtell, 2010; Ishikawa et al., 2015), the question whether a complete quartet of MFs is typically required for GrCs to reach threshold, or whether subsets of inputs are sufficient to drive GrC activity (Chadderton et al., 2004; Jorntell and Ekerot, 2006; Rancz et al., 2007; Ishikawa et al., 2015). Recent evidence of diversity of synaptic properties from different MF types could in part explain these diverse outcomes, with some afferents having powerful driver-like effects on GrCs whereas other afferents are weaker but facilitate with use (Chabrol et al., 2015). This physiological diversity suggests that the number of MFs required to drive a GrC might be regulated by the specific identities of the inputs that are active.
Additionally, MFRs show LTP with theta burst stimulation (D'Angelo et al., 1999; Hansel et al., 2001), raising the question of whether increasing synaptic strength allows subquartet MFR combinations to drive GrCs to threshold. We found that, with increasing MFR strength, GrCs with a fixed threshold can be driven with a greater diversity of combined inputs, allowing the GCL to represent information beyond the limit imposed on quartets by the GCL population. We showed that the spatial extent of GrCs that share 3 inputs is considerably larger than those that share 4 (Fig. 4); therefore, MF-LTP could contribute both to redundant representation of information and spatially broader representations.
Golgi cells and temporal expansion
With MFR patchiness, GrC morphology, MF physiology, and MFR filopodia all enhancing GrC redundancy, the Golgi cell network becomes a critical player in regulating the size of the coactive MFR combination transmitted to Purkinje neurons, via parallel fiber activation of Golgi cells. Tonic inhibition via Golgi cell inhibition dynamically sets the threshold for GrCs (Brickley et al., 1996; Duguid et al., 2012; Duguid et al., 2015), and phasic inhibition produces surround inhibition and temporal sharpening (Kanichay and Silver, 2008; D'Angelo et al., 2013; Nieus et al., 2014). Because even at relatively high MFR diversity, neighboring GrCs are likely to share a subset of inputs (Fig. 4), Golgi cell inhibition is in a position to dynamically regulate the number of shared inputs driving GrCs (D'Angelo, 2008; Solinas et al., 2010).
In conclusion, this study explored how a variety of features of granule layer organization contribute to recombining MF inputs. GCL morphology limits mixing locally, but patchy ramification patterns contribute to redundant representation, which may be important for temporal diversification or sufficient representation for motor learning. Along with our findings that diversity reaches a saturation point due to anatomical constraints, our study suggests that this failure to reach maximal diversity in GCL afferents is not inherently detrimental. Finally, specializations, such as sparse inputs and filopodial extensions, can mitigate limitations on combinatorial diversity created by anatomical restrictions. Future studies examining the complete connectome of patches of granule layer will indicate where within the space of maximal diversity versus redundancy the cerebellar system produces, and will further illuminate the computational strategies of the cerebellum.
Footnotes
This work was supported by National Institutes of Health Grant R01 NS084996-01, the Klingenstein Foundation, and the McKnight Foundation to A.L.P. Light microscopic experiments were performed in the University of Colorado Anschutz Medical Campus Advance Light Microscopy Core supported in part by Rocky Mountain Neurological Disorders Core Grant P30NS048154 and National Institutes of Health CTSI Grant UL1 RR025780. We thank Dr. Brenda Houck for performing the tracer injections and histological preparation of mouse tissue for use in our modeling and analyses; and Drs. Joel Zylberberg and Gidon Felsen for providing helpful feedback on earlier drafts of the manuscript.
The authors declare no competing financial interests.
References
- Akintunde A, Eisenman LM (1994) External cuneocerebellar projection and Purkinje cell zebrin II bands: a direct comparison of parasagittal banding in the mouse cerebellum. J Chem Neuroanat 7:75–86. 10.1016/0891-0618(94)90009-4 [DOI] [PubMed] [Google Scholar]
- Albus JS. (1971) A theory of cerebellar function. Math Biosci 10:25–61. 10.1016/0025-5564(71)90051-4 [DOI] [Google Scholar]
- Arenz A, Silver RA, Schaefer AT, Margrie TW (2008) The contribution of single synapses to sensory representation in vivo. Science 321:977–980. 10.1126/science.1158391 [DOI] [PMC free article] [PubMed] [Google Scholar]
- Barak O, Rigotti M, Fusi S (2013) The sparseness of mixed selectivity neurons controls the generalization-discrimination trade-off. J Neurosci 33:3844–3856. 10.1523/JNEUROSCI.2753-12.2013 [DOI] [PMC free article] [PubMed] [Google Scholar]
- Billings G, Piasini E, Lőrincz A, Nusser Z, Silver RA (2014) Network structure within the cerebellar input layer enables lossless sparse encoding. Neuron 84:960–974. 10.1016/j.neuron.2014.07.020 [DOI] [PMC free article] [PubMed] [Google Scholar]
- Blomfield S, Marr D (1970) How the cerebellum may be used. Nature 227:1224–1228. 10.1038/2271224a0 [DOI] [PubMed] [Google Scholar]
- Brickley SG, Cull-Candy SG, Farrant M (1996) Development of a tonic form of synaptic inhibition in rat cerebellar granule cells resulting from persistent activation of GABAA receptors. J Physiol 497:753–759. 10.1113/jphysiol.1996.sp021806 [DOI] [PMC free article] [PubMed] [Google Scholar]
- Brodal P, Bjaalie JG (1997) Salient anatomic features of the cortico-ponto-cerebellar pathway. Prog Brain Res 114:227–249. 10.1016/S0079-6123(08)63367-1 [DOI] [PubMed] [Google Scholar]
- Caron SJ, Ruta V, Abbott LF, Axel R (2013) Random convergence of olfactory inputs in the Drosophila mushroom body. Nature 497:113–117. 10.1038/nature12063 [DOI] [PMC free article] [PubMed] [Google Scholar]
- Cayco-Gajic NA, Clopath C, Silver RA (2017) Sparse synaptic connectivity is required for decorrelation and pattern separation in feedforward networks. Nat Commun 8:1116. 10.1101/108431 [DOI] [PMC free article] [PubMed] [Google Scholar]
- Chabrol FP, Arenz A, Wiechert MT, Margrie TW, DiGregorio DA (2015) Synaptic diversity enables temporal coding of coincident multisensory inputs in single neurons. Nat Neurosci 18:718–727. 10.1038/nn.3974 [DOI] [PMC free article] [PubMed] [Google Scholar]
- Chadderton P, Margrie TW, Häusser M (2004) Integration of quanta in cerebellar granule cells during sensory processing. Nature 428:856–860. 10.1038/nature02442 [DOI] [PubMed] [Google Scholar]
- D'Angelo E. (2008) The critical role of Golgi cells in regulating spatio-temporal integration and plasticity at the cerebellum input stage. Front Neurosci 2:35–46. 10.3389/neuro.01.008.2008 [DOI] [PMC free article] [PubMed] [Google Scholar]
- D'Angelo E. (2017) Challenging Marr's theory of the cerebellum. In: Computational theories and their implementation in the brain. The legacy of David Marr (Vaina LM, Passingham RE, eds), pp 62–78. Oxford: Oxford UP. [Google Scholar]
- D'Angelo E, Rossi P, Armano S, Taglietti V (1999) Evidence for NMDA and mGlu receptor-dependent long-term potentiation of mossy fiber-granule cell transmission in rat cerebellum. J Neurophysiol 81:277–287. [DOI] [PubMed] [Google Scholar]
- D'Angelo E, Solinas S, Mapelli J, Gandolfi D, Mapelli L, Prestori F (2013) The cerebellar Golgi cell and spatiotemporal organization of granular layer activity. Front Neural Circuits 7:93. 10.3389/fncir.2013.00093 [DOI] [PMC free article] [PubMed] [Google Scholar]
- Diwakar S, Lombardo P, Solinas S, Naldi G, D'Angelo E (2011) Local field potential modeling predicts dense activation in cerebellar granule cells clusters under LTP and LTD control. PLoS One 6:e21928. 10.1371/journal.pone.0021928 [DOI] [PMC free article] [PubMed] [Google Scholar]
- Duguid I, Branco T, London M, Chadderton P, Häusser M (2012) Tonic inhibition enhances fidelity of sensory information transmission in the cerebellar cortex. J Neurosci 32:11132–11143. 10.1523/JNEUROSCI.0460-12.2012 [DOI] [PMC free article] [PubMed] [Google Scholar]
- Duguid I, Branco T, Chadderton P, Arlt C, Powell K, Häusser M (2015) Control of cerebellar granule cell output by sensory-evoked Golgi cell inhibition. Proc Natl Acad Sci U S A 112:13099–13104. 10.1073/pnas.1510249112 [DOI] [PMC free article] [PubMed] [Google Scholar]
- Eccles JC, Ito M, Szentagothai J (1967) The cerebellum as a neuronal machine. New York: Springer. [Google Scholar]
- Freeman JH Jr, Rabinak CA (2004) Eyeblink conditioning in rats using pontine stimulation as a conditioned stimulus. Integr Physiol Behav Sci 39:180–191. 10.1007/BF02734438 [DOI] [PMC free article] [PubMed] [Google Scholar]
- Gao Z, Proietti-Onori M, Lin Z, Ten Brinke MM, Boele HJ, Potters JW, Ruigrok TJ, Hoebeek FE, De Zeeuw CI (2016) Excitatory cerebellar nucleocortical circuit provides internal amplification during associative conditioning. Neuron 89:645–657. 10.1016/j.neuron.2016.01.008 [DOI] [PMC free article] [PubMed] [Google Scholar]
- Garwicz M, Jorntell H, Ekerot CF (1998) Cutaneous receptive fields and topography of mossy fibres and climbing fibres projecting to cat cerebellar C3 zone. J Physiol 512:277–293. 10.1111/j.1469-7793.1998.277bf.x [DOI] [PMC free article] [PubMed] [Google Scholar]
- Gebre SA, Reeber SL, Sillitoe RV (2012) Parasagittal compartmentation of cerebellar mossy fibers as revealed by the patterned expression of vesicular glutamate transporters VGLUT1 and VGLUT2. Brain Struct Funct 217:165–180. 10.1007/s00429-011-0339-4 [DOI] [PubMed] [Google Scholar]
- Giovannucci A, Badura A, Deverett B, Najafi F, Pereira TD, Gao Z, Ozden I, Kloth AD, Pnevmatikakis E, Paninski L, De Zeeuw CI, Medina JF, Wang SS (2017) Cerebellar granule cells acquire a widespread predictive feedback signal during motor learning. Nat Neurosci 20:727–734. 10.1038/nn.4531 [DOI] [PMC free article] [PubMed] [Google Scholar]
- Halverson HE, Hubbard EM, Freeman JH (2009) Stimulation of the lateral geniculate, superior colliculus, or visual cortex is sufficient for eyeblink conditioning in rats. Learn Mem 16:300–307. 10.1101/lm.1340909 [DOI] [PMC free article] [PubMed] [Google Scholar]
- Hansel C, Linden DJ, D'Angelo E (2001) Beyond parallel fiber LTD: the diversity of synaptic and non-synaptic plasticity in the cerebellum. Nat Neurosci 4:467–475. 10.1038/87419 [DOI] [PubMed] [Google Scholar]
- Herculano-Houzel S. (2010) Coordinated scaling of cortical and cerebellar numbers of neurons. Front Neuroanat 4:12. 10.3389/fnana.2010.00012 [DOI] [PMC free article] [PubMed] [Google Scholar]
- Houck BD, Person AL (2014) Cerebellar loops: a review of the nucleocortical pathway. Cerebellum 13:378–385. 10.1007/s12311-013-0543-2 [DOI] [PMC free article] [PubMed] [Google Scholar]
- Houck BD, Person AL (2015) Cerebellar premotor output neurons collateralize to innervate the cerebellar cortex. J Comp Neurol 523:2254–2271. 10.1002/cne.23787 [DOI] [PMC free article] [PubMed] [Google Scholar]
- Huang CC, Sugino K, Shima Y, Guo C, Bai S, Mensh BD, Nelson SB, Hantman AW (2013) Convergence of pontine and proprioceptive streams onto multimodal cerebellar granule cells. Elife; 2:e00400. 10.7554/eLife.00400 [DOI] [PMC free article] [PubMed] [Google Scholar]
- Ishikawa T, Shimuta M, Häusser M (2015) Multimodal sensory integration in single cerebellar granule cells in vivo. Elife 4:e12916. 10.7554/eLife.12916 [DOI] [PMC free article] [PubMed] [Google Scholar]
- Jakab RL, Hámori J (1988) Quantitative morphology and synaptology of cerebellar glomeruli in the rat. Anat Embryol (Berl) 179:81–88. 10.1007/bf00305102 [DOI] [PubMed] [Google Scholar]
- Jörntell H, Ekerot CF (2006) Properties of somatosensory synaptic integration in cerebellar granule cells in vivo. J Neurosci 26:11786–11797. 10.1523/JNEUROSCI.2939-06.2006 [DOI] [PMC free article] [PubMed] [Google Scholar]
- Kalinovsky A, Boukhtouche F, Blazeski R, Bornmann C, Suzuki N, Mason CA, Scheiffele P (2011) Development of axon-target specificity of ponto-cerebellar afferents. PLoS Biol 9: e1001013. 10.1371/journal.pbio.1001013 [DOI] [PMC free article] [PubMed] [Google Scholar]
- Kanichay RT, Silver RA (2008) Synaptic and cellular properties of the feedforward inhibitory circuit within the input layer of the cerebellar cortex. J Neurosci 28:8955–8967. 10.1523/JNEUROSCI.5469-07.2008 [DOI] [PMC free article] [PubMed] [Google Scholar]
- Kennedy A, Wayne G, Kaifosh P, Alviña K, Abbott LF, Sawtell NB (2014) A temporal basis for predicting the sensory consequences of motor commands in an electric fish. Nat Neurosci 17:416–422. 10.1038/nn.3650 [DOI] [PMC free article] [PubMed] [Google Scholar]
- Knogler LD, Markov DA, Dragomir EI, Šith V, Portugues R (2017) Sensorimotor representations in cerebellar granule cells in larval zebrafish are dense, spatially organized, and non-temporally patterned. Curr Biol 27:1288–1302. 10.1016/j.cub.2017.03.029 [DOI] [PubMed] [Google Scholar]
- Litwin-Kumar A, Harris KD, Axel R, Sompolinsky H, Abbott LF (2017) Optimal degrees of synaptic connectivity. Neuron 93:1–12. 10.1016/j.neuron.2017.01.030 [DOI] [PMC free article] [PubMed] [Google Scholar]
- Livet J, Weissman TA, Kang H, Draft RW, Lu J, Bennis RA, Sanes JR, Lichtman JW (2007) Transgenic strategies for combinatorial expression of fluorescent proteins in the nervous system. Nature 450:56–62. 10.1038/nature06293 [DOI] [PubMed] [Google Scholar]
- Mapelli J, D'Angelo E (2007) The spatial organization of long-term synaptic plasticity at the input stage of cerebellum. J Neurosci 27:1285–1296. 10.1523/JNEUROSCI.4873-06.2007 [DOI] [PMC free article] [PubMed] [Google Scholar]
- Marr D. (1969) A theory of cerebellar cortex. J Physiol 202:437–470. 10.1113/jphysiol.1969.sp008820 [DOI] [PMC free article] [PubMed] [Google Scholar]
- Mason CA, Gregory E (1984) Postnatal maturation of cerebellar mossy and climbing fibers: transient expression of dual features on single axons. J Neurosci 4:1715–1735. [DOI] [PMC free article] [PubMed] [Google Scholar]
- Mauk MD, Donegan NH (1997) A model of Pavlovian eyelid conditioning based on the synaptic organization of the cerebellum. Learn Mem 4:130–158. 10.1101/lm.4.1.130 [DOI] [PubMed] [Google Scholar]
- McCrea RA, Bishop GA, Kitai ST (1977) Electrophysiological and horseradish peroxidase studies of precerebellar afferents to the nucleus interpositus anterior: II. Mossy fiber system. Brain Res 122:215–228. 10.1016/0006-8993(77)90290-6 [DOI] [PubMed] [Google Scholar]
- Medina JF, Garcia KS, Nores WL, Taylor NM, Mauk MD (2000) Timing mechanisms in the cerebellum: testing predictions of a large-scale computer simulation. J Neurosci 20:5516–5525. [DOI] [PMC free article] [PubMed] [Google Scholar]
- Nieus TR, Mapelli L, D'Angelo E (2014) Regulation of output spike patterns by phasic inhibition in cerebellar granule cells. Front Cell Neurosci 8:246. 10.3389/fncel.2014.00246 [DOI] [PMC free article] [PubMed] [Google Scholar]
- Palay S, Chan-Palay V (1974) Cerebellar cortex cytology and organization. New York: Springer. [Google Scholar]
- Palkovits M, Magyar P, Szentágothai J (1971) Quantitative histological analysis of the cerebellar cortex in the cat. II. Cell numbers and densities in the granular layer. Brain Res 32:15–30. 10.1016/0006-8993(71)90152-1 [DOI] [PubMed] [Google Scholar]
- Quy PN, Fujita H, Sakamoto Y, Na J, Sugihara I (2011) Projection patterns of single mossy fiber axons originating from the dorsal column nuclei mapped on the aldolase C compartments in the rat cerebellar cortex. J Comp Neurol 519:874–899. 10.1002/cne.22555 [DOI] [PubMed] [Google Scholar]
- Rancz EA, Ishikawa T, Duguid I, Chadderton P, Mahon S, Häusser M (2007) High-fidelity transmission of sensory information by single cerebellar mossy fibre boutons. Nature 450:1245–1248. 10.1038/nature05995 [DOI] [PMC free article] [PubMed] [Google Scholar]
- Rigotti M, Barak O, Warden MR, Wang XJ, Daw ND, Miller EK, Fusi S (2013) The importance of mixed selectivity in complex cognitive tasks. Nature 497:585–590. 10.1038/nature12160 [DOI] [PMC free article] [PubMed] [Google Scholar]
- Ruediger S, Vittori C, Bednarek E, Genoud C, Strata P, Sacchetti B, Caroni P (2011) Learning-related feedforward inhibitory connectivity growth required for memory precision. Nature 473:514–518. 10.1038/nature09946 [DOI] [PubMed] [Google Scholar]
- Sawtell NB. (2010) Multimodal integration in granule cells as a basis for associative plasticity and sensory prediction in a cerebellum-like circuit. Neuron 66:573–584. 10.1016/j.neuron.2010.04.018 [DOI] [PubMed] [Google Scholar]
- Schneiderman N, Gormezano I (1964) Conditioning of the nictitating membrane of the rabbit as a function of CS-US interval. J Comp Physiol Psychol 57:188–195. 10.1037/h0043419 [DOI] [PubMed] [Google Scholar]
- Shinoda Y, Sugiuchi Y, Futami T, Izawa R (1992) Axon collaterals of mossy fibers from the pontine nucleus in the cerebellar dentate nucleus. J Neurophysiol 67:547–560. [DOI] [PubMed] [Google Scholar]
- Sillitoe RV, Vogel MW, Joyner AL (2010) Engrailed homeobox genes regulate establishment of the cerebellar afferent circuit map. J Neurosci 30:10015–10024. 10.1523/JNEUROSCI.0653-10.2010 [DOI] [PMC free article] [PubMed] [Google Scholar]
- Smith MC, Coleman SR, Gormezano I (1969) Classical conditioning of the rabbit's nictitating membrane response at backward, simultaneous, and forward CS-US intervals. J Comp Physiol Psychol 69:226–231. 10.1037/h0028212 [DOI] [PubMed] [Google Scholar]
- Solinas S, Nieus T, D'Angelo E (2010) A realistic large-scale model of the cerebellum granular layer predicts circuit spatio-temporal filtering properties. Front Cell Neurosci 4:12. 10.3389/fncel.2010.00012 [DOI] [PMC free article] [PubMed] [Google Scholar]
- Spanne A, Jörntell H (2013) Processing of multi-dimensional sensorimotor information in the spinal and cerebellar neuronal circuitry: a new hypothesis. PLoS Comput Biol 9:e1002979. 10.1371/journal.pcbi.1002979 [DOI] [PMC free article] [PubMed] [Google Scholar]
- Spanne A, Jörntell H (2015) Questioning the role of sparse coding in the brain. Trends Neurosci 2015 38:417–427. 10.1016/j.tins.2015.05.005 [DOI] [PubMed] [Google Scholar]
- Steinmetz JE, Rosen DJ, Chapman PF, Lavond DG, Thompson RF (1986) Classical conditioning of the rabbit eyelid response with a mossy-fiber stimulation CS: I. Pontine nuclei and middle cerebellar peduncle stimulation. Behav Neurosci 100:878–887. 10.1037/0735-7044.100.6.878 [DOI] [PubMed] [Google Scholar]
- Sultan F. (2001) Distribution of mossy fibre rosettes in the cerebellum of cat and mice: evidence for a parasagittal organization at the single fibre level. Eur J Neurosci 13:2123–2130. 10.1046/j.0953-816x.2001.01593.x [DOI] [PubMed] [Google Scholar]
- Tolbert DL, Bantli H, Bloedel JR (1978) Organizational features of the cat and monkey cerebellar nucleocortical projection. J Comp Neurol 182:39–56. 10.1002/cne.901820104 [DOI] [PubMed] [Google Scholar]
- Valera AM, Binda F, Pawlowski SA, DuPont JL, Casella JF, Rothstein JD, Poulain B, Isope P (2016) Stereotyped spatial patterns of functional synaptic connectivity in the cerebellar cortex. Elife 16:5. 10.7554/eLife.09862 [DOI] [PMC free article] [PubMed] [Google Scholar]
- Voogd J, Glickstein M (1998) The anatomy of the cerebellum. Trends Neurosci 21:370–375. 10.1016/S0166-2236(98)01318-6 [DOI] [PubMed] [Google Scholar]
- Wagner MJ, Kim TH, Savall J, Schnitzer MJ, Luo L (2017) Cerebellar granule cells encode the expectation of reward. Nature 544:96–100. 10.1038/nature21726 [DOI] [PMC free article] [PubMed] [Google Scholar]
- Welker W, Sanderson KJ, Shambes GM (1984) Patterns of afferent projections to transitional zones in the somatic sensorimotor cerebral cortex of albino rats. Brain Res 292:261–267. 10.1016/0006-8993(84)90762-5 [DOI] [PubMed] [Google Scholar]
- Wu HS, Sugihara I, Shinoda Y (1999) Projection patterns of single mossy fibers originating from the lateral reticular nucleus in the rat cerebellar cortex and nuclei. J Comp Neurol 411:97–118. 10.1002/(SICI)1096-9861(19990816)411:1%3C97::AID-CNE8%3E3.0.CO;2-O [DOI] [PubMed] [Google Scholar]