

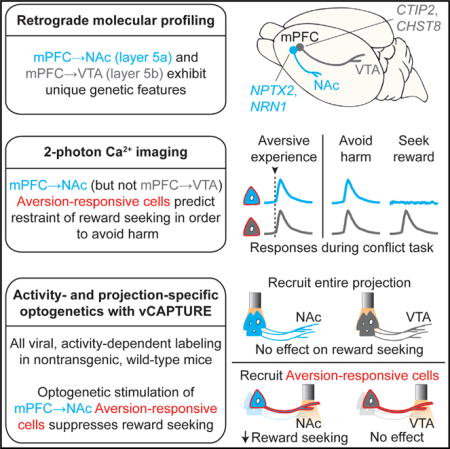
SUMMARY
Reward-seeking behavior is fundamental to survival, but suppression of this behavior can be essential as well, even for rewards of high value. In humans and rodents, the medial prefrontal cortex (mPFC) has been implicated in suppressing reward seeking; however, despite vital significance in health and disease, the neural circuitry through which mPFC regulates reward seeking remains incompletely understood. Here, we show that a specific subset of superficial mPFC projections to a subfield of nucleus accumbens (NAc) neurons naturally encodes the decision to initiate or suppress reward seeking when faced with risk of punishment. A highly resolved subpopulation of these top-down projecting neurons, identified by 2-photon Ca2+ imaging and activity-dependent labeling to recruit the relevant neurons, was found capable of suppressing reward seeking. This natural activity-resolved mPFC-to-NAc projection displayed unique molecular-genetic and microcircuit-level features concordant with a conserved role in the regulation of reward-seeking behavior, providing cellular and anatomical identifiers of behavioral and possible therapeutic significance.
Graphical abstract
INTRODUCTION
The complexity of the environment of animals may be contrasted with the unitary nature of action. Many choices involving outcome components of known conflicting-valence (e.g., both reward and punishment) must still be implemented by a single coherent action. To achieve such adaptively important outcomes in the brain, neural circuitry is required to efficiently resolve inconsistencies, select single actions, and transmit the result of this adjudication to motor-output circuitry. Neuroeconomic gain/loss considerations may be of insufficient complexity for the large majority of naturalistic situations, wherein reward and harm are categorically different.
Maladaptive evaluation/selection of such choices is also important in clinical settings (Everitt and Robbins, 2005). For example, physically destructive consequences of substance use (normally aversive and thus effective in deterring behavior) often fail to deter drug-use action plans. Clinically relevant suppression of behavioral responses to aversive stimuli is not limited to substance use; self-injurious behaviors can become of neutral or even positive motivational valence in OCD, borderline personality disorder, and other neuropsychiatric diseases.
Thus requiring neither drug nor dependence, selecting actions with known harmful outcomes arises in diverse adaptive and maladaptive contexts and thus may involve conserved circuitry and neurophysiology with substantial developmental and evolutionary significance. The relevant neural circuitry is incompletely understood from the brainwide to cellular level, but studies of reward and aversion circuitry have identified separate and overlapping networks (Haber and Knutson, 2010). Reward circuitry is heavily dependent upon ventral tegmental area (VTA) dopamine neurons and their targets, which include cortex and nucleus accumbens (NAc) as well as additional corticostriatal circuitry involving the ventral pallidum, anterior cingulate cortex and medial prefrontal cortex (mPFC), and diverse other structures spanning amygdala, hippocampus, thalamus, and habenular and brainstem nuclei (Robbins and Everitt, 1996; Saunders et al., 2015). Processing of aversion (Hayes and Northoff, 2011) can involve many of these same structures as well (Lammel et al., 2011; Lammel et al., 2012; Tan et al., 2012), but with a distinct involvement of lateral habenula, bed nucleus of the stria terminalis, hypothalamus, and periaqueductal gray matter.
Notably, regions shared across reward- and aversion-processing, such as prefrontal cortices and the nucleus accumbens, have been implicated in mediating behavior in approach/avoidance conflict with punishment (reviewed in Orsini et al., 2015a)—a behavior in which the conflicting desires to seek reward and avoid aversion are evaluated to result in a single behavioral choice. Previous studies have highlighted a role of mPFC in suppression of natural and drug-related reward seeking (Bossert et al., 2012; Ferenczi et al., 2016; Pfarr et al., 2015) and during conflicted reward-seeking tasks (Amemori and Graybiel, 2012; Friedman et al., 2015; St Onge et al., 2012; Peters and Büchel, 2009; St Onge and Floresco, 2010); however, opposing results obscure which specific region or projection of mPFC neurons may mediate these aversion-related behaviors. For example, some studies have found that the prelimbic (PL) subregion of mPFC promotes reward seeking (McFarland et al., 2004; McLaughlin and See, 2003; Otis et al., 2017), while others found inhibition of responding for reward (Chen et al., 2013a; Jonkman et al., 2009). Cellular-level and brainwide investigation of how circuits carry out this transformation of a complex choice into unitary action may thus require advances in the ability to manipulate and measure brain-spanning circuit activity patterns during behavior.
Here, we seek underlying principles by developing and applying methods to control, observe, and structurally resolve naturally occurring and causally relevant circuit activity patterns in awake mice during behaviors wherein unitary action is both challenging and required. We detect the circuit elements that are specifically recruited and strongly active during selection of a learned rewarding action in the setting of known punishment, quantify naturally occurring real-time signals in neocortex-arising deep-brain projections, and employ all-optical imaging and control methods to test causal significance of the identified populations, pathways, and dynamics.
RESULTS
mPFC Projections to NAc and VTA Exhibit Distinct Molecular and Anatomic Phenotypes
Prelimbic mPFC is known to project throughout the subregions of NAc; here, we focused on projections to the NAc lateral shell. To perform unbiased molecular profiling of mPFC neurons projecting to NAc (mPFC → NAc) or to VTA (mPFC → VTA), we injected the retrograde canine adenovirus CAV2 encoding Cre recombinase (CAV2-Cre; Hnasko et al., 2006; Soudais et al., 2004) into either NAc or VTA of Cre-dependent ribosome-GFP-tagged transgenic mice (Long et al., 2014; Ye et al., 2016) and analyzed the mRNA bound to ribosomes using microarrays (Figure 1A). We found genes preferentially enriched (>1.5-fold) in either mPFC→NAc or mPFC→VTA projecting neurons (Figure 1B), 35 in mPFC→NAc and 16 in mPFC→VTA neurons (Tables 1 and S1). We first examined available in situ hybridization data (Lein et al., 2007) and observed that genes enriched in mPFC→NAc neurons are expressed more abundantly in superficial layer 5a cortical neurons (e.g., SCCPDH, NRN1), whereas genes enriched in mPFC→VTA neurons (e.g., TCERG1L, CHST8) predominate in deeper layer 5b neurons (Figure S1). Together, these data suggested that mPFC→NAc and mPFC→VTA cells could reside in distinct cortical laminae.
Figure 1. Molecular and Anatomical Characterization of mPFC Projections to NAc and VTA.

(A) Schematic for molecular profiling experiment.
(B) Volcano plot illustrating genes enriched in mPFC→NAc cells (shown as positive fold enrichment, green dots) or enriched in mPFC→VTA cells (shown as negative fold enrichment, magenta dots), respectively. Fold enrichment is plotted in linear space to describe how much the expression differs from one group to the other group. Gray dots denote genes with p ≥ 0.05 or fold enrichment ≤ 1.5. One-way between-subjects ANOVA analysis.
(C) Schematic of viral strategy for dual-projection labeling of mPFC→NAc and mPFC→VTA neurons in the same animal.
(D) Coronal section showing mPFC→NAc (green) and mPFC→VTA (magenta) cell bodies. Scale bar: 600 μm.
(E) Probability distribution function of lateral distances of cell bodies from midline. mPFC→NAc cells are more superficial than mPFC→VTA cells (n = 237 mPFC→NAc and 500 mPFC→VTA cells from 5 mice; Kruskal-wallis test, H1 = 319.46, *p < 1e–10).
(F) Single-projection labeling of mPFC→NAc or mPFC→VTA in separate mice.
(G and H) Example mPFC→NAc (G) or mPFC→VTA(H) cells labeled with eYFP. CTIP2 stain overlapped with mPFC→VTA but not mPFC→NAc cells (n = 3 mice per projection). White dashed line, superficial boundary of CTIP2 stain. Scale bar: 100 μm.
See also Figure S2.
Table 1.
Genes Enriched in mPFC→NAc and mPFC→VTA Neurons
| Genes enriched in mPFC→NAc | Genes enriched in mPFC→VTA | ||
|---|---|---|---|
| Gene | Gene product | Gene | Gene product |
| NPTX2 | Neuronal pentraxin 2 | TCERG1L | Transcription elongation regulator 1-like |
| F2RL2 | Coagulation factor II (thrombin) receptor-like 2 | POU3F1 | POU domain, class 3, transcription factor 1 |
| FOS | FBJ osteosarcoma oncogene | PTCD3 | Pentatricopeptide repeat domain 3 |
| LCN2 | Lipocalin 2 | CHST8 | Carbohydrate (N-acetylgalactosamine 4-0) sulfotransferase 8 |
| PTGFRN | Prostaglandin F2 receptor negative regulator | IGFBP4 | Insulin-like growth factor binding protein 4 |
| SCCPDH | Saccharopine dehydrogenase | BCL11B (CTIP2) | B cell leukemia/lymphoma 11B |
| TMEM254B | Transmembrane protein 254b | PARM1 | Prostate androgen-regulated mucin-like protein 1 |
| BIN2 | Bridging integrator 2 | NRIP3 | Nuclear receptor interacting protein 3 |
| NRN1 | Neuritin 1 | BCL6 | B cell leukemia/lymphoma 6 |
| LY6A | Lymphocyte antigen 6 complex, locus A | DSCAML1 | Down syndrome cell adhesion molecule like 1 |
| CD7 | CD7 antigen | RHBDL3 | Rhomboid, veinlet-like 3 (Drosophila) |
| LY96 | Lymphocyte antigen 96 | GLRA3 | Glycine receptor, alpha 3 subunit |
| IGLC3 | Immunoglobulin lambda constant 3 | NDUFA4L2 | NADH dehydrogenase (ubiquinone) 1 alpha subcomplex, 4-like 2 |
| TOMM5 | Translocase of outer mitochondrial membrane 5 homolog (yeast) | LOR | Loricrin |
| LRRC3B | Leucine rich repeat containing 3B | VMN1R127 | Vomeronasal 1 receptor 127 |
| KRTAP5-1 | Keratin associated protein 5-1 | SYCP3 | Synaptonemal complex protein 3 |
| ZNRD1 | Zinc ribbon domain containing, 1 | ||
| KLF10 | Kruppel-like factor 10 | ||
| MAP3K8 | Mitogen-activated protein kinase kinase kinase 8 | ||
| CYP11A1 | Cytochrome P450, family 11, subfamily a, polypeptide 1 | ||
| TMEM126A | Transmembrane protein 126A | ||
| CTSH | Cathepsin H | ||
| CNIH3 | Cornichon homolog 3 (Drosophila) | ||
| ANKRD33B | Ankyrin repeat domain 33B | ||
| MPV17 | MpV17 mitochondrial inner membrane protein | ||
| KRT12 | Keratin 12 | ||
| RIMS3 | Regulating synaptic membrane exocytosis 3 | ||
| COX20 | COX20 Cox2 chaperone | ||
| LBP | Lipopolysaccharide binding protein | ||
| HMGN2 | High mobility group nucleosomal binding domain 2 | ||
| SRGN | Serglycin | ||
| FAP | Fibroblast activation protein | ||
| CD33 | CD33 antigen | ||
| SPG21 | Spastic paraplegia 21 homolog (human) | ||
| LOC102641848 | 60S ribosomal protein L15-like | ||
List of candidate genes enriched in mPFC→NAc neurons or enriched in mPFC→VTA neurons. See also Method Details: Molecular profiling experiment, Table S1, and Figure S1.
To definitively examine anatomical organization of these different subpopulations, we used different retrograde viruses to label mPFC→NAc or mPFC→VTA neurons within individual mice (Figure 1C). We injected a herpes simplex virus encoding flp recombinase (HSV-flp; Fenno et al., 2014) in NAc, CAV2-Cre in VTA, and a mixture of adeno-associated viruses (AAVs) encoding Cre-dependent mCherry and flp-dependent eYFP in mPFC (Table S2). This strategy resulted in robust and specific labeling of mPFC→NAc or mPFC→VTA neurons (Figures 1D and S2A–S2C). Confirming our molecular profiling, these two populations were distributed in different laminae in mPFC, with NAc-projecting neurons medially in more superficial layer 5a and VTA-projecting neurons laterally in deeper layer 5b (Figure 1E). To exclude viral competition for cell-surface receptors, we repeated these experiments using CAV2-Cre and a Cre-dependent eYFP in separate mice to label each projection and found the same laminar separation among projection neurons (Figures 1F–1H, S2D, and S2E). We next linked these anatomical findings to molecular profiling. Immunohistochemical staining for CTIP2—a marker for cortical layer 5b neurons (DeNardo et al., 2015)—colocalized with mPFC→VTA neurons, while mPFC→NAc neurons were distinct and superficial to the CTIP2 label (Figures 1G, 1H, S2F, and S2G). Thus, mPFC→NAc and mPFC→VTA neurons represent distinct populations, raising the possibility of distinct roles in reward-related behavior.
mPFC→NAc Activity Is Suppressed prior to Seeking Reward in Setting of Punishment
To explore whether mPFC→NAc and mPFC→VTA neurons naturally serve distinct roles in regulation of reward seeking, we recorded activity from these populations during behavior using frame-projected independent-fiber photometry (FIP; Kim et al., 2016; Figures 2A, S3A, and S3B). We trained mice on a self-paced, freely moving lever-press task designed to suppress reward seeking (risk of foot-shock on 30% of lever presses; Figure 2B). Validating the task, we demonstrated that mice receiving pseudorandomly delivered foot-shocks instead of lever-contingent foot-shocks did not exhibit lever-pressing suppression, whereas lever-contingent shock delivery resulted in immediate partial suppression of lever-pressing (Figures 2C, 2D, and S3C–S3F). Exhibiting similar Ca2+ signals, both mPFC→NAc and mPFC→VTA neurons showed reduced activity upon leverpressing with reward-receipt during baseline sessions and increased activity following lever-pressing with shock-receipt (Figures 2E–2H). Lever re-positioning relative to reward port had no effect on mPFC→NAc activity (Figures S3G and S3H), excluding a contribution from ipsilateral movement as in striatal neurons (Cui et al., 2013).
Figure 2. mPFC→NAc but Not mPFC→VTA Cells Are Suppressed prior to Reward Seeking with Punishment.
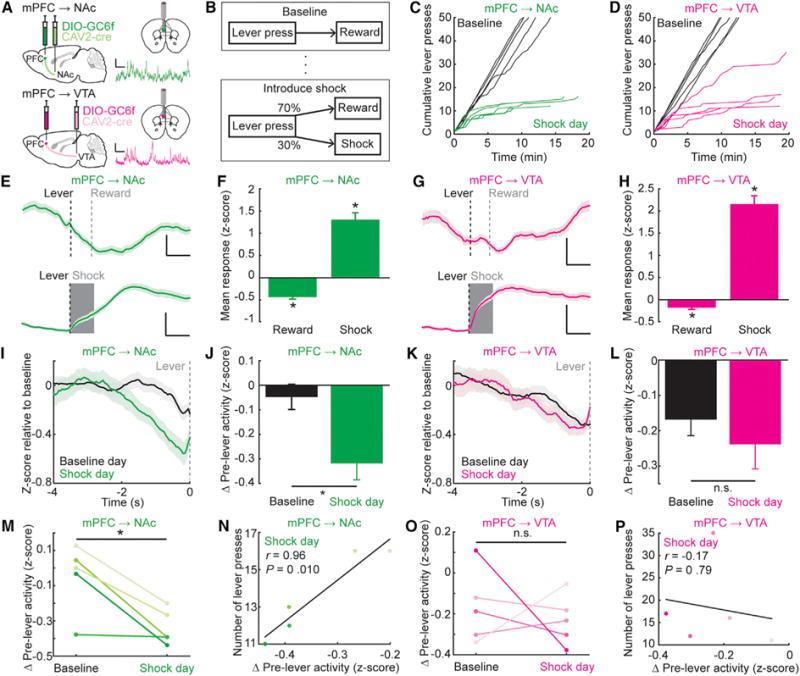
(A) Schematic and example FIP Ca2+ trace for mPFC→NAc (top) or mPFC→VTA populations (bottom). Vertical scale bar: 2 z-scores; horizontal scale bar: 25 s.
(B) Behavioral protocol. Upon stable lever pressing for liquid reward (max 50 rewards/day), a protocol was instituted wherein 30% of lever presses instead resulted in 1 s foot-shock.
(C and D) Cumulative lever presses across all mPFC→NAc (C) and mPFC→VTA (D) mice in baseline and shock days. Each line, individual mouse.
(E) mPFC→NAc FIP activity aligned to lever presses followed by reward (top) or shock (bottom). Black dashed line, lever press time; gray vertical line, average reward-retrieval time (0.87 ± 0.04 s); gray shaded rectangle, shock duration. Mean ± SEM (n = 250 reward and 25 shock trials; 5 mice). Vertical scale bars: 0.2 z-scores for reward, 2 z-scores for shock. Horizontal scale bar: 1 s.
(F) Mean mPFC→NAc response following lever press resulting in reward or shock. Activity suppressed during reward and increased during shock (Reward: n = 250 trials, 5 mice; Wilcoxon’s signed-rank test, *p < 1e–10. Shock: n = 25 trials, 5 mice; Wilcoxon’s signed-rank test, *p = 1.23e–5).
(G and H) As in (E) and (F), except mPFC→VTA FIP activity (n = 250 reward trials, 31 shock trials, 5 mice). Average reward-retrieval time: 0.80 ± 0.06 s after the lever press. mPFC→VTA activity is suppressed during reward and increased during shock (Reward: n = 250 trials from 5 mice; Wilcoxon’s signed-rank test, *p = 4.96e–4. Shock: n = 31 trials, 5 mice; Wilcoxon’s signed-rank test, *p = 1.17e–6).
(I) mPFC→NAc activity preceding lever presses on baseline (black) or shock day (green). Mean ± SEM (n = 250 baseline and 58 shock-day trials; 5 mice).
(J) Mean suppression in mPFC→NAc activity prior to lever press was larger on shock-risk day compared to baseline day (n = 250 baseline and 58 shock day trials, 5 mice; Wilcoxon’s rank-sum test, *p = 0.020).
(K and L)As in (I) and (J), except mPFC→VTA. Mean mPFC→VTA suppression prior to lever press was not different between baseline and shock days (n = 250 baseline and 86 shock day trials, 5 mice; Wilcoxon’s rank-sum test, p = 0.68).
(M) Same data in panel (J) averaged across mice instead of trials. Each pair: individual mouse (n = 5 mice; paired t test, t4 = −3.85, *p = 0.018).
(N) On shock day, a positive correlation between number of lever presses made and mean relative suppression of mPFC→NAc prior to lever press (n = 5 mice; Pearson’s r = 0.96, p = 0.011).
(O) Same data in panel (L), averaged across mPFC→VTA mice instead of trials. Each pair: individual mouse (n = 5 mice; paired t test, t4 = −0.048, p = 0.65).
(P) No correlation between number of lever presses made and mean relative suppression in mPFC→VT Aactivity prior to lever press (n = 5mice; Pearson’sr= −0.17, p = 0.79).
All bar graphs plotted as mean ± SEM. See also Figure S3.
Although foot-shocks substantially suppressed reward seeking, mice continued to seek reward occasionally. Since broadly increased mPFC activity suppresses active reward seeking (Ferenczi et al., 2016), we hypothesized that immediately prior to lever presses for reward with risk of foot-shock, cells of both projections would exhibit relative activity-reduction (corresponding to released mPFC suppression of reward seeking). We observed relative suppression but surprisingly only in mPFC→NAc (not mPFC→VTA) prior to lever presses on shock-risk days compared to baseline days (Figures 2I–2L). This suppression could be readily observed within individual mPFC→NAc mice (Figure 2M), and the magnitude of suppression in each mouse predicted reward-seeking propensity (Figure2N), whereas for mPFC→VTA mice, neither suppression prior to reward seeking nor correlation between suppression and reward seeking was observed (Figures 2O and 2P).
To determine whether mPFC→NAc or mPFC→VTA projections could causally drive suppression of reward seeking, we generated mice with an excitatory opsin optimized for expression and redshifted actuation (bReaChES-mCherry; Rajasethupathy et al., 2015) expressed bilaterally. To target mPFC→NAc neurons, we injected CAV2-Cre into NAc and AAV-DIO-bReaChES-mCherry into mPFC, with optical fiber in mPFC (Figure3A). Testing whether stimulation of mPFC→NAc cell bodies would be aversive using real-time place preference (RTPP), we found reduced occupancy on the otherwise-neutral stimulation side (place aversion), with no effect on locomotion velocity (Figures 3B–3D). However, stimulation of mPFC→VTA cell bodies affected neither side-occupancy nor locomotion velocity (Figures 3E–3H). While mPFC→NAc may preferentially target circuitry promoting aversion behavior, mPFC→VTA may not or may instead target neurons promoting both appetitive and aversive responses.
Figure 3. Optogenetic Stimulation of mPFC→NAc Projections Does Not Suppress Reward Seeking.
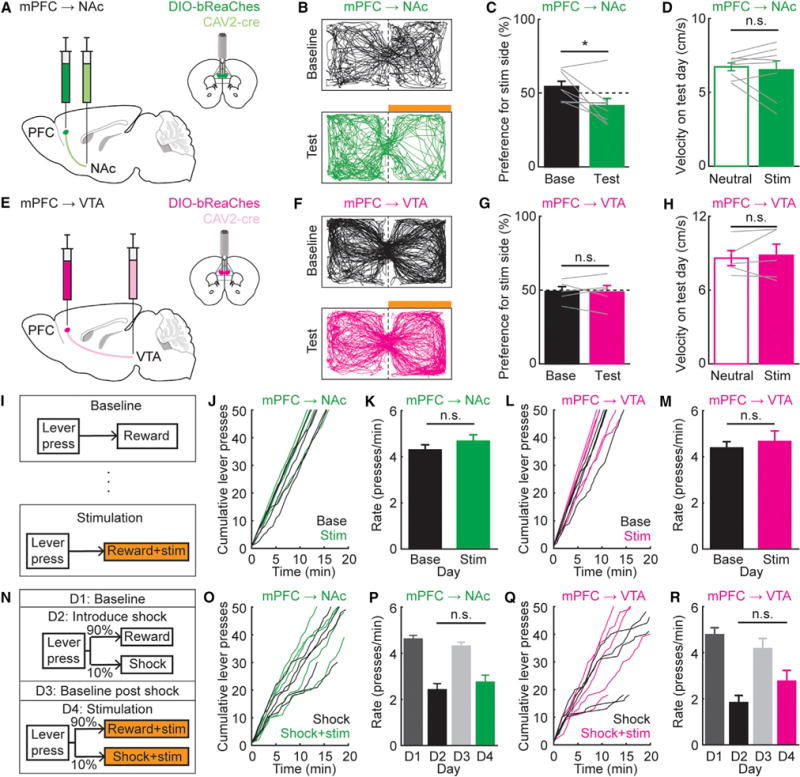
(A) Schematic for mPFC→NAc stimulation.
(B) Example RTPP locomotor traces during baseline and test days: mPFC→NAc mice. Orange bar, stimulation side.
(C) % time spent on stimulation side (stim): baseline (base) and test days. mPFC→NAc mice spent less time on the stim side (test versus baseline days; n = 8 mice; paired t test, t7 = 2.67, *p = 0.032). Grey lines, individual mice.
(D) No change in velocity on test day (neutral versus stim side, mPFC→NAc; n = 8 mice; paired t test, t7 = 0.50, p = 0.63).
(E–H) As in (A)–(D), for mPFC→VTA. No difference between % time spent on stim side (baseline versus test day; n = 5 mice; paired t test, t4 = 0.17, p = 0.87). No change in velocity on test day (neutral versus stim side; n = 5 mice; paired t test, t4 = −0.48, p = 0.66).
(I) Protocol: on baseline and stim days, 100% of lever presses gave liquid reward. On stim day, each press also resulted in 5 s bReaChES stimulation.
(J) Cumulative # lever presses, baseline and stim sessions, mPFC→NAc mice. Each line: individual mouse.
(K) Average rate of pressing, baseline and stim days, mPFC→NAc mice. No difference in rate of pressing on baseline versus stim days (n = 5 mice; paired t test, t4 = −1.28, p = 0.27).
(L and M) As in (J) and (K), except mPFC→VTA mice. No difference in press rate, baseline versus stim day (n = 5 mice; paired t test, t4 = −0.80, p = 0.47).
(N) Protocol. Days 1 and 3: 100% of presses gave liquid reward. Days 2 and 4: 10% of presses gave 1 s foot shock instead. Day 4: each press also resulted in 5 s bReaChES stimulation.
(O) Cumulative # of presses: day 2 (shock), day 4 (shock + stim), mPFC→NAc mice.
(P) Average rate of pressing across days, mPFC→NAc. No difference, day 2 (shock) versus day 4 (shock + stim; n = 5 mice; one-way ANOVA, F3,16 = 28.59, p = 1.16e–6; Tukey-Kramer multiple comparisons test, day 2 versus day 4, p = 0.69).
(Q and R) As in (O) and (P), for mPFC→VTA. No difference in pressing, day 2 versus day 4 (n = 5 mice; one-way ANOVA, F3,16 = 13.76, p = 1.07e–4; Tukey-Kramer multiple comparisons test, day 2 versus day 4, p = 0.30).
All bar graphs plotted as mean ± SEM.
Next, we trained mice to lever-press for reward and asked whether pairing stimulation of the mPFC→NAc projection with lever presses could suppress simple reward seeking (Figure 3I). Activation of mPFC→NAc (Figures 3J and 3K) suppressed neither reward-seeking nor lever-pressing rate (nor did activation of mPFC→VTA; Figures 3L and 3M). We then asked whether stimulation of either projection could suppress reward seeking in the setting of contingent foot-shock. To avoid floor effects, we reduced shock probability from 30% to 10%, resulting in ~40%–50% reduction in lever-pressing rate on shock days (Figure 3N). Here, even on shock days, optogenetic stimulation of mPFC→NAc or mPFC→VTA still had no effect on lever-pressing rate (Figures 3O–3R), suggesting a need for more refined targeting to identify a causally relevant pathway.
Reactivation of mPFC→NAc Shock Cells before Suppression of Reward Seeking
To identify whether a specific subpopulation of mPFC projection neurons is involved in suppression of reward seeking, we expressed GCaMP6f in either mPFC→NAc or mPFC→VTA neurons and implanted a gradient-index (GRIN) lens in mPFC to enable 2-photon Ca2+ imaging of individual neurons in vivo (Dombeck et al., 2007; Harvey et al., 2012; Pinto and Dan, 2015). We designed a trial-based, head-fixed lever-press task to probe both reward seeking and its suppression during imaging (Figure 4A). A 5 s tone indicated trial initiation (lever extension); a pressed-lever trial led to 80% chance of reward and 20% chance of foot-shock. If the mouse did not press within 5 s (“missed trial”), the lever was retracted and trial ended. This contingency resulted in ~50% reduction in reward seeking across both groups (Figures 4B and 4C; Movie S1).
Figure 4. mPFC→NAc and mPFC→VTA Population Dynamics Can Discriminate Reward and Shock Trials.
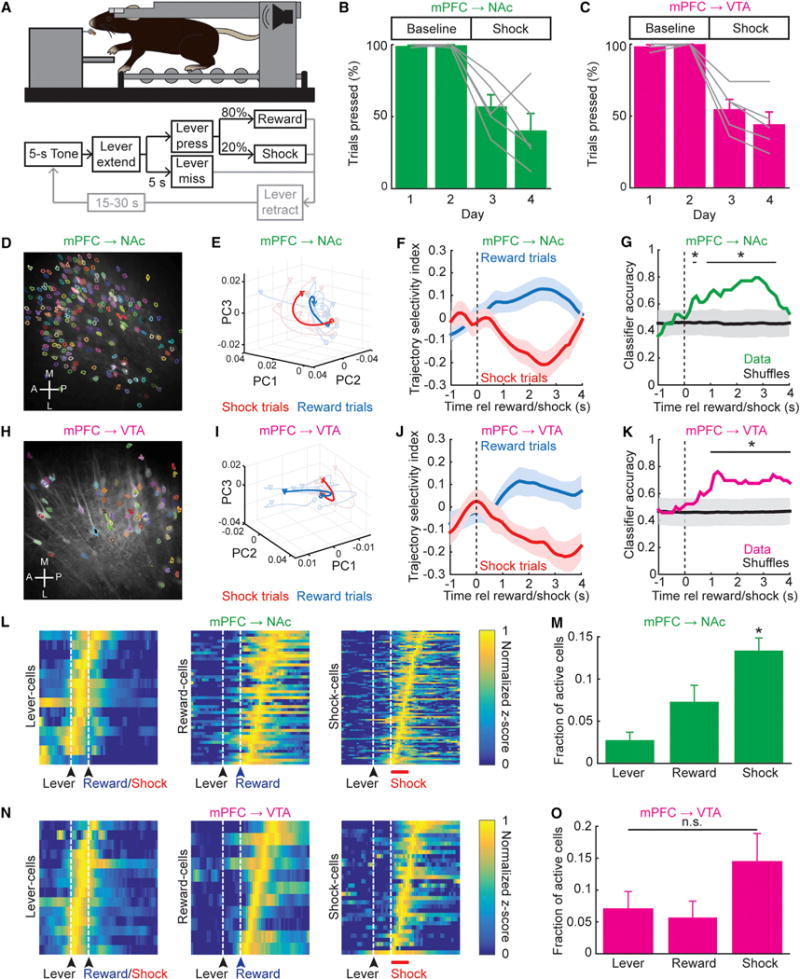
(A) Schematic. After 5 s tone, lever extended for 5 s; lever press gave 80% chance of reward/20% chance of 1 s foot-shock. 1 s delay between lever press and reward/shock. If no press in 5 s, lever retracted.
(B and C) % press trials (two baseline and two shock days, 50 trials/day). mPFC→NAc (B) and mPFC→VTA (C) mice suppressed pressing during shock days versus baseline days (mPFC→NAc: n = 5 mice; one-way ANOVA, F3,16 = 17.66, p = 2.49e–5; Tukey-Kramer multiple comparisons test, p < 0.05, shock versus baseline days. mPFC→VTA: n = 5 mice; one-way ANOVA, F3,16 = 28.58, p = 1.13e–5; Tukey-Kramer multiple comparisons test, p < 0.05, shock versus baseline days).
(D) Example 2-photon image, GCaMP6f in mPFC→NAc neurons. Active cells outlined as masks.
(E) Example reward/shock trial trajectories projected onto first 3 PC dimensions; single mPFC→NAc mouse. Thin lines, individual trials; thick lines, mean.
(F) Averaged trajectory-selectivity index across reward/shock trials (all mice) calculated as (dshock – dreward)/(dshock + dreward) where d = Euclidean distance of trial to either mean reward or shock trajectory. Mean ± SEM (n = 22 reward/22 shock trials; 5 mice).
(G) Classifier accuracy for all trials across mice; trajectory selectivity indices discriminated reward/shock trials (1,000 shuffled distributions plotted as mean ± 2 SD; *p < 0.05).
(H–K) As in (D)–(G), for mPFC→VTA cells. Reward/shock trials could be discriminated using trajectory-selectivity indices (n = 23 reward/23 shock trials; 5 mice).
(L) Heatmaps of normalized z-scored activity for mPFC→NAc cells correlated with lever press, reward, or shock.
(M) Mean fractions mPFC→NAc lever cells, reward cells, and shock cells (more shock cells seen than lever or reward cells; n = 5 mice; one-way ANOVA, F2,12 = 12.25, p = 0.0013; Tukey-Kramer multiple comparisons test *p < 0.05).
(N and O) As in (L) and (M), for mPFC→VTA cells. No difference in fraction of lever, reward, or shock cells (n = 5 mice; one-way ANOVA, F2,12 = 1.97, p = 0.18).
All bar graphs plotted as mean ± SEM. See also Figures S4 and S5.
Principal-component analysis (PCA) of fluorescence timeseries across all active mPFC→NAc cells on the shock-risk day revealed that cell activity variance could be substantially explained by activity differences between reward and shock trials (Figures 4D and 4E), suggesting that individual neurons could encode either reward or shock. We calculated a reward/shock trajectory-selectivity index for each trial plotted in the space of the top three principal components (Method Details; Harvey et al., 2012) and found clear separation of individual trials (Figures 4F and S4A), which could be classified as reward or shock with 79.6% ± 6.2% accuracy using mPFC→NAc cells (Figures 4G and S4B). PCA of the timeseries across mPFC→VTA cells on shock days revealed similar separation of trajectory-selective indexes (Figures 4H–4J and S4C), with reward/shock trial classification accuracy of 76.1% ± 6.4% (Figures 4K and S4D).
We then categorized individual cells by fluorescence timeseries during specific trial epochs (Method Details; Miri et al., 2011). We found individual mPFC→NAc neurons correlated with lever press, reward, or shock across all mice (Figures 4L and S4E–S4H), with shock cells predominating over lever or reward cells (Figure 4M). We also found individual mPFC→VTA neurons encoding lever press, reward, or shock (Figures 4N and S4I), with no category predominance (Figure 4O). mPFC→NAc shock cells were more medial and posterior compared to randomly chosen subpopulations (Figures S5A–S5C), but no anatomical clustering among mPFC→NAc reward cells or mPFC→VTA cells was observed (Figures S5D–S5L).
Having demonstrated that both population-level and individual-cell activity of mPFC→NAc and mPFC→VTA neurons could discriminate these positive- and negative-valence stimuli, we tested whether activity could predict trial-to-trial decision making. We built a linear discriminant analysis (LDA) model based on neural activity during the 5 s tone immediately preceding lever availability to predict on a given trial whether the mouse would press or miss the lever. We first used Lasso regression (Method Details; Tibshirani, 1996) to identify the subset of neurons that could best predict outcome (missed and pressed cells; Figure 5A) and then used average activity of these neurons during the 5 s tone to fit an LDA and determine the model’s accuracy in predicting trials. mPFC→NAc missed and pressed cells could predict trial-by-trial decision making across all mice, with a mean accuracy of 81.1% ± 1.3% (Figure 5B); mPFC→VTA cells were significantly less predictive (mean accuracy of 63.8% ± 3.8%; Figures 5C and 5D).
Figure 5. mPFC→NAc Population Dynamics Predict Individual Reward-Seeking or Suppression Decisions.
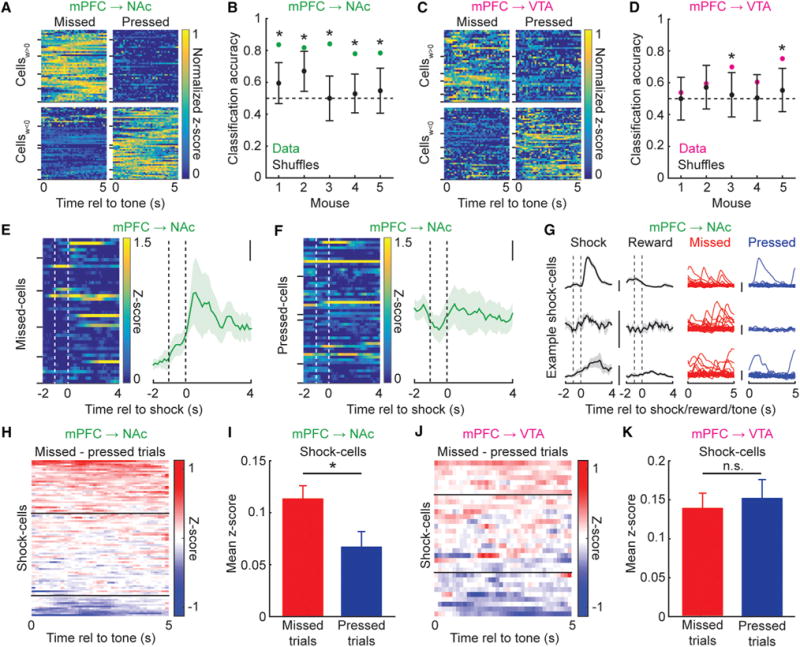
(A) Heatmaps of normalized activity during 5 s tone for mPFC→NAc cells that discriminate missed versus pressed trials (positive Lasso regression weight cells (Cellsw > 0) predicted missed trials, while negative Lasso regression weight cells (Cellsw < 0) predicted pressed trials. Horizontal ticks along left vertical axis separate cells from different mice.
(B) Classification accuracy from LDA of missed versus pressed trials using only Lasso regression-identified cells. All models for mPFC→NAc could predict trial-by-trial lever pressing (1,000 shuffled distributions plotted as mean ± 2 SD, *p < 0.05).
(C and D) As in (A) and (B), except mPFC→VTA. Only models from two out of five mice could predict trial-by-trial pressing, both with classification accuracy < all accuracies of mPFC→NAc mice.
(E) Left: Heatmap of activity during foot-shock for mPFC→NAc neuronswith positive Lasso regression weight (missed cells). First dashed vertical line, lever press time; second dashed line, shock time. Horizontal ticks (left vertical axis) separate cells from different mice. Right: Average activity during foot-shock, all missed cells. Mean ± SEM; scale: 0.1 z-scores (n = 44 cells, 5 mice).
(F) As in (E), for mPFC→NAc cells with negative Lasso regression weight (pressed cells; n = 53 cells, 5 mice).
(G) Activity of three example mPFC→NAc shock cells during shock, reward, and 5 s tone preceding missed or pressed trials (these shock cells more active during 5 s tone preceding missed versus pressed trials. Scale: 2 z-scores. Average activity during shock and rewards plotted as mean ± SEM.
(H) Difference in mPFC→NAc shock-cell activity during 5 s tone preceding missed/pressed trials. Horizontal black lines, cells with average activity difference of 0.1 and −0.1.
(I) Mean activity of mPFC→NAc shock cells was higher during 5 s tones prior to missed versus pressed trials (n = 91 cells, 5 mice; Wilcoxon’s signed-rank test, *p = 0.0023).
(J and K) As in (H) and (I), for mPFC→VTA shock cells. No difference in mean shock-cell activity during 5 s tones prior to missed versus pressed trials (n = 32 cells, 5 mice; Wilcoxon’s signed-rank test, p = 0.85).
All bar graphs plotted as mean ± SEM. See also Figure S6.
We then asked whether mPFC→NAc missed cells or pressed cells had differential responses to the punishment. Intriguingly, missed cells exhibited larger shock responses than pressed cells (Figures 5E, 5F, and S6A), suggesting specific overlap between neurons encoding shock and neurons predicting suppression of reward seeking. There was no difference in responses of mPFC→NAc missed and pressed cells to reward (Figure S6B) and no difference in responses of mPFC→VTA missed and pressed cells to either shock or reward (Figures S6C and S6D). As Lasso regression selects a subset of neurons as predictors, we then examined the activity of all identified shock cells during the 5 s tone preceding missed and pressed trials. mPFC→NAc shock cells were more active during the 5 s tone preceding missed trials versus pressed trials (Figures 5G–5I), whereas mPFC→VTA shock cells responded similarly prior to missed or pressed trials (Figures 5J and 5K). Neither the mPFC→NAc nor mPFC→VTA reward cells exhibited differential responses prior to missed versus pressed trials (Figures S6E and S6F).
mPFC→NAc Shock Cells Modulate Reward-Related Decision Making
The specific relationship between neural responses to shock and responses that predicted suppression of reward seeking led us to ask whether mPFC→NAc shock cells could causally modulate this decision. To selectively manipulate shock neurons and projections by optogenetics in wild-type animals (without transgenics), we developed a dual-virus system termed vCAPTURE combining the activity-dependent E-SARE-CreER vector (Kawashima et al., 2013) with another Cre-dependent viral vector expressing axon-filling opsins and fluorescent proteins, in this case to permanently label mPFC neurons active during foot shock (Ye et al., 2016).
To validate specificity of this activity-dependent targeting, we injected mice with a mixture of AAVs encoding E-SARE-CreER and Cre-dependent eYFP in mPFC (Table S2). 2 weeks later, the animals underwent a behavioral battery (Figure S7A), after which 4-hydroxytamoxifen (4-TM) was injected to allow Cre-mediated recombination (and eYFP expression) in neurons that were active during the time window defined by 4-TM injection. As expected, minimal eYFP was induced by the foot-shock protocol in the absence of 4-TM (Vehicle group; Figure S7B). When 4-TM was present, consistent with previous validations (Kawashima et al., 2013), we observed robust induction of eYFP in foot-shocked mice (Shock group) and in mice exposed to a novel female mouse (Female group), compared to mice that were left in their home cage but had received foot shocks 24 hr prior to 4-TM injection (Home24s group; Figure S7B).
We then compared vCAPTURE-mediated eYFP labeling during foot-shock to endogenous c-FOS/ARC immunostaining following the same foot-shock protocol experienced again 2 weeks later (Figure S7A). Demonstrating selective labeling of Shock cells by E-SARE-CreER during the protocol, there was a higher-percentage overlap between captured eYFP+ Shock cells and immunostained c-FOS/ARC+ Shock cells, compared to overlap between either eYFP+ Home24s cells or Female cells with c-FOS/ARC+ Shock cells (Figure S7C). Overlap of captured Home24s cells and Female cells with c-FOS/ARC+ Shock cells was similar (Figure S7C). In an additional cohort, we confirmed that vCAPTURED Shock cells exhibit both higher eYFP+ cell count and higher overlap with FOS/ARC+ Shock cells, compared to vCAPTURED Home cage cells (now labeled without foot-shock 24 hr prior; Figure S7D). Furthermore, we confirmed that vCAPTURED mPFC Shock cells project to NAc or VTA (Figure S7E). Compared to mice left in the home cage, mice that received shocks exhibited more mPFC axon-fluorescence labeling in lateral than medial NAc (Figures S7F and S7G), in line with our behavioral and imaging results.
We then used this approach to drive expression of bReaChES-mCherry specifically in mPFC neurons active during foot-shock (Figure 6A). With bilateral optical fibers over NAc, stimulation of mPFC→NAc shock-specific axons elicited place aversion (Figures 6B–6D), as with stimulation of all mPFC→NAc cell bodies (Figure 3C). Here, we also observed a trend (not significant; p = 0.16) for increased velocity in the stimulation versus neutral side with mPFC→NAc-shock-axon stimulation on the test day (Figure 6E), potentially relevant to aversive-like escape responses observed previously with stimulation of specific subtypes of NAc neurons (Kravitz et al., 2012). Also as with nonactivity-specific mPFC→VTA drive (Figure 3G), stimulation of mPFC→VTA shock-specific axons did not elicit place preference or aversion (Figures 6F–6I). We then trained mice on the trial-based, head-fixed lever-press task used in Figure 4. Guided by our 2-photon Ca2+ imaging results wherein we observed increased mPFC→NAc shock-cell activity prior to missed trials (Figure 5H), we stimulated vCAPTURED mPFC→NAc shock axons during the 5 s tone and lever extension (Figure 6J). Unlike stimulation of all mPFC→NAc cell bodies (Figure 3K), stimulation of mPFC→NAc shock-specific axons elicited moderate suppression of reward seeking (Figure 6K), while stimulation of mPFC→VTA shock axons had no effect (Figure 6L). Mice exposed to the foot-shock protocol but injected with Vehicle instead of 4-TM exhibited no change in place preference or reward seeking during either mPFC→NAc or mPFC→VTA axon stimulation (Figures S7H–S7M). Furthermore, mice with mPFC→NAc home cage neurons labeled via vCAPTURE exhibited no change in reward seeking during bReaChES axon stimulation (Figure S7N). Finally, we calculated a difference score between lever-pressing behavior on the stimulation and baseline days across all conditions (Stimulation day – Baseline day, during light-on). Compared to all other control conditions (mPFC→VTA shock, mPFC→NAc vehicle, mPFC→VTA vehicle, and mPFC→NAc home cage), the mPFC→NAc shock condition exhibited a lower difference score (Figure 6M).
Figure 6. Optogenetic Recruitment of Shock-Labeled PFC→NAc Projections Reduces Reward Seeking.
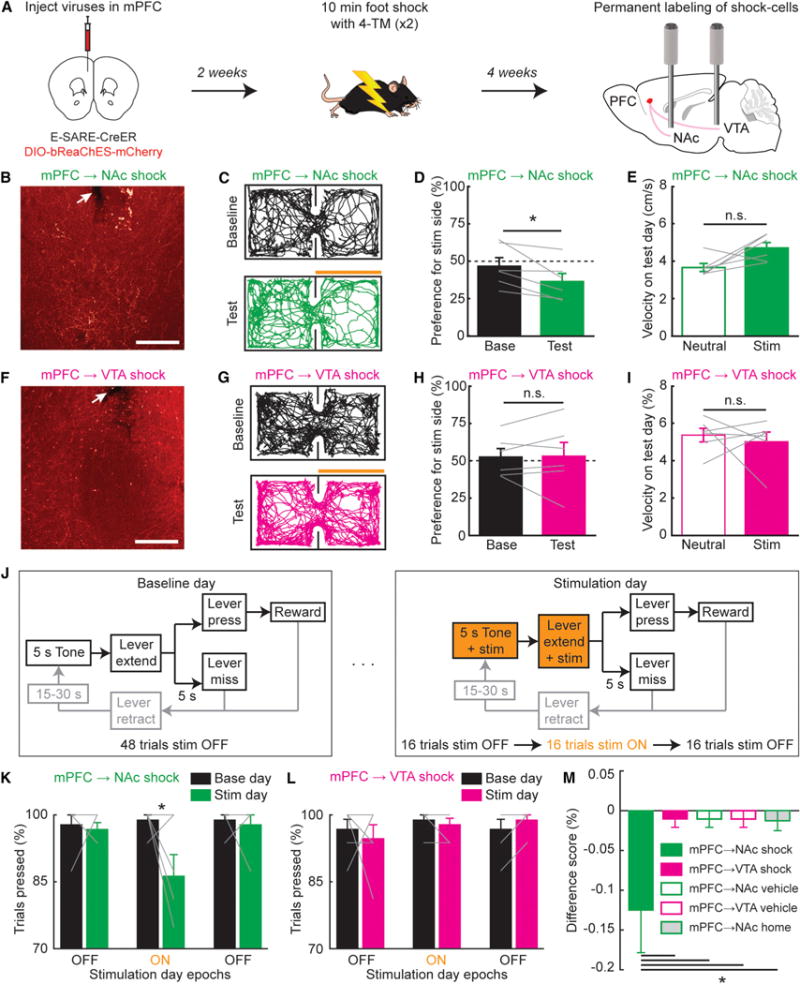
(A) Timeline for activity-dependent labeling. Mice injected in mPFC with viral mixture of E-SARE-CreER and DIO-bReaChes-mCherry and implanted with bilateral optical fibers in NAc and VTA (for clarity, schematic illustrates only unilateral injection and implant).
(B) Example histology of fiber tip in NAc (white arrow) and mCherry-expressing mPFC axons. Scale: 150 μm.
(C) Example RTPP locomotor traces during baseline day (no optogenetic stim) and test day (bReaChes stim of mPFC→NAc shock axons). Orange bar: stim side.
(D) Mice spent less time on stim side on test versus baseline day (n = 6 mice, Wilcoxon’s signed-rank test, *p = 0.031). Grey lines, individual mice.
(E) No difference in velocity, neutral versus stim side, test day (n = 6 mice, Wilcoxon’s signed-rank test, p = 0.16).
(F–I) As in (B)–(E), for mPFC→VTA shock-axon stim. No difference in preference for stim side on baseline versus test day (n = 6 mice; Wilcoxon’s signed-rank test, p = 0.84). No difference in velocity, neutral versus stim side on test day (n = 6 mice, Wilcoxon’s signed-rank test, p = 1).
(J) Stim paradigm during lever press. Light delivered during 5 s tone and terminated when lever was pressed or retracted (after 5 s).
(K) % trials resulting in lever press during consecutive light OFF, ON, and OFF epochs. Reduction in pressing seen during mPFC→NAc shock-axon stim on test versus baseline day (n = 6 mice; two-way ANOVA interaction, F2,30 = 3.78, p = 0.034; Bonferroni test during light ON, *p = 0.0028).
(L) As in (K), for stimulation of mPFC→VTA shock axons. No change in pressing during mPFC→VTA shock-axon stim on test versus baseline day (n = 6 mice; two-way ANOVA interaction, F2,30 = 0.82, p = 0.45).
(M) Difference score calculated during “light on” epoch on baseline and stimulation days (Stimulation–Baseline). Difference score for mPFC→NAc shock condition was lower than difference score for all other conditions (n = 6 for mPFC→NAc/VTA shock, n = 6 for mPFC→NAc/VTA vehicle, n = 5 mice for mPFC→NAc home cage; N-way ANOVA F4,28 = 3.76, p = 0.016, Dunnett’s multiple comparisons test for mPFC→NAc shock versus all other conditions, *p < 0.05). All bar graphs plotted as mean ± SEM. See also Figure S7.
DISCUSSION
Here, we report design and application of circuit-interrogation technology to identify structurally, physiologically, and molecularly defined elements of behavior. In mouse assays designed to elicit and quantify goal-directed behavior involving both rewarding and punishing consequences (compatible with the brainwide cellular-resolution circuit-interrogation method), we find that taking action with known risk of punishment involves acutely diminished mPFC→NAc (but not mPFC→VTA) influence and indeed that activity within specific substreams of the mPFC→NAc projection both signals information about prior aversive outcomes and serves to suppress the taking of rewarded action.
Projection-specific molecular profiling and labeling were used to discover that mPFC→NAc and mPFC→VTA projections were non-overlapping and tied to cortical sublamination, consistent with fundamentally distinct behavioral roles discovered later. While it was not unexpected that mPFC→VTA neurons could reside in deeper layer 5b (previously reported for cortico-subcortical pyramidal neurons; Kim et al., 2015), it was surprising to find that the majority of mPFC→NAc neurons resided in more superficial layer 5a, since both layer 5a and 5b cortical neurons have been shown to project to striatum (Cowan and Wilson, 1994; Levesque et al., 1996; Wall et al., 2013). mPFC may thus be specifically designed to route unique information or computations to layer 5a neurons that can be relayed to NAc rather than to VTA. While we did not observe significant overlap between mPFC neurons that project to NAc and VTA, the possibility remains that mPFC→NAc neurons could collateralize to other brain areas, and that such projections could also contribute to the functional and optogenetic results.
Optical recording of the entire mPFC→lateral-shell NAc projection indicated that activity in this subpopulation encodes punishment-related internal states and is naturally inhibited upon initiation of reward seeking associated with punishment. NAc is a known regulator of reward seeking (Creed et al., 2015; Lobo and Nestler, 2011) and risk evaluation (Zalocusky et al., 2016); a direct top-down glutamatergic projection from mPFC would be well positioned to mediate punishment-encoding responses and suppression of reward seeking, for example, through direct activation of D2R neurons or indirect inhibition of D1R neurons via local parvalbumin interneurons (Calipari et al., 2016; Kravitz et al., 2012; Qi et al., 2016) or direct stimulation of dynorphin neurons (Al-Hasani et al., 2015). While the role of glutamatergic inputs to the medial core of NAc in promoting reward seeking has been studied (Britt et al., 2012; Otis et al., 2017; Pascoli et al., 2014; Qi et al., 2016; Stuber et al., 2011), here, we demonstrate that glutamatergic inputs to lateral shell of NAc can encode and drive punishment or aversion responses. Furthermore, while previous work reported that cocaine-activated neurons in mPFC exhibit high levels of NPAS4 expression and project to medial shell of NAc (Ye et al., 2016), we here did not observe elevated expression of NPAS4 in mPFC neurons that project to lateral shell of NAc and drive aversion. Thus, not only do mPFC neurons projecting to lateral versus medial NAc exhibit key differences in behavioral effects but also are defined by distinct molecular signatures, which may be of both basic and translational significance.
While optogenetic stimulation of mPFC→NAc neurons as a population could elicit aversion of a neutral environment, and this population was naturally inhibited upon initiation of reward seeking, suppression of reward seeking by experimentally driving this mPFC→NAc population was not found, suggesting functional diversity or opponency within this projection. We first used 2-photon Ca2+ imaging to reveal that mPFC→NAc Shock cells encode suppression of reward seeking during shock-risking epochs. To test whether this shock-activated mPFC→NAc neuronal subpopulation could in fact contribute to suppression of reward seeking, we developed and used a dual-virus, activity-dependent opsin tool to label (for later control) the mPFC neurons activated by shock. Unlike existing methods that use a single virus to drive transient expression of c-FOS-mediated protein (Gore et al., 2015; Ye et al., 2016), this method results in permanent expression of any protein expressed in the vector while eliminating the need for transgenic mouse lines (Liu et al., 2012; Reijmers et al., 2007). Compared to other dual-viral systems using the doxycycline-tetOff system (Roy et al., 2016), the activity-dependent 4-TM-CreER system allows a more specific time window of labeling (injecting fast-acting tamoxifen as opposed to ceasing doxycycline treatment). In order to efficiently drive a second Cre-dependent virus encoding the opsin (which needed to be expressed at high enough levels to be functionally present in axons), the synthetic E-SARE promoter was chosen to drive CreER for greater induction of Cre expression following neural activity (Kawashima et al., 2013; Sørensen et al., 2016) compared to other IEG promoters such as c-FOS and ARC. This all-virus (and transgenic animal-independent) vCAPTURE strategy may enable future lines of investigation in diverse animal species.
We note that our optogenetic stimulation of previously active shock neurons did not elicit complete suppression of reward seeking. Given the complexity of decision making, it is unlikely that a single mPFC projection is solely responsible for suppression of reward seeking (Orsini et al., 2015a). Many brain regions have been shown to suppress reward seeking in neutral contexts or during risky reward seeking, including ventral mPFC (Pfarr et al., 2015; Warren et al., 2016), basolateral amygdala (Floresco et al., 2008; St Onge et al., 2012; Orsini et al., 2015b), and potentially lateral habenula (Stopper and Floresco, 2014). It is possible that during reward seeking conflicted with punishment, ventral or dorsal mPFC neurons that encode punishment also project to these other regions and help drive suppression of reward seeking. Moreover, as there is likely not 100% overlap between mPFC neurons that respond to pseudorandomly delivered shocks (those captured by E-SARE labeling) and those that respond to lever-contingent shocks (those that should suppress reward seeking), this could place an upper bound on the suppression that can be elicited using these methods. Future improvements to activity-dependent techniques with narrower time windows (but still deep brain access) could enable specifically labeling contingent shock neurons.
In addition to basic science value, molecular and anatomical identification of cellular targets causal in any adaptive behavior may have implications for understanding or treating corresponding maladaptive behaviors. Prominent specific frontal loci of hypermetabolism and/or elevated activity have been reported to correlate with key symptoms of depression including anhedonia (Ferenczi et al., 2016; Mayberg et al., 2005); such linkages could be mediated in part by circuit elements such as the mPFC→NAc projecting subpopulation that contributes to suppression of reward seeking (Figure 6K). The concomitant aversive quality of activity in this projection (which may normally support its role in suppressing reward seeking under challenging conditions; Figure 6D) when recruited heavily for reward-seeking suppression (and thus hyperactive) could additionally contribute to the maladaptive dysphoria of depression.
Regarding addiction, it has been found (with optogenetics in rodents) that prefrontal stimulation plays a role in inhibition of drug self-administration, even in the severely addicted (Chen et al., 2013a). Here, we identify a precise top-down pathway through which these adaptive but also clinically important effects could be exerted. A core criterion of substance-use disorder is continuing use of the rewarding substance despite clear consequences: negative physical sequelae, negative social effects, and/or placement of the user in dangerous situations. It is not understood from the perspective of organismal-survival mechanisms how the destructive consequences of substance use could become entirely unable to deter use. This remarkable conditionality of punishment-related responses, central to drug abuse, is also of fundamental significance in non-drug-related behavior; normally aversive experiences can manifest with altered (e.g., neutralized, or even positive) valence for a variety of adaptive and maladaptive reasons. Identifying these circuit elements and their properties may not only advance understanding and targeting of circuit elements that could be causal (or therapeutic) in human substance-use and neuropsychiatric disorders but may also provide insight into the basic brainwide negotiations and computations adjudicating responses to aversion and reward.
STAR★METHODS
Detailed methods are provided in the online version of this paper and include the following:
KEY RESOURCES TABLE
| REAGENT or RESOURCE | SOURCE | IDENTIFIER |
|---|---|---|
| Antibodies | ||
| Rabbit polyclonal anti-GFP | Abcam | Cat#ab290; RRID: AB_303395 |
| Rat monoclonal anti-mCherry, Alexa Fluor 594 Conjugated | Invitrogen | Cat#M11240; RRID: AB_2536614 |
| Rat monoclonal anti-CTIP2 | Abcam | Cat#ab18465; RRID: AB_2064130 |
| Rabbit polyclonal anti-GABA | Sigma | Cat#A2052; RRID: AB_477652 |
| Rabbit polyclonal anti-GFP, Alexa Fluor 488 Conjugated | Life Technologies | Cat#A21311; RRID: AB_221477 |
| Rabbit monoclonal anti-c-FOS | Cell Signaling | Cat#2250; RRID: AB_2247211 |
| Rabbit polyclonal anti-ARC | Synaptic Systems | Cat#156 003; RRID: AB_887694 |
| Dynabeads Protein G | Life Technologies | Cat#10003D |
| Donkey polyclonal anti-rat, Alexa Fluor 594 Conjugated | JacksonImmuno | Cat#712-585-153 |
| Donkey polyclonal anti-rabbit, HRP Conjugated | JacksonImmuno | Cat#711-035-152 |
| Bacterial and Virus Strains | ||
| See Table S2 for complete list of viruses. | N/A | N/A |
| Critical Commercial Assays | ||
| Affymetrix GeneChip Mouse Gene 2.0 ST Array | Thermofisher Scientific | Cat#902119 |
| Deposited Data | ||
| Microarray showing gene expression difference between mPFC→NAc and mPFC→VTA neurons. | This paper | GEO: GSE101185; https://www.ncbi.nlm.nih.gov/geo/query/acc.cgi |
| Experimental Models: Organisms/Strains | ||
| Mouse: wild type C57BL/6J | Jackson Laboratory | JAX: 000664 |
| Mouse: Rosa26loxp-stop-loxp-eGFP-L10 | Dr. Evan Rosen at Harvard Medical School | N/A |
| Recombinant DNA | ||
| See Table S2 for complete list of plasmids. | N/A | N/A |
| Software and Algorithms | ||
| MATLAB | Mathworks | Mathworks.com |
| Cellsort MATLAB algorithm for extracting cellular Ca2+ signals | Mukamel et al., 2009 | http://www.cell.com/neuron/abstract/S0896-6273(09)00619-9 |
| Custom MATLAB scripts for analyzing Ca2+ signals | Mathworks | Available upon request from Lead Contact, Karl Deisseroth (deissero@stanford.edu) |
| GraphPad Prism | GraphPad | Graphpad.com |
| G*Power | Heinrich Heine University of Düsseldorf | Gpower.hhu.de |
| FIJI | University of Wisconson-Madison LOCI | Fiji.sc |
| IMARIS | Bitplane | Bitplane.com |
| Other | ||
| 1.0-mm GRIN lens | Doric Lenses | MFC_400/430-0.48_2mm_MF1.25_FLT |
| Bilateral, 200-μm, 0.39-NA optical fiber for optogenetics | Thorlabs | CFM32L10 |
| Unilateral, 200-μm, 0.39-NA optical fiber for optogenetics | Thorlabs | CFML12L05 |
CONTACT FOR REAGENT AND RESOURCE SHARING
Further information and requests for resources and reagents should be directed to and will be fulfilled by the Lead Contact, Karl Deisseroth (deissero@stanford.edu).
EXPERIMENTAL MODEL AND SUBJECT DETAILS
All experimental and surgical protocols were approved by Stanford University’s Institutional Animal Care and Use Committee. For molecular profiling experiments, male and female heterozygous and homozygous eGFP-RLP10a transgenic mice aged 7–8 weeks were used (Long et al., 2014). For all other experiments, male and female C57BL/6J mice aged 7–8 weeks obtained from The Jackson Laboratory (strain 000664) were used. Mice were randomly assigned to experimental groups. Mice were group-housed except for those implanted with GRIN lenses, which were single-housed. Mice were maintained on a reverse 12-hour light/dark cycle, and given ad libitum food and water outside of behavioral training. During training, mice were food-restricted to reach 85% of their initial weight.
METHOD DETAILS
Stereotaxic Surgeries
Mice were anesthetized with 1.5%–2.0% isoflurane, and placed in a stereotaxic apparatus (Kopf Instruments) on a heating pad, as previously described (Kim et al., 2013). Briefly, the fur was cut from the scalp and a midline incision was made. 3% hydrogen peroxide was applied to the skull, and a craniotomy was made above the injection site. Virus was injected using a 33-gauge beveled needle and a 10 μL Hamilton syringe (World Precision Instruments), controlled by an injection pump (Harvard Apparatus). Volumes less than 1,000 nL were injected at 100 nL min−1, while volumes of 1,000 nL or greater were injected at 150 nL min−1. For FIP recordings, a 400-μm core diameter, 0.48-NA low-autofluorescence optical fiber (Doric Lenses) was implanted above the mPFC. For optogenetic experiments, 200-μm core diameter, 0.39-NA optical fibers (Thorlabs) were implanted bilaterally over the desired brain region. For 2-photon imaging, a 1-mm diameter GRIN lens (GRINTECH, ~4mm long singlet relay lens designed for 520 nm) was implanted above the mPFC. Implants and custom stainless steel headplates were secured to the skull using dental adhesive (Parkell, C&B metabond). See Tables S2 and S3 for concentrations and coordinates of virus injections and implants for all experiments.
Molecular profiling experiment
Transgenic ribosome tag mice were injected bilaterally in either NAc or VTA with CAV2-cre. 4 weeks later, mice were heavily anesthetized with isoflurane and the mPFC was isolated as previously described (Ye et al., 2016). Brains were cut in 2-mm thick coronal sections, and the mPFC was harvested using a 2-mm diameter tissue punch. The mPFC from n = 7 mice for each projection were pooled into one sample per projection. Following tissue homogenization and cell lysing, 50 μL of the supernatant of both samples was saved as the “input” control. The remainder of the samples was treated with anti-GFP conjugated to dynabeads followed by immunoprecipitation. mRNA was isolated from input controls and immunoprecipitated samples, and processed by the Stanford Protein and Nucleic AcideBiotechnology Facility. mRNA from all samples was split into 2 technical replicates. Microarray labeling and hybridization was performed using the Mouse Gene 2.0 ST Array (Affymetrix), and data were analyzed by Affymetrix Transcriptome Analysis Console. Genes pertaining to RNA, predicted genes, or uncharacterized genes were excluded, as well as genes with any of the following properties: a bi-weight < 5, significantly different expression levels between control NAc and VTA inputs, or a magnitude fold enrichment ≤ 1.5 between NAc and VTA projections.
Anatomical tracing experiments
For all anatomical imaging experiments, one experimenter captured images on the microscope, and a second, blinded experimenter performed the image analysis.
Dual-projection tracing
For dual-projection labeling in the same mice, HSV-flp was injected in NAc, CAV2-cre was injected in VTA, and a mixture of FDIO-eYFP and DIO-mCherry was injected in mPFC. 3–5 weeks after injections, brains were perfused and sliced on a freezing microtome. Sections were imaged on a confocal (Olympus) with identical gain and laser power settings. Cell counting was performed manually using Fiji.
Single-projection tracing
For single-projection labeling in separate mice, CAV2-cre was injected either in NAc or VTA, and DIO-eYFP was injected in mPFC. 4 weeks after injection, brains were perfused and sliced on a freezing microtome. Sections were imaged on a confocal (Olympus). Additional slices were stained for CTIP2 or GABA. Cell counting was performed manually using Fiji.
Immunohistochemistry
Mice were heavily anesthetized with isoflurane and then perfused with 20 mL of cold phosphate-buffered saline (PBS) followed by 20 mL of cold 4% paraformaldehyde (PFA). The brain was extracted from the skull and incubated in PFA for 24 h, and then transferred to 30% sucrose. After 48 h, the brain was sliced on a freezing microtome (Leica) in 60-μm sections, and stored in cryoprotectant. All slices were washed in PBS prior to antibody staining. Slices were incubated for 1 h in a blocking solution of 5% normal donkey serum (NDS) in PBS + 0.3% Triton-X (PBST). Slices were then incubated in primary antibody + 5% NDS in PBST for 1–2 days at 4°C, and then in secondary antibody + 5% NDS in PBST for 2 h at room temperature. For slices treated with TSA amplification, first the endogenous fluorescence was quenched for 15 min at room temperature in 1% H2O2 in PBS, and then slices were incubated for 1 h in a blocking solution of TNB + 0.3% Triton-X. See Table S4 for a list of antibodies used for each experiment.
Optical hardware configurations
FIP recordings
FIP recordings were acquired as previously described (Kim et al., 2016). Briefly, 470-nm and 410-nm excitation light (for Ca2+ signals and isosbestic reference signals, respectively) was alternately delivered through a fiber optic patchcord interfaced with an optical fiber implanted into the brain. Images of the patchcord end-face were captured using an sCMOS camera (Hammatsu, Orca Flash 4.0 v2) and custom-written software (Mathworks, MATLAB). The times of camera frame exposures were sampled and digitized at 5 kHz using data-acquisition hardware (National Instruments, NI PCIe-6343-X). Bulk Ca2+ recordings were obtained by averaging the fluorescence values of the pixels on the camera frames corresponding to the patchcord end-face.
2-photon Ca2+ imaging
2-photon Ca2+ imaging was performed using a commercial microscope (Bruker) and a 20 X, 0.5 NA objective (Olympus, LCPLN20XIR). A tunable IR femtosecond pulse laser tuned to 930 nm (Coherent, Chameleon Discovery) was used for excitation, and fluorescence emission was collecting using a GaAsP PMT (Hamamatsu, 7422PA-40). The excitation laser was directed by resonance scanners sampling 512×512 pixels. Each image was captured at 30 Hz, and downsampled to 7.12 Hz by averaging every 4 frames. Excitation power measured at the objective ranged from ~30–80 mW. The imaging field of view was 600×600 μm.
Optogenetic stimulation
A 594-nm laser (Cobolt, Mambo) was used to deliver bilateral optogenetic stimulation of bReaChES-mCherry. Light was delivered using 10-ms pulse widths, and ~12 mW of power measured at combined end faces of both 200-μm optical fibers. Laser shutters (Stanford Research Systems, SR474 driver and SR475 shutter head) were controlled by TTL signals delivered by a microcontroller (Arduino, Uno R3), which interfaced with behavioral apparatuses.
Activity-dependent labeling of neurons
Mice were injected in mPFC with a mixture of AAV E-SARE-ERT2CreERT2-PEST vector (from Dr. H. Bito) and the desired DIO-reporter/opsin AAV vector at the indicated genomic titers (Table S2). It is critical to maintain both the ratio and absolute genomic titers in all the viral components in the injecting mixture to ensure the specificity and efficiency. Ultra-Centrifugal filters (Amicon, 0.5ml, 100K) were used to concentrate AAVs from commercial sources to the desired genomic titers. All mice were handled and injected with saline daily for at least 5 days prior to the experiment to minimize the labeling due to handling and injections. The mice were 7–8 weeks old at the time of behavioral labeling. 2 weeks after surgery, mice were exposed to 20 random foot shocks (2 s, 0.6 mA) over the course of 10 min (for optogenetic labeling, mice were exposed to 2 consecutive days of shock and labeling), or other behavioral regimens described in the paper. 10 mg/kg 4-TM was injected IP 2–3 h after the shock exposure (Ye et al., 2016). In vehicle control groups, the mice were given the same volume of saline containing 1% Tween-80 and 2.5% DMSO without 4-TM. Mice were kept in their home cages for at least 2 additional weeks prior to experiments to allow full expression of fluorophore or opsin.
Validation of activity-dependent labeling
Male mice were injected in mPFC with a mixture of E-SARE-CreER and DIO-eYFP-NRN. Experimental mice were shocked and injected with 4-TM as described above. Control groups included Home24s, Vehicle, and Female groups. Home24s group mice were shocked, but then injected with 4-TM 24 hours later. Vehicle group mice were shocked, but injected with the vehicle solution instead of 4-TM 2 hours later. Female group mice were exposed to a novel female mouse for 20 min, and then injected with 4-TM 2 hours later. 2 weeks later, mice were all exposed to the same shock protocol, and then sacrificed 90 min later. Brains were perfused and sliced on a freezing microtome. Sections were stained for c-FOS and ARC, mounted on slides, and imaged on a confocal (Olympus) using identical gain and laser power settings. Cell counting was performed using the semi-automated function in IMARIS.
Activity-dependent tracing
Mice were injected in mPFC with a mixture of E-SARE-CreER and DIO-eYFP. Half of the mice were shocked and injected with 4-TM as described above, while the other half remained in their home cage and were injected with 4-TM. Brains were cleared using CLARITY as previously described (Chung et al., 2013; Ye et al., 2016). Hemispheres or 3 mm thick coronal sections were imaged either on a commercial light-sheet microscope (Lavision) or a confocal microscope (Olympus) using identical gain and laser power settings. The medial to lateral NAc fluorescence analysis was performed in MATLAB using coronal images. The field of view surrounding the anterior commissure was cropped, and then the fluorescence was averaged across the entire field of view in the dorsal to ventral axis.
Real-time place preference test
General test structure
Mice were placed in a custom-built RTPP chamber (1×2 ft) on day 1 to determine their baseline preference for each side of the chamber. Behavioral tracking was performed using blinded automated software (Biobserve). On day 2, mice were stimulated whenever they were on one side of the chamber. Stimulation sides were counterbalanced across mice. Each session lasted 20 min.
Whole-projection optogenetic stimulation
CAV2-cre was injected bilaterally either in NAc or VTA, and DIO-bReaChes-mCherry was injected bilaterally in mPFC. A bilateral dual-optical fiber was placed over mPFC. 4 weeks after the surgery, the RTPP test was performed using 20-Hz, 594-nm light pulses in mPFC.
Activity-dependent optogenetic stimulation
Mice were injected in mPFC with a mixture of E-SARE-CreER and DIO-bReaChes-mCherry, and optical fibers were implanted bilaterally in NAc and VTA in the same mice. 2 weeks following the surgery, all mice underwent the 2-day shock protocol (see “Activity-dependent labeling of neurons”), and half the mice were injected with 4-TM while the other half were injected with vehicle. After an additional 4 weeks, the RTPP test was first performed in one chamber with 40-Hz 594-nm mPFC→NAc axon stimulation, and then subsequently performed 2 days later in a new chamber of similar size with 40-Hz 594-nm mPFC→VTA axon stimulation. A new baseline was established in between experiments.
Self-paced lever press task
General task structure
Mice were trained to lever press for a small chocolate milk reward (70% Ensure) while freely-moving in an operant conditioning box (Coulbourn Instruments). Mice were allowed to retrieve a maximum of 50 rewards a day, and sessions were terminated after all rewards had been retrieved or after 20 min had elapsed. After a lever press, the lever was retracted for 5 s prior to extending again. After mice retrieved 50 rewards for at least 3 consecutive days (typically 2 weeks of training), mice were then given a 1 s, 0.08-mA foot shock following 30% or 10% of lever presses instead of a reward. Shocks were delivered in a pseudorandom order. Rewards were delivered using a custom set-up consisting of a lickspout (Popper and Sons, stainless steel 18-gauge) and a solenoid (Valcor, SV74P61T1) controlled by a microcontroller (Arduino, Uno R3). Reward retrieval was monitored using a capacitive sensing board (Tinker Kit) wired to the animal feeding tube and interfaced with the microcontroller. Shocks were delivered using an 8-pole scrambled shock floor (Coulbourn Instruments). The time of lever presses, reward delivery, reward retrieval, and shocks were sampled and digitized at 5 kHz using data-acquisition hardware (National Instruments, NI PCIe-6343-X).
FIP recording
CAV2-cre was injected either in NAc or VTA, and DIO-GCaMP6f was injected in mPFC. A single optical fiber was placed over mPFC. 2 weeks later, mice underwent the food-restriction protocol and began training as described above. Bulk Ca2+ recordings were performed on the last baseline day (no shocks) and the first shock day. The shock probability used was 30%. The lever was placed to the right of the lickspout for all mice. mPFC→NAc mice were re-run with the lever placed on the opposite side relative to the lickspout to discount known differences in striatal responses to contralateral versus ipsilateral body movements (Cui et al., 2013).
Whole-projection optogenetic stimulation
The same mice used in the RTPP test were used for whole-projection optogenetic stimulation during the self-paced lever press task. Following the RTPP experiment, mice underwent food-restriction and began training as described above. The lever press experiment took place approximately 1 month after the RTPP experiment. For the first experiment, mice were stimulated in mPFC with 5- or 20-Hz, 594-nm light during the entire 20 min session (no foot shocks). For the second experiment, mice were exposed to a 4-day protocol consisting of 1) no shock no light, 2) shock no light, 3) no shock no light, and 4) shock and light. The shock probability used was 10%. 20-Hz, 594-nm light stimulation was delivered to mPFC during the entire light session. The position of the lever relative to the lickspout was counterbalanced across mice.
Trial-based lever press task
General task structure
Mice were trained to lever press for a small chocolate milk reward while head-fixed in a custom-built set up (for 2-photon imaging) or while freely moving in an operant box (for optogenetic stimulation). Both setups used the same basic components. Mice were first trained to freely lever press for rewards. After retrieving 50 rewards for at least 3 consecutive days during a 20 min session, then mice were trained on atrial-structured version of the task. A 5 s tone (Coulbourn Instruments, 2.9 kHz tone module) indicated the beginning of a trial. After the tone, the lever was extended for a maximum period of 5 s, during which the mouse was able to press the lever. If the mouse pressed the lever, the lever retracted and the mouse was given a reward 1 s later. If the mouse did not press, the lever retracted after 5 s, and the trial ended. Trials were initiated randomly every 15 to 30 s, and the session was terminated after 50 trials. After mice could retrieve at least 90% of rewards for 3 consecutive days (typically 2 weeks of training), a 1 s foot shock was delivered instead of a reward after 20% of lever presses. Foot shocks were delivered 1 s after the lever press, and were pseudorandomly delivered. Foot shock amplitude started at 0.1 mA, and if the reward retrieval rate was not suppressed by at least 80%, the animal was run again the following day, increasing the amplitude by 0.1 mA each day until the mice suppressed reward seeking by at least 80% (Nieh et al., 2015). Shock amplitude ranged from 0.1–0.3 mA. Once finding the appropriate shock amplitude, mice were exposed to the shock protocol for two days. The time of lever presses, reward delivery, reward retrieval, and shocks were sampled and digitized at 5 kHz using data-acquisition hardware built-in to the 2-photon microscope (Bruker).
2-photon Ca2+ imaging
CAV2-cre was injected either in NAc or VTA, and DIO-GCaMP6f was injected in mPFC. A single GRIN lens was placed over the left mPFC. 2 weeks later, mice underwent the food-restriction protocol and began training. Data was analyzed from the 2nd shock day. The lever was placed on the right side of the mouse.
Activity-dependent optogenetic stimulation
The same mice used in the RTPP test were used for activity-dependent optogenetic stimulation during the trial-based lever press task. Following the RTPP experiment, mice underwent food-restriction and began training. The lever press experiment took place approximately 1 month after the RTPP experiment. Instead of being exposed to the shock protocol, mice were exposed to a 3-epoch stimulation protocol consisting of 1) 16 trials no stim, 2) 16 trials stim, and 3) 16 trials no stim. Here, stimulation was given as 40-Hz 594-nm pulses, starting during the 5 s tone, and terminating either when the animal pressed the lever, or when the lever retracted after 5 s. Mice first underwent mPFC→NAc axon stimulation, and then given a week to establish a stable lever press baseline before mPFC→VTA axon stimulation. The position of the lever relative to the lickspout was counterbalanced across mice.
QUANTIFICATION AND STATISTICAL ANALYSIS
All statistical tests and data analyses were performed using MATLAB and GraphPad Prism. Full details of each statistical test used is described in each figure legend. Significance was defined as p < 0.05. Sample sizes were chosen based on those used in previous papers. For power analyses, G*Power statistics software was used (Faul et al., 2007). For lever pressing optogenetics experiments, post hoc power analysis confirmed that an n-value of 6 mice achieves a power of 0.97 given the measured effect size (1-way ANOVA F test, μ1 = 98.96, μ2 = 86.46, σ = 5; σ estimation of the underlying population based on findings from previous literature (Chen et al., 2013a; Friedman et al., 2015). For RTPP experiments, mice with a baseline preference > 75% for one side were excluded from analysis. In total, 2 mice were excluded from the whole-projection mPFC→NAc RTPP stimulation experiment (Figure 3). Exclusion of these 2 mice did not affect the statistical interpretation of the data (e.g., the same statistical findings held when including these 2 mice).
FIP Ca2+ recording analysis
FIP Ca2+ signals were normalized by subtracting the best-fit reference signal, determined using least-squares regression. Any additional slow changes in fluorescence not captured by the reference normalization were removed using by subtracting the 8th percentile value in a sliding 15 s window (Harvey et al., 2012). The normalized signal was then z-scored. The mean response to reward or shock was calculated by take the difference between the average z-scored data 2 s prior to the lever press, and 2 s after the lever press. Similarly, the mean activity prior to the lever press was calculated as the difference between the average z-scored data 2 to 4 s prior to the lever press and 0 to 2 s prior to the lever press.
2-photon Ca2+ imaging analysis
To analyze Ca2+ imaging data, first, movies were downsampled to 256×256 pixels and motion-corrected using the Fiji plug-in, TurboReg. Motion-corrected movies were then downsampled 3X in time, and the mean image was subtracted from each frame. Individual cell masks were extracted from the downsampled and mean-subtracted movie using a previously published PCA/ICA method (Mukamel et al., 2009) (μ = 0.1, minimum area = 50 pixels2, Gaussian smoothing kernel width = 0.2 pixels, initial threshold = 2 s.d.). Segmented cell masks in each IC were manually inspected, and cell masks extracted from noise or artifacts were discarded. Identified cell masks were applied to the original motion-corrected movies to obtain an average fluorescence timeseries for each cell. To further eliminate cross-talk between segmented cells, the segmentation threshold was iteratively increased by 0.01 s.d. until the area of the cell mask was less than or equal to 25 pixels2. Manual inspection of adjacent cells’ fluorescence timeseries revealed elimination of cross-talk. Slow changes in fluorescence were removed by subtracting the 8th percentile value in a 15 s sliding window (Harvey et al., 2012).
PCA was performed on the entire smoothed, normalized timeseries (Harvey et al., 2012) (pca function in MATLAB using a 2 s smoothing window, and normalized by maximum value of each cell’s timeseries). The data projected onto the first 3 PCs were then plotted for all shock trials and for the reward trials closest to the shock trials, such that there were an equal number of shock and reward trials used for analysis (this was done because there were many fewer shock trials than reward trials). When possible, the reward trial immediately preceding a given shock trial was used. The trajectory selectivity index was calculated as a given trial’s Euclidean distance to the mean shock trajectory minus the distance to the mean reward trajectory, divided by the sum of the distances to the mean shock and reward trajectories. Thus a positive selectivity index indicates the trial is closer to the mean reward trajectory, while a negative selectivity index indicates the trial is closer to the mean shock trajectory. For each trial, mean trajectories were calculated excluding the current trial (leave-one-out cross validation). Trials were classified as “reward” trials if the trajectory selectivity index was positive, and as “shock” trials if the trajectory selectivity index was negative. To calculate significance of the classification accuracy of the total distribution of all shock and reward trials, the trial type labels were shuffled 1,000 times, and the classification accuracy was re-calculated across all trials each shuffle. Trials were combined across all mice in order to generate 1,000 unique shuffled distributions.
To identify lever-, reward-, and shock-cells, the timeseries were subdivided into trials consisting of 2 s prior to and 5 s after each lever press. The concatenated trials for each cell were then correlated to a logical behavioral regressor representing the lever press (equal to “1” during the 1 s following the lever press), the reward (equal to “1” during the 2 s following reward delivery), or the shock (equal to “1” during the 1 s shock). Behavioral regressors were convolved (Miri et al., 2011) with an exponential impulse response function (τ1/2 = 400 ms, as measured for GCaMP6f (Chen et al., 2013b)). Cells were considered lever-, reward-, or shock-cells if they had 1) a significant Pearson’s correlation with the behavioral regressor, and 2) had a Pearson’s correlation coefficient of at least 0.2. The cutoff of 0.2 was used based on visual inspection of timeseries correlated with behavior regressors. Cells that met these criteria for more than one behavior regressor were excluded from analysis.
To identify “missed” and “pressed” cells, the timeseries were subdivided into trials consisting of the entire duration of the 5 s tone preceding each lever extension. Lasso regression (Tibshirani, 1996) was then performed on the concatenated trials using all time points during the tone (lassoglm function in MATLAB). A maximum of 25 cells were extracted in each regularization model, as each session only had 50 trials. The model with the largest λ such that its deviance was within 1 standard error of the minimum deviance was selected. Models were calculated using a binomial response distribution (“1” for time points preceding a missed trial, and “0” for time points preceding a pressed trial), and a 10-fold cross-validation partition. “Missed” cells were identified as those with a positive Lasso regression weight, and “pressed” cells were those with a negative weight. These neurons were then used to fit a new model using linear discriminant analysis (LDA) to classify individual trials as “missed” or “pressed” trials (crossval and classify functions in MATLAB). To fit an LDA model, the Lasso cells’ average activity during each 5 s tone was used as predictors, while the response variables were set to “1” if the animal pressed the lever or “0” if the animal missed the lever following each 5 s tone. The LDA model was calculated using a 5-fold cross-validation partition with 10 Monte Carlo repetitions. To calculate significance of the classification accuracy, the trial type labels were shuffled 1,000 times and the classification accuracy was re-calculated for each mouse.
DATA AND SOFTWARE AVAILABILITY
The accession number for the microarray from Figure 1 examining gene expression differences in mPFC→NAc versus mPFC→VTA neurons is GEO: GSE101185. Optogenetics sequences are freely distributed at https://www.stanford.edu/group/dlab/optogenetics. MATLAB code for analyzing Ca2+ imaging data from mPFC→NAc and mPFC→VTA neurons is available upon request from the Lead Contact, Karl Deisseroth (deissero@stanford.edu).
Supplementary Material
Highlights.
Projections from mPFC exhibit unique molecular and laminar phenotypes
Ca2+ imaging reveals that mPFC → NAc shock neurons encode restraint of reward seeking
vCAPTURE for robust labeling of mPFC → NAc axons active during shock
Stimulating previously active mPFC → NAc shock neurons can reduce reward seeking
Acknowledgments
We thank H. Bito (University of Tokyo, Tokyo, Japan) for the E-SARE plasmid. We thank M. J. Wagner (Stanford University, California) for detailed comments on the manuscript. This work was supported by NIDA (F31DA041795 to C.K.K.; R01DA03537701 to K.D.), NIDDK (K01DK114165 to L.Y.), HHWF (F-1052 to J.H.J.), NIMH (R01MH075957 and R01MH086373 K.D.), and the DARPA/ARL Neuro-FAST program (Cooperative Agreement W911NF-14-2-0013 to K.D.).
Footnotes
SUPPLEMENTAL INFORMATION
Supplemental Information includes seven figures, four tables, and one movie and can be found with this article online at http://dx.doi.org/10.1016/j.cell.2017.07.020.
AUTHOR CONTRIBUTIONS
C.K.K. and K.D. designed the project and wrote the paper with input from all authors. C.K.K. performed all behavioral experiments and surgeries with contributions from L.Y., J.H.J., N.P., D.D.T., and A.-C.W.Y. C.K.K. performed all imaging experiments and data analysis. L.Y. performed CLARITY and light-sheet imaging, performed molecular profiling experiments, and developed the activity-dependent labeling system. N.P., D.D.T., and A.-C.W.Y. performed histology. C.R. designed all constructs for viral packing. K.D. supervised all aspects of the work.
References
- Al-Hasani R, McCall JG, Shin G, Gomez AM, Schmitz GP, Bernardi JM, Pyo CO, Park SI, Marcinkiewcz CM, Crowley NA, et al. Distinct subpopulations of nucleus accumbens dynorphin neurons drive aversion and reward. Neuron. 2015;87:1063–1077. doi: 10.1016/j.neuron.2015.08.019. [DOI] [PMC free article] [PubMed] [Google Scholar]
- Amemori K, Graybiel AM. Localized microstimulation of primate pregenual cingulate cortex induces negative decision-making. Nat Neurosci. 2012;15:776–785. doi: 10.1038/nn.3088. [DOI] [PMC free article] [PubMed] [Google Scholar]
- Bossert JM, Stern AL, Theberge FR, Marchant NJ, Wang HL, Morales M, Shaham Y. Role of projections from ventral medial prefrontal cortex to nucleus accumbens shell in context-induced reinstatement of heroin seeking. J Neurosci. 2012;32:4982–991. doi: 10.1523/JNEUROSCI.0005-12.2012. [DOI] [PMC free article] [PubMed] [Google Scholar]
- Britt JP, Benaliouad F, McDevitt RA, Stuber GD, Wise RA, Bonci A. Synaptic and behavioral profile of multiple glutamatergic inputs to the nucleus accumbens. Neuron. 2012;76:790–803. doi: 10.1016/j.neuron.2012.09.040. [DOI] [PMC free article] [PubMed] [Google Scholar]
- Calipari ES, Bagot RC, Purushothaman I, Davidson TJ, Yorgason JT, Peña CJ, Walker DM, Pirpinias ST, Guise KG, Ramakrishnan C, et al. In vivo imaging identifies temporal signature of D1 and D2 medium spiny neurons in cocaine reward. Proc Natl Acad Sci USA. 2016;113:2726–2731. doi: 10.1073/pnas.1521238113. [DOI] [PMC free article] [PubMed] [Google Scholar]
- Chen BT, Yau HJ, Hatch C, Kusumoto-Yoshida I, Cho SL, Hopf FW, Bonci A. Rescuing cocaine-induced prefrontal cortex hypoactivity prevents compulsive cocaine seeking. Nature. 2013a;496:359–362. doi: 10.1038/nature12024. [DOI] [PubMed] [Google Scholar]
- Chen TW, Wardill TJ, Sun Y, Pulver SR, Renninger SL, Baohan A, Schreiter ER, Kerr RA, Orger MB, Jayaraman V, et al. Ultrasensitive fluorescent proteins for imaging neuronal activity. Nature. 2013b;499:295–300. doi: 10.1038/nature12354. [DOI] [PMC free article] [PubMed] [Google Scholar]
- Chung K, Wallace J, Kim SY, Kalyanasundaram S, Andalman AS, Davidson TJ, Mirzabekov JJ, Zalocusky KA, Mattis J, Denisin AK, et al. Structural and molecular interrogation of intact biological systems. Nature. 2013;497:332–337. doi: 10.1038/nature12107. [DOI] [PMC free article] [PubMed] [Google Scholar]
- Cowan RL, Wilson CJ. Spontaneous firing patterns and axonal projections of single corticostriatal neurons in the rat medial agranular cortex. J Neurophysiol. 1994;71:17–32. doi: 10.1152/jn.1994.71.1.17. [DOI] [PubMed] [Google Scholar]
- Creed M, Pascoli VJ, Lüscher C. Addiction therapy. Refining deep brain stimulation to emulate optogenetic treatment of synaptic pathology. Science. 2015;347:659–664. doi: 10.1126/science.1260776. [DOI] [PubMed] [Google Scholar]
- Cui G, Jun SB, Jin X, Pham MD, Vogel SS, Lovinger DM, Costa RM. Concurrent activation ofstriatal direct and indirect pathways during action initiation. Nature. 2013;494:238–242. doi: 10.1038/nature11846. [DOI] [PMC free article] [PubMed] [Google Scholar]
- DeNardo LA, Berns DS, DeLoach K, Luo L. Connectivity of mouse somatosensory and prefrontal cortex examined with trans-synaptic tracing. Nat Neurosci. 2015;18:1687–1697. doi: 10.1038/nn.4131. [DOI] [PMC free article] [PubMed] [Google Scholar]
- Dombeck DA, Khabbaz AN, Collman F, Adelman TL, Tank DW. Imaging large-scale neural activity with cellular resolution in awake, mobile mice. Neuron. 2007;56:43–57. doi: 10.1016/j.neuron.2007.08.003. [DOI] [PMC free article] [PubMed] [Google Scholar]
- Everitt BJ, Robbins TW. Neural systems of reinforcement for drug addiction: from actions to habits to compulsion. Nat Neurosci. 2005;8:1481–1489. doi: 10.1038/nn1579. [DOI] [PubMed] [Google Scholar]
- Faul F, Erdfelder E, Lang AG, Buchner A. G*Power 3:a flexible statistical power analysis program for the social, behavioral, and biomedical sciences. Behav Res Methods. 2007;39:175–191. doi: 10.3758/bf03193146. [DOI] [PubMed] [Google Scholar]
- Fenno LE, Mattis J, Ramakrishnan C, Hyun M, Lee SY, He M, Tucciarone J, Selimbeyoglu A, Berndt A, Grosenick L, et al. Targeting cells with single vectors using multiple-feature Boolean logic. Nat Methods. 2014;11:763–772. doi: 10.1038/nmeth.2996. [DOI] [PMC free article] [PubMed] [Google Scholar]
- Ferenczi EA, Zalocusky KA, Liston C, Grosenick L, Warden MR, Amatya D, Katovich K, Mehta H, Patenaude B, Ramakrishnan C, et al. Prefrontal cortical regulation of brainwide circuit dynamics and reward-related behavior. Science. 2016;351:aac9698. doi: 10.1126/science.aac9698. [DOI] [PMC free article] [PubMed] [Google Scholar]
- Floresco SB, St Onge JR, Ghods-Sharifi S, Winstanley CA. Cortico-limbic-striatal circuits subserving different forms of cost-benefit decision making. Cogn Affect Behav Neurosci. 2008;8:375–389. doi: 10.3758/CABN.8.4.375. [DOI] [PubMed] [Google Scholar]
- Friedman A, Homma D, Gibb LG, Amemori K, Rubin SJ, Hood AS, Riad MH, Graybiel AM. A corticostriatal path targeting striosomes controls decision-making under conflict. Cell. 2015;161:1320–1333. doi: 10.1016/j.cell.2015.04.049. [DOI] [PMC free article] [PubMed] [Google Scholar]
- Gore F, Schwartz EC, Brangers BC, Aladi S, Stujenske JM, Likhtik E, Russo MJ, Gordon JA, Salzman CD, Axel R. Neural representations of unconditioned stimuli in basolateral amygdala mediate innate and learned responses. Cell. 2015;162:134–145. doi: 10.1016/j.cell.2015.06.027. [DOI] [PMC free article] [PubMed] [Google Scholar]
- Haber SN, Knutson B. The reward circuit: linking primate anatomy and human imaging. Neuropsychopharmacology. 2010;35:4–26. doi: 10.1038/npp.2009.129. [DOI] [PMC free article] [PubMed] [Google Scholar]
- Harvey CD, Coen P, Tank DW. Choice-specific sequences in parietal cortex during a virtual-navigation decision task. Nature. 2012;484:62–68. doi: 10.1038/nature10918. [DOI] [PMC free article] [PubMed] [Google Scholar]
- Hayes DJ, Northoff G. Identifying a network of brain regions involved in aversion-related processing: a cross-species translational investigation. Front Integr Nuerosci. 2011;5:49. doi: 10.3389/fnint.2011.00049. [DOI] [PMC free article] [PubMed] [Google Scholar]
- Hnasko TS, Perez FA, Scouras AD, Stoll EA, Gale SD, Luquet S, Phillips PE, Kremer EJ, Palmiter RD. Cre recombinase-mediated restoration of nigrostriatal dopamine in dopamine-deficient mice reverses hypophagia and bradykinesia. Proc Natl Acad Sci USA. 2006;103:8858–8863. doi: 10.1073/pnas.0603081103. [DOI] [PMC free article] [PubMed] [Google Scholar]
- Jonkman S, Mar AC, Dickinson A, Robbins TW, Everitt BJ. The rat prelimbic cortex mediates inhibitory response control but not the consolidation of instrumental learning. Behav Neurosci. 2009;123:875–885. doi: 10.1037/a0016330. [DOI] [PubMed] [Google Scholar]
- Kawashima T, Kitamura K, Suzuki K, Nonaka M, Kamijo S, Takemoto-Kimura S, Kano M, Okuno H, Ohki K, Bito H. Functional labeling of neurons and their projections using the synthetic activity-dependent promoter E-SARE. Nat Methods. 2013;10:889–895. doi: 10.1038/nmeth.2559. [DOI] [PubMed] [Google Scholar]
- Kim CK, Yang SJ, Pichamoorthy N, Young NP, Kauvar I, Jennings JH, Lerner TN, Berndt A, Lee SY, Ramakrishnan C, et al. Simultaneous fast measurement of circuit dynamics at multiple sites across the mammalian brain. Nat Methods. 2016;13:325–328. doi: 10.1038/nmeth.3770. [DOI] [PMC free article] [PubMed] [Google Scholar]
- Kim EJ, Juavinett AL, Kyubwa EM, Jacobs MW, Callaway EM. Three types of cortical layer 5 neurons that differ in brain-wide connectivity and function. Neuron. 2015;88:1253–1267. doi: 10.1016/j.neuron.2015.11.002. [DOI] [PMC free article] [PubMed] [Google Scholar]
- Kim SY, Adhikari A, Lee SY, Marshel JH, Kim CK, Mallory CS, Lo M, Pak S, Mattis J, Lim BK, et al. Diverging neural pathways assemble a behavioural state from separable features in anxiety. Nature. 2013;496:219–223. doi: 10.1038/nature12018. [DOI] [PMC free article] [PubMed] [Google Scholar]
- Kravitz AV, Tye LD, Kreitzer AC. Distinct roles for direct and indirect pathway striatal neurons in reinforcement. Nat Neurosci. 2012;15:816–818. doi: 10.1038/nn.3100. [DOI] [PMC free article] [PubMed] [Google Scholar]
- Lammel S, Ion DI, Roeper J, Malenka RC. Projection-specific modulation of dopamine neuron synapses by aversive and rewarding stimuli. Neuron. 2011;70:855–862. doi: 10.1016/j.neuron.2011.03.025. [DOI] [PMC free article] [PubMed] [Google Scholar]
- Lammel S, Lim BK, Ran C, Huang KW, Betley MJ, Tye KM, Deisseroth K, Malenka RC. Input-specific control of reward and aversion in the ventral tegmental area. Nature. 2012;491:212–217. doi: 10.1038/nature11527. [DOI] [PMC free article] [PubMed] [Google Scholar]
- Lein ES, Hawrylycz MJ, Ao N, Ayres M, Bensinger A, Bernard A, Boe AF, Boguski MS, Brockway KS, Byrnes EJ, et al. Genome-wide atlas of gene expression in the adult mouse brain. Nature. 2007;445:168–176. doi: 10.1038/nature05453. [DOI] [PubMed] [Google Scholar]
- Lévesque M, Charara A, Gagnon S, Parent A, Deschenes M. Corticostriatal projections from layer V cells in rat are collaterals of long-range corticofugal axons. Brain Res. 1996;709:311–315. doi: 10.1016/0006-8993(95)01333-4. [DOI] [PubMed] [Google Scholar]
- Liu X, Ramirez S, Pang PT, Puryear CB, Govindarajan A, Deisseroth K, Tonegawa S. Optogenetic stimulation of a hippocampal engram activates fear memory recall. Nature. 2012;484:381–385. doi: 10.1038/nature11028. [DOI] [PMC free article] [PubMed] [Google Scholar]
- Lobo MK, Nestler EJ. The striatal balancing act in drug addiction: distinct roles of direct and indirect pathway medium spiny neurons. Front Neuroanat. 2011;5:41. doi: 10.3389/fnana.2011.00041. [DOI] [PMC free article] [PubMed] [Google Scholar]
- Long JZ, Svensson KJ, Tsai L, Zeng X, Roh HC, Kong X, Rao RR, Lou J, Lokurkar I, Baur W, et al. A smooth muscle-like origin for beige adipocytes. Cell Metab. 2014;19:810–820. doi: 10.1016/j.cmet.2014.03.025. [DOI] [PMC free article] [PubMed] [Google Scholar]
- Mayberg HS, Lozano AM, Voon V, McNeely HE, Seminowicz D, Hamani C, Schwalb JM, Kennedy SH. Deep brain stimulation for treatment-resistant depression. Neuron. 2005;45:651–660. doi: 10.1016/j.neuron.2005.02.014. [DOI] [PubMed] [Google Scholar]
- McFarland K, Davidge SB, Lapish CC, Kalivas PW. Limbic and motor circuitry underlying footshock-induced reinstatement of cocaineseeking behavior. J Neurosci. 2004;24:1551–1560. doi: 10.1523/JNEUROSCI.4177-03.2004. [DOI] [PMC free article] [PubMed] [Google Scholar]
- McLaughlin J, See RE. Selective inactivation of the dorsomedial prefrontal cortex and the basolateral amygdala attenuates conditioned-cued reinstatement of extinguished cocaine-seeking behavior in rats. Psychopharmacology (Berl) 2003;168:57–65. doi: 10.1007/s00213-002-1196-x. [DOI] [PubMed] [Google Scholar]
- Miri A, Daie K, Burdine RD, Aksay E, Tank DW. Regression-based identification of behavior-encoding neurons during large-scale optical imaging of neural activity at cellular resolution. J Neurophysiol. 2011;105:964–980. doi: 10.1152/jn.00702.2010. [DOI] [PMC free article] [PubMed] [Google Scholar]
- Mukamel EA, Nimmerjahn A, Schnitzer MJ. Automated analysis of cellular signals from large-scale calcium imaging data. Neuron. 2009;63:747–760. doi: 10.1016/j.neuron.2009.08.009. [DOI] [PMC free article] [PubMed] [Google Scholar]
- Nieh EH, Matthews GA, Allsop SA, Presbrey KN, Leppla CA, Wichmann R, Neve R, Wildes CP, Tye KM. Decoding neural circuits that control compulsive sucrose seeking. Cell. 2015;160:528–541. doi: 10.1016/j.cell.2015.01.003. [DOI] [PMC free article] [PubMed] [Google Scholar]
- St Onge JR, Stopper CM, Zahm DS, Floresco SB. Separate prefrontal-subcortical circuits mediate different components of risk-based decision making. J Neurosci. 2012;32:2886–2899. doi: 10.1523/JNEUROSCI.5625-11.2012. [DOI] [PMC free article] [PubMed] [Google Scholar]
- Orsini CA, Moorman DE, Young JW, Setlow B, Floresco SB. Neural mechanisms regulating different forms of risk-related decision-making: Insights from animal models. Neurosci Biobehav Rev. 2015a;58:147–167. doi: 10.1016/j.neubiorev.2015.04.009. [DOI] [PMC free article] [PubMed] [Google Scholar]
- Orsini CA, Trotta RT, Bizon JL, Setlow B. Dissociable roles for the basolateral amygdala and orbitofrontal cortex in decision-making under risk of punishment. J Neurosci. 2015b;35:1368–1379. doi: 10.1523/JNEUROSCI.3586-14.2015. [DOI] [PMC free article] [PubMed] [Google Scholar]
- Otis JM, Namboodiri VM, Matan AM, Voets ES, Mohorn EP, Kosyk O, McHenry JA, Robinson JE, Resendez SL, Rossi MA, Stuber GD. Prefrontal cortex output circuits guide reward seeking through divergent cue encoding. Nature. 2017;543:103–107. doi: 10.1038/nature21376. [DOI] [PMC free article] [PubMed] [Google Scholar]
- Pascoli V, Terrier J, Espallergues J, Valjent E, O’Connor EC, Lüscher C. Contrasting forms of cocaine-evoked plasticity control components of relapse. Nature. 2014;509:459–464. doi: 10.1038/nature13257. [DOI] [PubMed] [Google Scholar]
- Peters J, Büchel C. Overlapping and distinct neural systems code for subjective value during intertemporal and risky decision making. J Neurosci. 2009;29:15727–15734. doi: 10.1523/JNEUROSCI.3489-09.2009. [DOI] [PMC free article] [PubMed] [Google Scholar]
- Pfarr S, Meinhardt MW, Klee ML, Hansson AC, Vengeliene V, Schönig K, Bartsch D, Hope BT, Spanagel R, Sommer WH. Losing control: excessive alcohol seeking after selective inactivation of cue-responsive neurons in the infralimbic cortex. J Neurosci. 2015;35:10750–10761. doi: 10.1523/JNEUROSCI.0684-15.2015. [DOI] [PMC free article] [PubMed] [Google Scholar]
- Pinto L, Dan Y. Cell-type-specificactivity in prefrontal cortex during goal-directed behavior. Neuron. 2015;87:437–450. doi: 10.1016/j.neuron.2015.06.021. [DOI] [PMC free article] [PubMed] [Google Scholar]
- Qi J, Zhang S, Wang HL, Barker DJ, Miranda-Barrientos J, Morales M. VTA glutamatergic inputs to nucleus accumbens drive aversion by acting on GABAergic interneurons. Nat Neurosci. 2016;19:725–733. doi: 10.1038/nn.4281. [DOI] [PMC free article] [PubMed] [Google Scholar]
- Rajasethupathy P, Sankaran S, Marshel JH, Kim CK, Ferenczi E, Lee SY, Berndt A, Ramakrishnan C, Jaffe A, Lo M, et al. Projections from neocortex mediate top-down control of memory retrieval. Nature. 2015;526:653–659. doi: 10.1038/nature15389. [DOI] [PMC free article] [PubMed] [Google Scholar]
- Reijmers LG, Perkins BL, Matsuo N, Mayford M. Localization of a stable neural correlate of associative memory. Science. 2007;317:1230–1233. doi: 10.1126/science.1143839. [DOI] [PubMed] [Google Scholar]
- Robbins TW, Everitt BJ. Neurobehavioural mechanisms of reward and motivation. Curr Opin Neurobiol. 1996;6:228–236. doi: 10.1016/s0959-4388(96)80077-8. [DOI] [PubMed] [Google Scholar]
- Roy DS, Arons A, Mitchell TI, Pignatelli M, Ryan TJ, Tonegawa S. Memory retrieval by activating engram cells in mouse models of early Alzheimer’s disease. Nature. 2016;531:508–512. doi: 10.1038/nature17172. [DOI] [PMC free article] [PubMed] [Google Scholar]
- Saunders BT, Richard JM, Janak PH. Contemporary approaches to neural circuit manipulation and mapping: focus on reward and addiction. Philos Trans R Soc Lond B Biol Sci. 2015;370:20140210. doi: 10.1098/rstb.2014.0210. [DOI] [PMC free article] [PubMed] [Google Scholar]
- Sørensen AT, Cooper YA, Baratta MV, Weng FJ, Zhang Y, Ramamoorthi K, Fropf R, LaVerriere E, Xue J, Young A, et al. A robust activity marking system for exploring active neuronal ensembles. eLife. 2016;5:e13918. doi: 10.7554/eLife.13918. [DOI] [PMC free article] [PubMed] [Google Scholar]
- Soudais C, Skander N, Kremer EJ. Long-term in vivo transduction of neurons throughout the rat CNS using novel helper-dependent CAV-2 vectors. FASEB J. 2004;18:391–393. doi: 10.1096/fj.03-0438fje. [DOI] [PubMed] [Google Scholar]
- St Onge JR, Floresco SB. Prefrontal cortical contribution to risk-based decision making. Cereb Cortex. 2010;20:1816–1828. doi: 10.1093/cercor/bhp250. [DOI] [PubMed] [Google Scholar]
- Stopper CM, Floresco SB. What’s better for me? Fundamental role for lateral habenula in promoting subjective decision biases. Nat Neurosci. 2014;17:33–35. doi: 10.1038/nn.3587. [DOI] [PMC free article] [PubMed] [Google Scholar]
- Stuber GD, Sparta DR, Stamatakis AM, van Leeuwen WA, Hardjoprajitno JE, Cho S, Tye KM, Kempadoo KA, Zhang F, Deisseroth K, Bonci A. Excitatory transmission from the amygdala to nucleus accumbens facilitates reward seeking. Nature. 2011;475:377–380. doi: 10.1038/nature10194. [DOI] [PMC free article] [PubMed] [Google Scholar]
- Tan KR, Yvon C, Turiault M, Mirzabekov JJ, Doehner J, Labouèbe G, Deisseroth K, Tye KM, Luscher C. GABA neurons of the VTA drive conditioned place aversion. Neuron. 2012;73:1173–1183. doi: 10.1016/j.neuron.2012.02.015. [DOI] [PMC free article] [PubMed] [Google Scholar]
- Tibshirani R. Regression shrinkage and selection via the lasso. J R Stat Soc B. 1996;58:267–288. [Google Scholar]
- Wall NR, De La Parra M, Callaway EM, Kreitzer AC. Differential innervation of direct- and indirect-pathway striatal projection neurons. Neuron. 2013;79:347–360. doi: 10.1016/j.neuron.2013.05.014. [DOI] [PMC free article] [PubMed] [Google Scholar]
- Warren BL, Mendoza MP, Cruz FC, Leao RM, Caprioli D, Rubio FJ, Whitaker LR, McPherson KB, Bossert JM, Shaham Y, Hope BT. Distinct Fos-Expressing neuronal ensembles in the ventromedial prefrontal cortex mediate food reward and extinction memories. J Neurosci. 2016;36:6691–6703. doi: 10.1523/JNEUROSCI.0140-16.2016. [DOI] [PMC free article] [PubMed] [Google Scholar]
- Ye L, Allen WE, Thompson KR, Tian Q, Hsueh B, Ramakrishnan C, Wang AC, Jennings JH, Adhikari A, Halpern CH, et al. Wiring and molecular features of prefrontal ensembles representing distinct experiences. Cell. 2016;165:1776–1788. doi: 10.1016/j.cell.2016.05.010. [DOI] [PMC free article] [PubMed] [Google Scholar]
- Zalocusky KA, Ramakrishnan C, Lerner TN, Davidson TJ, Knutson B, Deisseroth K. Nucleus accumbens D2R cells signal prior outcomes and control risky decision-making. Nature. 2016;531:642–646. doi: 10.1038/nature17400. [DOI] [PMC free article] [PubMed] [Google Scholar]
Associated Data
This section collects any data citations, data availability statements, or supplementary materials included in this article.