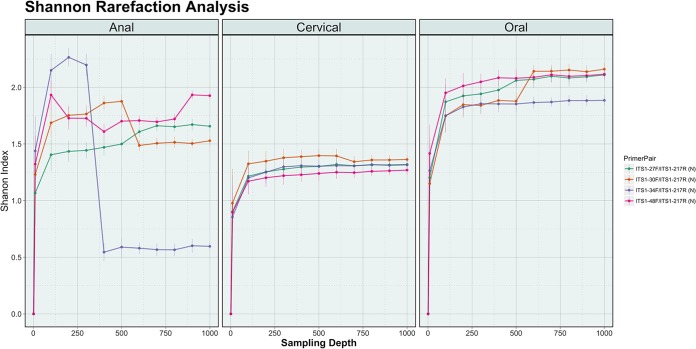
FIG 5 .
Shannon rarefaction analysis. Shown is Shannon alpha rarefaction analysis across three body sites for seven clinical samples using four newly designed primer pairs. Amplified samples were evaluated at depths of 1, 10, 100, 500, and 1,000 reads, with 100 replicates at each subsampling depth. Results for each primer pair with the samples were averaged and plotted by anatomic site. The primer pairs associated with each colored line are indicated in the key to the right of the figure.

