

Abstract
Huntington disease is a neurodegenerative disorder caused by a gene (HTT) with a unique feature of trinucleotide repeats ranging from 10 to 35 in healthy people; when expanded beyond 39 repeats, Huntington disease develops. Animal models demonstrate that HTT is vital to brain development; however, this has not been studied in humans. Moreover, evidence suggests that triplet repeat genes may have been vital in evolution of the human brain.
Here we evaluate brain structure using magnetic resonance imaging and brain function using cognitive tests in a sample of school-aged children ages 6 to 18 years old. DNA samples were processed to quantify the number of CAG repeats within HTT. We find that the number of repeats in HTT, below disease threshold, confers advantageous changes in brain structure and general intelligence (IQ): the higher the number of repeats, the greater the change in brain structure, and the higher the IQ. The pattern of structural brain changes associated with HTT is strikingly different between males and females.
HTT may confer an advantage or a disadvantage depending on the repeat length, playing a key role in either the evolution of a superior human brain or development of a uniquely human brain disease.
Keywords: Huntington disease, intelligence, brain development
INTRODUCTION
The Huntingtin gene (HTT, OMIM 613004) is one of a class of genes that contain a key region of simple sequence repeats (SSRs). The number of repeats typically ranges from 10 to 35. However, when the number of repeats exceeds 39, the fatal neurodegenerative Huntington disease (HD) develops. The discovery of the gene in 1993 stimulated intense research on mutant HTT. In contrast, few studies have investigated the function of wild-type or nonmutant HTT with CAG repeats below the disease threshold (Cattaneo et al., 2005).
Increasing evidence suggests that SSRs play a substantial role in modulating brain development and brain function by regulation of gene expression (Fondon et al., 2008), providing a strong rationale for investigation of normal HTT function. SSRs may play a vital role in evolution (Faux, 2012; Frenkel and Trifonov, 2012; King, 2012) by causing the variability needed to enhance the changes associated with brain development (Hannan, 2010). HTT plays a critical role in brain development (Cattaneo et al., 2005). The high polymorphism in number of repeats below disease threshold suggests that the repeats in wild-type HTT may affect brain structure and function. Evaluation of this hypothesis could shed light not only on the role of HTT in typical development but also on the potential role that it plays in human brain evolution.
Sex commonly and substantially influences many facets of the human brain from ion channels to brain morphology (Cahill, 2014). In particular, the dual role of natural and sexual selection in evolution supports the notion that genes important in the evolution of the human brain would be expected to have sex-specific effects. As one example, microcephaly genes may have had an important role in human brain evolution, with striking sex differences in the relationship between genotype and brain morphology (Rimol et al., 2010; Cahill and Aswad, 2015).
In a study designed to evaluate children (ages 6–18 years) at risk for HD (having a family history of HD) compared with healthy controls, we conducted a comprehensive assessment of the effects of CAG repeat sequence lengths, below disease threshold, on human brain structure and function. Brain structure was measured using magnetic resonance imaging (MRI), and brain function was measured using a comprehensive battery of cognitive assessments in a large group of children who had CAG repeat lengths below disease threshold (15–34 repeats). Focusing on potential sex effects, we examined the relationship between repeat length in HTT and brain structure and function. Our findings show that increasing length of repeat confers advantageous changes in both brain structure and function in a sex-specific manner.
METHODS
Participants
The sample was composed of children at risk for HD, and a healthy control sample. For the children-at-risk sample, adults who had been clinically diagnosed as having HD, or tested gene positive, were asked to enroll their children or grandchildren in the age range of 6 to 18 years for participation. These families came from all over the United States. For this analysis, only at-risk children with CAG repeat lengths below disease threshold (lower than 36) were included. For the healthy control sample, children aged 6 to 18 were recruited from the local community by advertisements. Exclusion criteria for all subjects were history of a major neurologic illness or significant head trauma. The healthy control children were designed to represent a “normal, healthy, sample” and therefore were screened (by interview with a parent) for major medical or psychiatric diagnosis and excluded from participation if either one of those was present. For the children at risk for HD, there were no exclusionary criteria for major medical or psychiatric illness. The healthy control sample was added to permit generalization of the findings beyond the unique and smaller sample of kids at risk for HD. The two samples had comparable sex distribution with 49.2% (67/136) of males in the healthy control sample and 48% (36/75) in the at-risk sample.
Table I displays the demographic and CAG repeat length data for both groups. A total of 211 children (108 females and 103 males) were used for this analysis. As our protocol is longitudinal, several subjects have returned for repeat assessments: in the female group, there were 27 repeat visits (23 subjects had 2 visits and 2 subjects had 3 visits), a total of 135 observations. The mean interval between visits was 22.90 months (SD 8.61). In the male group, there were 20 repeat visits (18 subjects had 2 visits and 1 subject had 3 visits) for a total of 123 observations. The mean interval between visits was 24.9 months (SD 9.94). Combined, the total number of assessments was 258, with data from cognitive assessments. The average age of the female sample (135 observations) was 12.5 (SD 3.6), and the average age of the male sample (123 observations) was 12.6 (SD 3.76). Parental socioeconomic status (SES) was determined by a modified Hollingshead scale (1–5, where lower numbers mean higher SES), with a mean of 2.40 (SD 0.56) for the females and 2.40 (SD 0.60) for the males. Of the 258 assessments, there were 236 in which a good-quality MRI scan was obtained. Reasons for not having an MRI scan were as follows: too much motion artifact (n = 16), refused, or had braces (n = 6).
TABLE I.
Demographics of Sample
| At risk | Healthy controls | Combined at risk and healthy controls
|
||
|---|---|---|---|---|
| Females | Males | |||
| n | n | n | n | |
| Number of individuals | 75 | 136 | 108 | 103 |
| Additional (return) visits | 30 | 17 | 27 | 20 |
| Total observations | 105 | 153 | 135 | 123 |
| Mean (SD) Range | Mean (SD) Range | Mean (SD) Range | Mean (SD) Range | |
|---|---|---|---|---|
| Age (years) | 12.9 (3.8) 6.0–18.9 | 12.3 (3.6) 6.0–18.9 | 12.5 (3.63) 6.0–18.9 | 12.6 (3.76) 6.0–18.9 |
| CAG repeat | 20.6 (4.24) 15–34 | 20.3 (3.99) 15–31 | 20.3 (4.09) 15–31 | 20.5 (4.12) 15–34 |
| Parental SES⋆ | 2.66 (0.66) 2–5 | 2.27 (0.46) 1–3 | 2.40 (0.56) 2–5 | 2.46 (0.60) 2–4 |
Note: Table I displays the demographics of each sample (at risk and healthy control). In addition, measures are broken down by sex for the combined sample.
Parental socioeconomic status (SES) based on a modified Hollingshead scale of 1 to 5 with the higher the number, the lower the status.
Testing for gene expansion was done using genomic DNA from blood or saliva. All analyses were done through the University of Iowa Molecular Diagnostics Laboratory. Size of the CAG repeat region in exon 1 of the HTT gene on chromosome 4p16.3 was determined with PCR analysis of genomic DNA. The CAG repeat length for each subject is determined by comparing the PCR products, which are radiolabeled and separated on denaturing polyacrylamide gels, to sizing standards. By convention, the longer allele is designated as allele1 and the shorter allele as allele2. The longest allele (allele1) acts in a completely dominant fashion in both normal function (Seong et al., 2005) and within disease (Lee et al., 2013). Therefore, all analyses were done using the CAG repeat length from the long allele. The number of CAG repeats in the females averaged 20 (range 15–30) and, for the boys, 21 (range 15–34).
MRI Scans
All MRI scans were obtained on a research-dedicated 3T Siemens Avanto. The protocol acquires multimodal scans consisting of T1- and T2-weighted sequences. Scans were processed through an automated procedure implemented in BRAINS2 (Pierson et al., 2011). A neural net was used to calculate subcortical structures. Cortical reconstruction was performed with FreeSurfer software version 5.1 (available at surfer. nmr.mgh.harvard.edu). Using the FreeSurfer data, cortical surface area and thickness were calculated for cortex as a whole. The weighted average for cortical thickness was calculated by taking the sum of the product of gray matter thickness and surface area and dividing by the total surface area. Brain imaging measures used included intracranial volume (ICV), cerebral cortex thickness, cerebral cortex surface area, cerebral white matter, caudate, putamen, thalamus, and cerebellum. The number of measures used was restricted to minimize multiple comparisons and type II error.
The subcortical structures of caudate, putamen, and thalamus were chosen because these are regions that are particularly affected by HTT in the context of HD.
In addition to analysis on quantitative measures, additional imaging methods were performed to provide visualization of findings and to verify quantitative results with additional methodology: FreeSurfer whole-brain cortical thickness mapping using QDec. As the analyses did not allow for a correction for multiple assessments of the same person, only one observation per subject was used. Using QDec within FreeSurfer, analyses were run evaluating the relationship between CAG repeat length (rank ordered) and cortical thickness using a general linear model controlling for age and parent SES. The color map produced shows a log10(P) where P is the significance, thresholded to show all vertices with P < 0.05.
Cognitive Measurements
General ability index (GAI) was determined by Wechsler Intelligence Scale for Children–4th Edition (Wechsler, 2004) (WISC-IV; for ages 6–16 years) and Wechsler Adult Intelligence Scale, 4th Edition (Wechsler, 2008) (WAIS-IV; for ages 17–18 years). The GAI is a composite of verbal and perceptual domains that was used as an estimate of global cognitive ability. In addition, prorated index scores were obtained for the verbal comprehension index (VCI) using similarities and vocabulary subtests, and for perceptual reasoning index (PRI) using block design and matrix reasoning subtests.
A battery of cognitive tests designed to assess specific areas of skill was administered. To minimize the number of comparisons, skill “domains” were constructed by identifying a group of tests that measured cognitive skill within that domain. For consistency, all scores were first transformed into z scores based on the mean of the group. For evaluation of sex differences, the z scores were based on the mean of the combined group. For the within-group analysis evaluating the effects of CAG repeat length on brain structure and function, the z scores were calculated from the mean of each group (females and males). Then, scores were transformed to ensure that a higher score indicated a better performance (by multiplying the z score times −1 for those scores in which a higher score meant poorer performance). Finally, a composite average of the z scores was calculated to determine the domain score. Tests for the Language domain included the Boston Naming Test (Kaplan et al., 1983) and the Delis-Kaplan Executive Function System (Delis et al., 2001) (D-KEFS), phonemic verbal fluency, and free sorting description. Tests for the Visual–Perceptual domain included the Benton Judgment of Line Orientation Test (Benton et al., 1994) and the Bender Developmental Test of Visual-Motor Integration (Brannigan, 2003). The Executive Function domain comprised scores from the D-KEFS color word interference, verbal fluency switching, and sorting tasks, as well as the Continuous Performance Task (Conners, 2000) (omissions and commissions). Tests that constituted the Memory domain included the Wechsler spatial span (Wechsler, 1997), the Children’s Memory Scale (Cohen, 1997) (dot locations for visual memory, word lists for auditory memory), and the Color Span test (Richman and Lindgren, 1988).
All participants signed informed consent prior to enrolling in the protocol, which was approved by the University of Iowa Institutional Review Board.
Statistical Analysis
Sex differences in brain structure and brain structure–function relationships are robust and well documented. Therefore, we performed all analyses on the combined sample (males and females) as well as separately for males and females. All analyses were performed by using SAS/STAT procedures. The mixed procedure was used to run regression models while accommodating repeated visits to predict quantitative measures of brain structure, general intelligence, and skill domain scores (dependent variables) based on CAG length (independent variable). The distribution of CAG repeat number was significantly skewed to the right (Shapiro-Wilk < 0.001) and therefore was transformed to rank scores for normalization and to limit the influence of outlying CAG values. A mixed model was used to control for the correlation between repeat visits of the same individual. In addition, age and parental SES were controlled for because of their impact on growth as well as brain structure and function. As volumes and surface area are highly correlated to ICV, all volume and surface area measures analyses also controlled for ICV. Domain scores of Language, Visual–Perceptual, Executive Function, and Memory were highly correlated with GAI. Therefore, the mixed model of these measures also controlled for GAI to assess the specific effect of sex or CAG repeat length above and beyond that contributed by general intellect. A two-tailed alpha level of 0.05 was used for significance tests.
The HTT allele with the longest CAG repeat has been shown to be fully dominant in both normal function below disease threshold as well as above disease threshold. Our analysis was done using first the allele with the longest CAG repeat length; however, we repeated the analysis evaluating the effects of the shorter allele as well.
To elaborate on the significant findings, additional analyses were done to (1) calculate variance explained, (2) evaluate structure/function relationships, and (3) conduct a median split-group comparison. Estimates of the variance explained by repeat length were calculated by the R2 multiplied by 100, expressed as a percentage. The R2 was calculated to be the proportion of variance accounted for by the regressors in the model, calculated using the residual variance of the full model (Vfull) and the residual variance of the model with no regressors (Vnull) (Selya et al., 2012):
To evaluate whether specific areas of brain structure were related to specific brain function, the same methods of mixed-model linear regressions were conducted. This analysis was restricted only to those measures of brain structure and brain function that were significantly predicted by CAG length.
To create a visual representation of the regression analysis, each of the two samples (female and male) was split into a “High”- and a “Low”-repeat-length group based on the median repeat length of the group (median repeat length for both sexes = 19). Only the measures shown to have a significant association with repeat length were analyzed. The z scores of each measure were calculated, and the High and Low group were compared using the mixed-model analysis accounting for repeat visits, controlling for age and parental SES.
RESULTS
Table I displays the study participants’ demographic information. The female and male samples were similar in age, repeat length, and parental SES as both groups were on average 12 years of age and had a mean CAG repeat length of 20. Histograms of the frequencies of CAG repeat length for the female and the male sample are shown in Figure 1. For both groups, the distribution had most of the values in the low end (15–20), which then tapered off with fewer subjects filling out the rest of the range (up to 31 for females and up to 34 for the males).
Fig. 1.
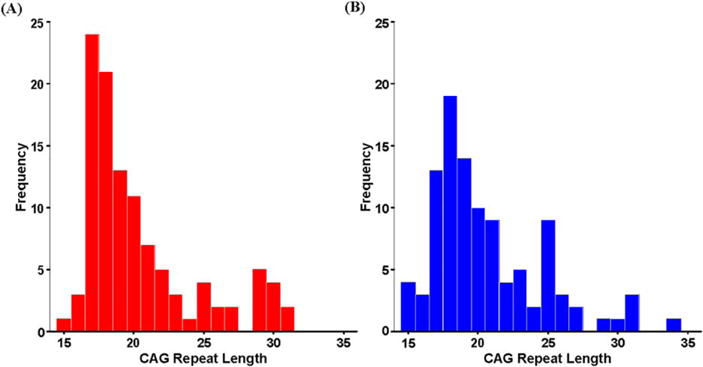
Frequency distribution. Number of participants (y axis) for each of the CAG repeat lengths (x axis) in the (A) female and (B) male participants.
Effects of Repeat Length on Brain
The relationship between repeat length and measures of brain structure and function is displayed in Table II. In the female sample, repeat length was strongly predictive of cerebral cortex thickness: the higher the number of repeats, the thicker the cortex. However, repeat length did not significantly relate to cortical surface area. Whole-brain mapping of correlations between repeat length and cortical thickness permitted investigation as to whether the effect of CAG repeat length on thickness was generalized or regionally specific. Figure 2 shows the map of these correlations for the female sample that are positive (the higher the CAG, the thicker the cortex). The effect is spread throughout the cerebrum.
TABLE II.
Results of Analysis of Brain Function Measures and Brain Structure Measures Predicted by CAG Repeat Length, Long Allele
| Brain structure measures | Girls: length of CAG repeat
|
Boys: length of CAG repeat
|
Sex⋆CAG repeat interaction
|
|||
|---|---|---|---|---|---|---|
| β (SE) | P | β (SE) | P | β (SE) | P | |
| ICV (cc) | 0.239 (0.281) | 0.397 | 0.078 (0.376) | 0.835 | −0.100 (0.230) | 0.666 |
| Total gray matter | 0.056 (0.061) | 0.358 | 0.079 (0.075) | 0.296 | 0.006 (0.047) | 0.903 |
| Total white matter | −0.054 (0.072) | 0.464 | −0.133 (0.078) | 0.093 | −0.041 (0.053) | 0.439 |
| Cortical thickness (mm) | 0.899 × 10⁻³ (2.17 × 10⁻⁴) | < 0.001 | −0.450 × 10⁻³ (3.26 × 10⁻⁴) | 0.187 | −0.680 × 10⁻³ (1.89 × 10⁻⁴) | < 0.001 |
| Cortical surface area (cm2) | 0.019 (0.184) | 0.919 | 0.045 (0.185) | 0.811 | −0.015 (0.132) | 0.909 |
| Cerebellum (cc) | −0.030 (0.073) | 0.689 | 0.079 (0.031) | 0.013 | 0.048 (0.019) | 0.014 |
| Subcortical (cc) | 0.012 (0.004) | 0.015 | −0.003 (0.005) | 0.522 | −0.008 (0.003) | 0.024 |
| Caudate | 2.57 × 10⁻³ (0.002) | 0.200 | −0.110 × 10⁻³ (0.002) | 0.961 | −0.001 (0.001) | 0.389 |
| Putamen | 3.98 × 10⁻³ (0.002) | 0.051 | −6.09 × 10⁻³ (0.002) | 0.044 | −0.005 (0.001) | 0.008 |
| Thalamus | 4.77 × 10⁻³ (0.002) | 0.054 | 1.51 × 10⁻³ (0.002) | 0.604 | −0.002 (0.001) | 0.307 |
| Brain function measures | β (SE) | P | β (SE) | P | β (SE) | P |
|---|---|---|---|---|---|---|
| GAI | 0.071 (0.034) | 0.045 | 0.032 (0.041) | 0.441 | −0.019 (0.026) | 0.470 |
| VCI | 0.067 (0.032) | 0.044 | 0.039 (0.040) | 0.337 | −0.016 (0.025) | 0.547 |
| PRI | 0.062 (0.035) | 0.083 | 0.024 (0.041) | 0.571 | −0.019 (0.027) | 0.473 |
| Language | 0.428 × 10⁻³ (0.001) | 0.685 | 0.229 × 10⁻³ (0.001) | 0.871 | −0.700 × 10⁻³ (0.001) | 0.514 |
| Visual-Perceptual | −1.24 × 10⁻³ (0.001) | 0.377 | 2.01 × 10⁻³ (0.001) | 0.260 | 1.29 × 10⁻³ (0.001) | 0.243 |
| Executive | −0.420 × 10⁻³ (0.001) | 0.714 | −0.080 × 10⁻³ (0.001) | 0.955 | −0.440 × 10⁻³ (0.001) | 0.611 |
| Memory | −1.99 × 10⁻³ (0.001) | 0.154 | 1.176 × 10⁻³ (0.001) | 0.430 | −1.50 × 10⁻³ (0.001) | 0.140 |
Analysis controlled for age and parental SES for all variables. For regional brain variables (everything but ICV), ICV was controlled for to account for global size differences. For cognitive domain scores (Language, Visual–Perceptual, Executive, and Memory), GAI was controlled for to account for general intellect. Subcortical volume is the sum of caudate + putamen + thalamus volume. GAI indicates general intelligence index; ICV, intracranial volume; PRI, perceptual reasoning index; SES, socioeconomic status; VCI, verbal comprehension index.
Fig. 2.
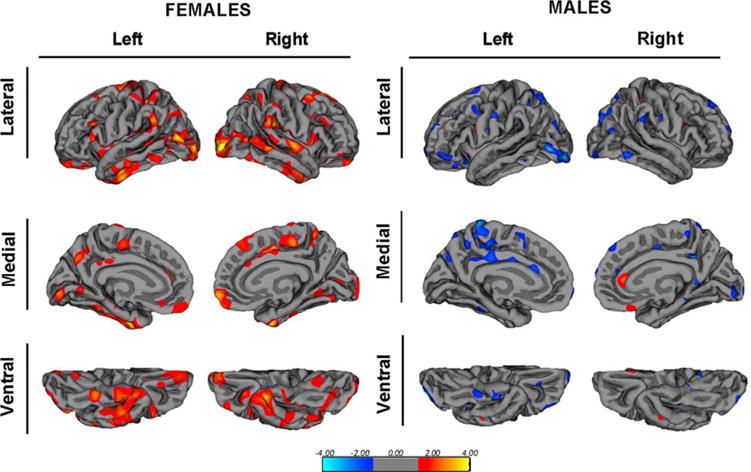
Cortical thickness mapping. Whole-brain mapping of the relationship between CAG repeat length and cortical thickness in the female sample and the male sample. The maps are of log10(P) where P is the significance, thresholded to showing all vertices with P < 0.05. Red and yellow indicate thicker cortex as repeat increases, and blue indicates thinner cortex as repeat length increases.
Allele length was also predictive of the combined subcortical measure (sum of caudate, putamen, and thalamus), with longer repeats associated with a larger volume. When evaluating each region, all three had positive coefficients, though none reached statistical significance on its own (putamen P = 0.051, thalamus P = 0.054), suggesting a more generalized effect on these structures rather than an effect on one specific region.
In the female sample, repeat length significantly predicted intellect measures of GAI and the GAI subcomponent of VCI, such that longer repeat lengths were associated with higher scores (Table II). After controlling for GAI, repeat length showed no relationship to any of the cognitive domain scores, suggesting that the effect of CAG repeat is to raise global function (IQ) but not any specific cognitive domain.
For the male sample, the pattern of findings was quite different. Longer repeats in males did not relate to cortical thickness as it did in the females. Table II shows that the estimated β value for the relationship between repeat length and cortical thickness is negative although not statistically significant. This is illustrated in Figure 2: whole-brain mapping correlations with repeat length showed fewer relationships in the males, and when present, they were most often in the opposite direction (higher CAG repeats associated with thinner cortex).
In males, CAG repeat length was related to a unique pattern of lower putamen volumes but higher cerebellar volumes. The striatum and the cerebellum have both parallel and integrated circuits connecting to the cortex (Bostan and Strick, 2010; Bostan et al., 2010). Given this relationship, these circuits may interact in growth and development to create a balanced circuit. To investigate this possibility, a simple ratio of putamen to cerebellum volume was used to determine whether their relative structure—not individual morphology—has the strongest relationship with repeat length. The results show that the effect of CAG repeat on the ratio of putamen to cerebellum volume was much stronger (β = −8.00 × 10⁻⁵, SE = 2.50 × 10⁻⁵, P = 0.002) than the relationship to the putamen or the cerebellum alone (see Table II). Higher repeat lengths predict lower ratio values, which can be obtained by decreasing putamen size, increasing cerebellum size, or both.
With regard to the functional measures, repeat length did not significantly predict any functional measure in the male sample (see Table II).
In the far right column of Table II are the results of the combined group analysis in which sex-by-CAG-length interaction was evaluated. All brain regions significantly affected by CAG repeat length also had a sex-specific significant interaction.
With regard to brain function measures, there were no significant sex-by-repeat-length interactions (Table II). Although the gene effect on general intellect measures was significant in the females, the effect of repeat length on these measures in males was also in a positive direction, but much weaker. Thus, although the effect in females is significant while the effect in males is not, the gene effect may not be restricted to females. Combining females and males, the gene effect remains significant (β = 0.026, SE = 0.013, P = 0.050).
Figure 3 shows scatter plots of the main findings (effects of CAG repeat on GAI, cortical thickness, and putamen/cerebellum ratio), illustrating the regression lines separately for males and females.
Fig. 3.
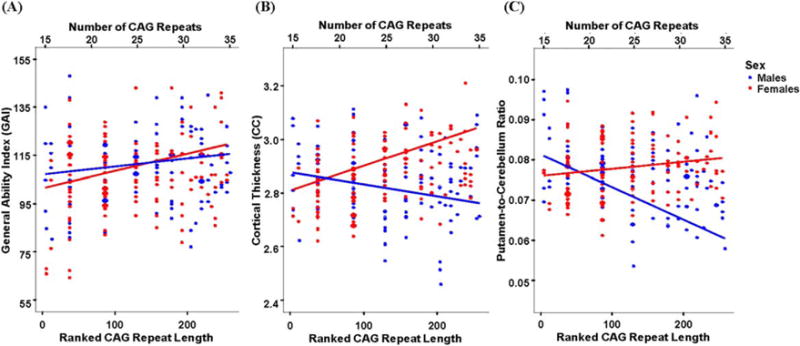
Scatter plots detailing the relationship between the CAG repeat length and (A) general ability index (GAI), (B) cortical thickness, and (C) putamen-to-cerebellum ratio in males (blue) and females (red). The fitted lines map the effect of rank transformed CAG repeat length (corrected for age, parental social class, and individual random effect) depicted against the raw data points. The corresponding absolute value of the CAG repeats are marked on the top part of each plot.
Median Split-Group Analysis
Figure 4 displays the results of the median split-group analysis where the combined sample (males and females together) was split into two groups based on median CAG repeat length and designated as the High group and Low group. This median split was also done separately for the males and females. Measures significantly predicted by repeat length were compared across the two groups for the combined group and for each sex. In the whole sample, the High group had significantly higher GAI scores than the Low group. For the females, the High group compared with the Low group had larger cortical thickness. The subcortical volume also may be larger in the High group compared with the Low group; however, this did not reach statistical significance. In males, the High group had larger cerebellum and lower putamen/cerebellum ratio measures compared with the Low group.
Fig. 4.
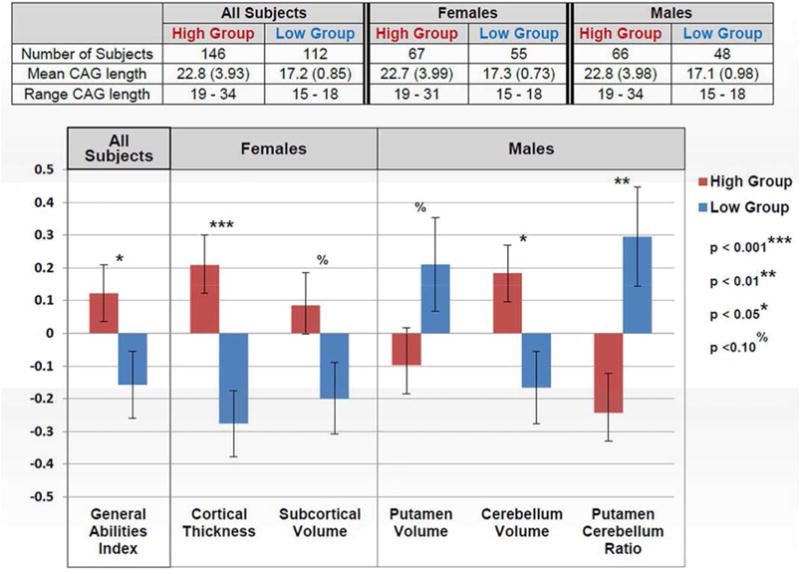
Results of the median split-group analysis. All measures are converted to z scores based on the mean of the group. The mixed-group regression analysis was used to compare the z scores between the High and Low groups, accounting for return visits. Additional measures controlled for included age and SES (all analyses), sex (all-subjects analysis), and intracranial volume (for subcortical volume measures). Error bars mark the standard errors.
Variance Explained
Table IIIA displays the relative size of the effect of the genotype as described by the percentage of variance explained. In females, the number of repeats explained 13.3% of the variance in cortical thickness. For the remaining brain regions (subcortical tissue) and the functional measures, the variance explained by repeats was less robust with repeats accounting for 5.2% of the variance in subcortical volume and 1.6% of the variance in GAI. For males, the most significant result was the putamen/cerebellum ratio, in which length of CAG repeat accounted for 9.5% of the variance of that measure, which was much higher than the variance explained by repeats of each of the volumes of putamen (2.0%) or cerebellum (5.9%) alone.
TABLE IIIA.
Variance Explained by Repeat Length
| Females | Variance explained (%) |
|---|---|
| Cortical thickness (mm)⋆ | 13.3 |
| Subcortical tissue (cc)† | 5.2 |
| General abilities index | 1.6 |
| Males | Variance explained (%) |
|---|---|
| Putamen volume (cc)† | 2.0 |
| Cerebellum volume (cc)† | 5.9 |
| Putamen/cerebellum ratio⋆ | 9.5 |
Structure and Function Relationship
Table IIIB displays the results of the structure/function analysis in which the areas of the brain that are affected by repeats are assessed to see whether they predict the functional measures affected by CAG repeat length (general intellect). For females, repeat length was related to thicker cortex. In addition, thicker cortex predicted superior measures of GAI. In males, the putamen and cerebellum volumes were not related to GAI. However, the ratio of putamen to cerebellum predicted GAI scores such that the lower the ratio, the higher the CAG.
TABLE IIIB.
Relationship between Brain Structure and Brain Function
| Females | General abilities index
|
|
|---|---|---|
| (SE) | P | |
| Cortical thickness (mm)⋆ | 44.49 (12.39) | 0.001 |
| Subcortical tissue (cc)† | 1.01 (o.74) | 0.173 |
| Males | ||
|---|---|---|
| Putamen volume (cc)† | −2.30 (1.51) | 0.132 |
| Cerebellum volume (cc)† | 0.17 (0.14) | 0.231 |
| Putamen/cerebellum ratio⋆ | −423.87 (177.91) | 0.019 |
Controlling for age, parental SES
Controlling for age, parental SES, and ICV.
ICV indicates intracranial volume; SES, socioeconomic status.
Dominant Function of the Longest Allele
All of the analyses were repeated assessing the relationship between each measure and the repeat length of the shorter HTT allele (see Table IV). For both males and females, the length of the shorter allele did not significantly predict any brain structure or function measure, with one exception. In females, the short allele repeat lengths predicted total gray matter volume (β = 0.139, SE = 0.058, P = 0.019). This effect was the same as that seen with the longer allele, and in the same direction, though the effect with the longer allele was not as strong. Despite the one exception, a lack of findings is supportive of previous work showing that in both normal (Seong et al., 2005) and abnormal function (Lee et al., 2013), HTT behaves in a dominant fashion.
TABLE IV.
Results of Analysis of Brain Function Measures and Brain Structure Measures Predicted by CAG Repeat Length, Short Allele
| Brain structure measures | Girls: length of CAG repeat
|
Boys: length of CAG repeat
|
||
|---|---|---|---|---|
| β (SE) | P | β (SE) | P | |
| ICV (cc) | −0.021 (0.302) | 0.943 | 0.197 (0.356) | 0.589 |
| Total gray matter | 0.139 (0.058) | 0.019 | 0.044 (0.075) | 0.557 |
| Total white matter | −0.075 (0.078) | 0.339 | −0.022 (0.080) | 0.782 |
| Cortical thickness (mm) | 0.272 × 10⁻³ (0.257 × 10⁻⁴) | 0.292 | 0.416 × 10⁻³ (3.33 × 10⁻⁴) | 0.216 |
| Cortical surface area (cm2) | 0.019 (0.184) | 0.919 | −0.153 (0.189) | 0.420 |
| Cerebellum (cc) | −0.030 (0.073) | 0.689 | 0.079 (0.031) | 0.013 |
| Subcortical (cc) | 6.560 × 10⁻³ (0.005) | 0.215 | −0.870 × 10⁻³ (0.005) | 0.871 |
| Caudate | 0.111 × 10⁻³ (0.002) | 0.557 | −0.154 × 10⁻³ (0.002) | 0.521 |
| Putamen | 0.127 × 10⁻³ (0.002) | 0.557 | 0.204 × 10⁻³ (0.002) | 0.049 |
| Thalamus | 0.405 × 10⁻³ (0.002) | 0.136 | 0.943 × 10⁻⁴ (0.002) | 0.751 |
| Brain function measures | β (SE) | P | β (SE) | P |
|---|---|---|---|---|
| GAI | 0.029 (0.038) | 0.445 | −0.049 (0.042) | 0.247 |
| VCI | 0.047 (0.036) | 0.190 | −0.040 (0.042) | 0.343 |
| PRI | 0.005 (0.039) | 0.889 | −0.043 (0.041) | 0.305 |
| Language | 0.400 × 10⁻³ (0.001) | 0.725 | 0.229 × 10⁻³ (0.001) | 0.871 |
| Visual-Perceptual | 0.579 × 10⁻³ (0.001) | 0.700 | 2.01 × 10⁻² (0.001) | 0.260 |
| Executive | −0.141 × 10⁻³ (0.001) | 0.258 | −0.080 × 10⁻³ (0.001) | 0.955 |
| Memory | −0.130 × 10⁻³ (0.001) | 0.380 | 1.176 × 10⁻³ (0.001) | 0.430 |
Note: Analysis controlled for age and parental SES for all variables. For regional brain variables (everything but ICV), ICV was controlled for to account for global size differences. Volumetric brain variables are measured in cubic centimeters. For cognitive domain scores (Language, Visual–Perceptual, Executive, and Memory), GAI was controlled for to account for general intellect. Yellow highlight is the only significant finding, with longer repeats of the short allele predicting greater total gray matter in females. GAI indicates general intelligence index; ICV, intracranial volume; PRI, perceptual reasoning index; SES, socioeconomic status; VCI, verbal comprehension index.
DISCUSSION
The current findings demonstrate that increasing numbers within the normal range of triplet repeats in HTT confer advantageous changes in the structure and function of the developing human brain. More repeats appear to sculpt the morphology of specific brain regions, and these structural changes directly relate to superior function.
Although nonpathogenic SSR polymorphism (repeats below disease threshold) contributes to behavior in a variety of animals (Fondon et al., 2008), few studies have evaluated HTT repeats in the normal range. One previous study reported that higher repeat numbers were related to increased gray matter within the pallidum in a sample of MRI scans of normal subjects, though sex effects were not evaluated (Muhlau et al., 2012). The current study is an important addition to a relatively new area of research into this particular gene, exploring its role in both normal and pathologic processes.
The notion that intelligence has a strong genetic influence has been known for nearly a century (Plomin and Deary, 2015). In fact, general intelligence (IQ) is considered to be one of the most heritable behavioral traits in humans (Plomin et al., 2008). Yet today, despite the advances in technology, no studies have identified and replicated any gene, or gene variant, that significantly relates to intellect (Chabris et al., 2012). Using a genome-wide association study (GWAS), a recent report showed gene variants related to educational attainment (a proxy for general intelligence). Yet, the effect sizes are small, with findings accounting for roughly 0.02% of the variance (Rietveld et al., 2013). Results from the current study stand in sharp contrast as the polymorphism of repeat within the HTT gene was significantly related to general intelligence. Repeat length in our female sample accounted for approximately 1.6% of the variance. Although clearly a host of other factors are related to IQ, the effect size reported here is nearly 80 times that recently reported for the genetic-variants SNPs in a GWAS study (Rietveld et al., 2013).
Even more robust were our findings of the effect of genotype on brain structure. In a recent study evaluating a sample of 30,717 individuals with MRI scans and DNA samples, several genetic variants were related to various structures, the strongest being the putamen (Hibar et al., 2015). Four SNPs were significant, though with small effect sizes, accounting for an average of 0.27% of the variance in volume of the putamen. In our male sample, the effect of repeat length accounted for 2.0% of the variance in volume of the putamen, 7.4 times greater than the variance accounted for by the recent GWAS genotype findings. These findings suggest that evaluating the effects of SSRs may be an important new direction for the study of the effects of genes on the normal developing brain.
The molecular mechanism by which increasing HTT repeats could translate into variability in function may be related to subtle changes in the way HTT creates multiprotein complex formations (Cattaneo et al., 2005). PolyQ tracts in proteins stabilize protein interactions, most likely through conformational changes facilitated by the tract (Schaefer et al., 2012). In HTT specifically, the polyQ tract can form a flexible domain of the protein, allowing the flanking domains to come into close spatial proximity. This may provide a mechanism by which expanded CAG repeats (> 39) would produce a “rusty hinge” and therefore be nonfunctional (Caron et al., 2013). Extending this phenomenon, it is possible that below disease threshold, the number of repeats manifest in increasingly greater flexibility with a point of optimal intramolecular proximity, conformation, and function of the protein. Figure 5 is a representation of this concept.
Fig. 5.
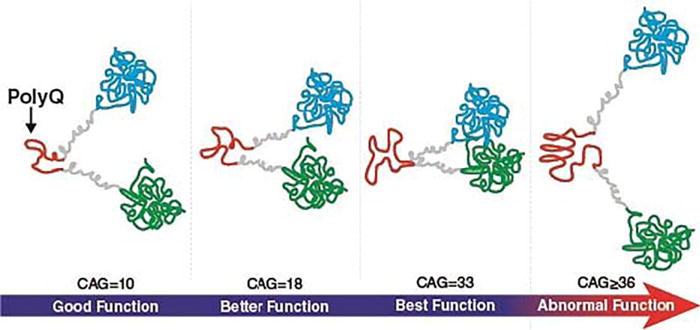
Possible mechanism of improved function of HTT. PolyQ may act as a flexible hinge where longer length confers increasing optimization of protein conformation. Above disease threshold (CAG ≥ 36), polyQ may act as a rusty hinge creating a nonfunctional conformation. Based, in part, on Caron et al. (2013).
Changes in brain structure mediated by HTT below disease threshold are likely to be relevant to the changes we see above disease threshold in HD. The areas identified here (cortex, subcortical structures, cerebellum) have been highlighted as having a critical role in the changes seen both presymptomatically (referred to as pre-HD) and after motor diagnosis. Imaging studies evaluating the cortex in pre-HD subjects have detected cortical thinning years prior to onset (Nopoulos et al., 2010). Other studies have shown the cortex to be thicker in pre-HD subjects compared with controls (Nopoulos et al., 2007). This is also supported by an HD animal model study that showed an inverse relationship between striatal volume and cortical thickness, indicating that thickening may be compensatory (Lerch et al., 2008). The volume of the caudate and putamen has been shown to be the most powerful biomarker for prediction of motor signs of the disease (Paulsen et al., 2014). Although the cerebellum is not commonly reported as being structurally abnormal in pre-HD subjects, a recent report documented abnormal cortico-cerebellar connectivity in patients with early-manifest HD (Wolf et al., 2015).
The strong sex differences in the effects of HTT recapitulate Darwin’s theory of evolution, which he claimed to proceed through two separate mechanisms: natural selection (based on whether the organism survived) and sexual selection (based on whether the organism procreated). In his second book, The Descent of Man and Selection in Relation to Sex, Darwin explained the importance and power of sexual selection (Darwin, 1875). This process, acting on males compared with other males, and females compared with other females, is excellent support for how the complex sex differences seen in the human brain evolved. Moreover, it may help to explain the effects seen here in which, in the process of human brain evolution, HTT may have exerted sex-specific changes.
The idea that triplet repeats are a prolific source of genetic variation has been a growing area of research for the past two decades (King, 2012). In the case of HTT, work by Cattaneo et al. demonstrated that phylogenetic comparison of HTT homologues reveals the appearance of repeats first in deuterostomes, and the repeats then increase—the more complex the organism’s nervous system, the greater the number of repeats, with humans having the highest number (Tartari et al., 2008). The findings of this study suggest that this gene, and possibly others like it, may have played an instrumental role in the evolution from primate to human brain. This is in juxtaposition to the fact that this same gene, when the repeats are too long, results in degenerative brain disease. Therefore, triplet repeat genes may well have a simultaneous advantage and disadvantage, with the advantage being the driving force behind the evolution of a complex and superior brain, and disadvantage being a uniquely human brain disease.
SIGNIFICANCE.
Huntington disease is a neurodegenerative disorder caused by a gene with trinucleotide repeats ranging from 10 to 35 in healthy people; when expanded beyond 39 repeats, Huntington disease develops. We evaluated a sample of children, showing that the number of repeats in this gene, below disease threshold, confers advantageous changes: higher repeats are associated with sex-specific structural brain changes and higher IQ. Genes with DNA repeats are theorized to be positively selected in human evolution. Therefore, this gene may have a simultaneous advantage and disadvantage: a role in the evolution of a superior human brain, yet the disadvantage of a uniquely human brain disease.
Acknowledgments
The authors wish to acknowledge Eric Axelson for his technical assistance in (BRAINS2 and FreeSurfer) MRI processing (and neuroimage figure compilation). We thank Sonia Slevinski for her long-term administrative commitment and for her assistance in subject assessment.
This study was supported by the National Institutes of Neurologic Disorders and Stroke (NINDS) grant R01 NS055903, the National Center for Advancing Translational Sciences (NCATS) grant 1U54TR001356-01, the University of Iowa Clinical and Translational Science Award, and the CHDI Foundation.
ROLE OF AUTHORS
J.L. assessed subjects, maintained the database, performed statistical analysis, and was the primary author of manuscript. Y.D. assisted with data management and statistical analysis. A.C. was involved in protocol development, assessment of subjects, and statistical analysis. E.C. provided crucial insight into the aims of the study and interpretation of results. E.E. and K.M. were involved in protocol development and assessment of subjects. P.G. provided interpretation of analyses. L.C. provided guidance and expertise in sex differences. V.M. developed the MRI sequence protocol and image processing. R.K. performed statistical analysis and image processing. B.S. and J.P. were involved in developing study aims, and interpretation of results. J.D. was the lead statistician. P.N. provided oversight of protocol and scientific design. All authors discussed the results and commented on the manuscript.
Footnotes
CONFLICT OF INTEREST STATEMENT
There are no identified conflicts for any author.
References
- Benton A, Sivan A, Hamsher K, Varney N, Spreen O. Contributions to neuropsychology assessment: a clinical manual. New York (NY): Oxford University Press; 1994. [Google Scholar]
- Bostan AC, Strick PL. The cerebellum and basal ganglia are interconnected. Neuropsychol Rev. 2010;20:261–270. doi: 10.1007/s11065-010-9143-9. [DOI] [PMC free article] [PubMed] [Google Scholar]
- Bostan AC, Dum RP, Strick PL. The basal ganglia communicate with the cerebellum. Proc Natl Acad Sci USA. 2010;107:8452–8456. doi: 10.1073/pnas.1000496107. [DOI] [PMC free article] [PubMed] [Google Scholar]
- Brannigan G. Bender visual-motor gestalt test. 2nd. Itasca (IL): Riverside Publishing; 2003. [Google Scholar]
- Cahill L. Equal ≠ the same: sex differences in the human brain. Cerebrum. 2014;2014:5. [PMC free article] [PubMed] [Google Scholar]
- Cahill L, Aswad D. Sex influences on the brain: an issue whose time has come. Neuron. 2015;88:1084–1085. doi: 10.1016/j.neuron.2015.11.021. [DOI] [PubMed] [Google Scholar]
- Caron NS, Desmond CR, Xia J, Truant R. Polyglutamine domain flexibility mediates the proximity between flanking sequences in huntingtin. Proc Natl Acad Sci USA. 2013;110:14610–14615. doi: 10.1073/pnas.1301342110. [DOI] [PMC free article] [PubMed] [Google Scholar]
- Cattaneo E, Zuccato C, Tartari M. Normal huntingtin function: an alternative approach to Huntington’s disease. Nat Rev Neurosci. 2005;6:919–930. doi: 10.1038/nrn1806. [DOI] [PubMed] [Google Scholar]
- Chabris CF, Hebert BM, Benjamin DJ, Beauchamp J, Cesarini D, van der Loos M, Johannesson M, Magnusson PK, Lichtenstein P, Atwood CS, et al. Most reported genetic associations with general intelligence are probably false positives. Psychol Sci. 2012;23:1314–1323. doi: 10.1177/0956797611435528. [DOI] [PMC free article] [PubMed] [Google Scholar]
- Cohen MJ. Administration manual. San Antonio (TX): The Psychological Corporation; 1997. Children’s memory scale. [Google Scholar]
- Conners CK. Conners’ continuous performance test II: computer program for Windows technical guide and software manual. North Tonawanda (NY): Multi-Health Systems; 2000. [Google Scholar]
- Darwin C. Descent of man and selection in relation to sex. London (UK): John Murray; 1875. [Google Scholar]
- Delis D, Kaplan E, Kramer JH. Delis-Kaplan executive function system (D- KEFS) San Antonio (TX): The Psychological Corporation; 2001. [Google Scholar]
- Faux N. Single amino acid and trinucleotide repeats: function and evolution. Adv Exp Med Biol. 2012;769:26–40. doi: 10.1007/978-1-4614-5434-2_3. [DOI] [PubMed] [Google Scholar]
- Fondon JW, 3rd, Hammock EA, Hannan AJ, King DG. Simple sequence repeats: genetic modulators of brain function and behavior. Trends Neurosci. 2008;31:328–334. doi: 10.1016/j.tins.2008.03.006. [DOI] [PubMed] [Google Scholar]
- Frenkel ZM, Trifonov EN. Origin and evolution of genes and genomes. Crucial role of triplet expansions. J Biomol Struct Dyn. 2012;30:201–210. doi: 10.1080/07391102.2012.677771. [DOI] [PubMed] [Google Scholar]
- Hannan AJ. TRPing up the genome: tandem repeat polymorphisms as dynamic sources of genetic variability in health and disease. Discov Med. 2010;10:314–321. [PubMed] [Google Scholar]
- Hibar DP, Stein JL, Renteria ME, Arias-Vasquez A, Desrivieres S, Jahanshad N, Toro R, Wittfeld K, Abramovic L, Andersson M, et al. Common genetic variants influence human subcortical brain structures. Nature. 2015;520:224–229. doi: 10.1038/nature14101. [DOI] [PMC free article] [PubMed] [Google Scholar]
- Kaplan E, Goodglass H, Weintraub S. Boston naming test. Philadelphia (PA): Lea & Febiger; 1983. [Google Scholar]
- King DG. Evolution of simple sequence repeats as mutable sites. Adv Exp Med Biol. 2012;769:10–25. doi: 10.1007/978-1-4614-5434-2_2. [DOI] [PubMed] [Google Scholar]
- Lee JM, Galkina EI, Levantovsky RM, Fossale E, Anderson MA, Gillis T, Mysore JS, Coser KR, Shioda T, Zhang B, et al. Dominant effects of the Huntington’s disease HTT CAG repeat length are captured in gene-expression data sets by a continuous analysis mathematical modeling strategy. Hum Mol Genet. 2013;22:3227–3238. doi: 10.1093/hmg/ddt176. [DOI] [PMC free article] [PubMed] [Google Scholar]
- Lerch JP, Carroll JB, Spring S, Bertram LN, Schwab C, Hayden MR, Henkelman RM. Automated deformation analysis in the YAC128 Huntington disease mouse model. Neuroimage. 2008;39:32–39. doi: 10.1016/j.neuroimage.2007.08.033. [DOI] [PubMed] [Google Scholar]
- Muhlau M, Winkelmann J, Rujescu D, Giegling I, Koutsouleris N, Gaser C, Arsic M, Weindl A, Reiser M, Meisenzahl EM. Variation within the Huntington’s disease gene influences normal brain structure. PLoS One. 2012;7:e29809. doi: 10.1371/journal.pone.0029809. [DOI] [PMC free article] [PubMed] [Google Scholar]
- Nopoulos P, Magnotta VA, Mikos A, Paulson H, Andreasen NC, Paulsen JS. Morphology of the cerebral cortex in preclinical Huntington’s disease. Am J Psychiatry. 2007;164:1428–1434. doi: 10.1176/appi.ajp.2007.06081266. [DOI] [PubMed] [Google Scholar]
- Nopoulos PC, Aylward EH, Ross CA, Johnson HJ, Magnotta VA, Juhl AR, Pierson RK, Mills J, Langbehn DR, Paulsen JS, PREDICT-HD Investigators Coordinators of Huntington Study Group (HSG) Cerebral cortex structure in prodromal Huntington disease. Neurobiol Dis. 2010;40:544–554. doi: 10.1016/j.nbd.2010.07.014. [DOI] [PMC free article] [PubMed] [Google Scholar]
- Paulsen JS, Long JD, Johnson HJ, Aylward EH, Ross CA, Williams JK, Nance MA, Erwin CJ, Westervelt HJ, Harrington DL, et al. PREDICT-HD Investigators and Coordinators of the Huntington Study Group Clinical and biomarker changes in premanifest Huntington disease show trial feasibility: a decade of the PREDICT-HD study. Front Aging Neurosci. 2014;6:78. doi: 10.3389/fnagi.2014.00078. [DOI] [PMC free article] [PubMed] [Google Scholar]
- Pierson R, Johnson H, Harris G, Keefe H, Paulsen JS, Andreasen NC, Magnotta VA. Fully automated analysis using BRAINS: Auto-Workup. Neuroimage. 2011;54:328–336. doi: 10.1016/j.neuroimage.2010.06.047. [DOI] [PMC free article] [PubMed] [Google Scholar]
- Plomin R, Deary IJ. Genetics and intelligence differences: five special findings. Mol Psychiatry. 2015;20:98–108. doi: 10.1038/mp.2014.105. [DOI] [PMC free article] [PubMed] [Google Scholar]
- Plomin R, McClearn GE, McGiffin P, DeFried J. Behavioral genetics. New York (NY): Worth; 2008. [Google Scholar]
- Richman L, Lindgren S. Color span test manual. Iowa City (IA): Educational Assessment Marketing Service; 1988. [Google Scholar]
- Rietveld CA, Medland SE, Derringer J, Yang J, Esko T, Martin NW, Westra HJ, Shakhbazov K, Abdellaoui A, Agrawal A, et al. GWAS of 126,559 individuals identifies genetic variants associated with educational attainment. Science. 2013;340:1467–1471. doi: 10.1126/science.1235488. [DOI] [PMC free article] [PubMed] [Google Scholar]
- Rimol LM, Agartz I, Djurovic S, Brown AA, Roddey JC, Kahler AK, Mattingsdal M, Athanasiu L, Joyner AH, Schork NJ, et al. Alzheimer’s Disease Neuroimaging Initiative Sex-dependent association of common variants of microcephaly genes with brain structure. Proc Natl Acad Sci USA. 2010;107:384–388. doi: 10.1073/pnas.0908454107. [DOI] [PMC free article] [PubMed] [Google Scholar]
- Schaefer MH, Wanker EE, Andrade-Navarro MA. Evolution and function of CAG/polyglutamine repeats in protein-protein interaction networks. Nucleic Acids Res. 2012;40:4273–4287. doi: 10.1093/nar/gks011. [DOI] [PMC free article] [PubMed] [Google Scholar]
- Selya AS, Rose JS, Dierker LC, Hedeker D, Mermelstein RJ. A practical guide to calculating Cohen’s f(2), a measure of local effect size, from PROC MIXED. Front Psychol. 2012;3:111. doi: 10.3389/fpsyg.2012.00111. [DOI] [PMC free article] [PubMed] [Google Scholar]
- Seong IS, Ivanova E, Lee JM, Choo YS, Fossale E, Anderson M, Gusella JF, Laramie JM, Myers RH, Lesort M, et al. HD CAG repeat implicates a dominant property of huntingtin in mitochondrial energy metabolism. Hum Mol Genet. 2005;14:2871–2880. doi: 10.1093/hmg/ddi319. [DOI] [PubMed] [Google Scholar]
- Tartari M, Gissi C, Lo Sardo V, Zuccato C, Picardi E, Pesole G, Cattaneo E. Phylogenetic comparison of huntingtin homologues reveals the appearance of a primitive polyQ in sea urchin. Mol Biol Evol. 2008;25:330–338. doi: 10.1093/molbev/msm258. [DOI] [PubMed] [Google Scholar]
- Wechsler D. Wechsler memory scale–III. San Antonio (TX): The Psychological Corporation; 1997. [Google Scholar]
- Wechsler D. Wechsler intelligence scale for children, 4th edition– integrated: technical and interpretive manual. San Antonio (TX): PsychCorp; 2004. [Google Scholar]
- Wechsler D. Wechsler adult intelligence scale–4th edition (WAIS-IV) San Antonio (TX): PsychCorp; 2008. [Google Scholar]
- Wolf RC, Thomann PA, Sambataro F, Wolf ND, Vasic N, Landwehrmeyer GB, Sussmuth SD, Orth M. Abnormal cerebellar volume and corticocerebellar dysfunction in early manifest Huntington’s disease. J Neurol. 2015;262:859–869. doi: 10.1007/s00415-015-7642-6. [DOI] [PubMed] [Google Scholar]