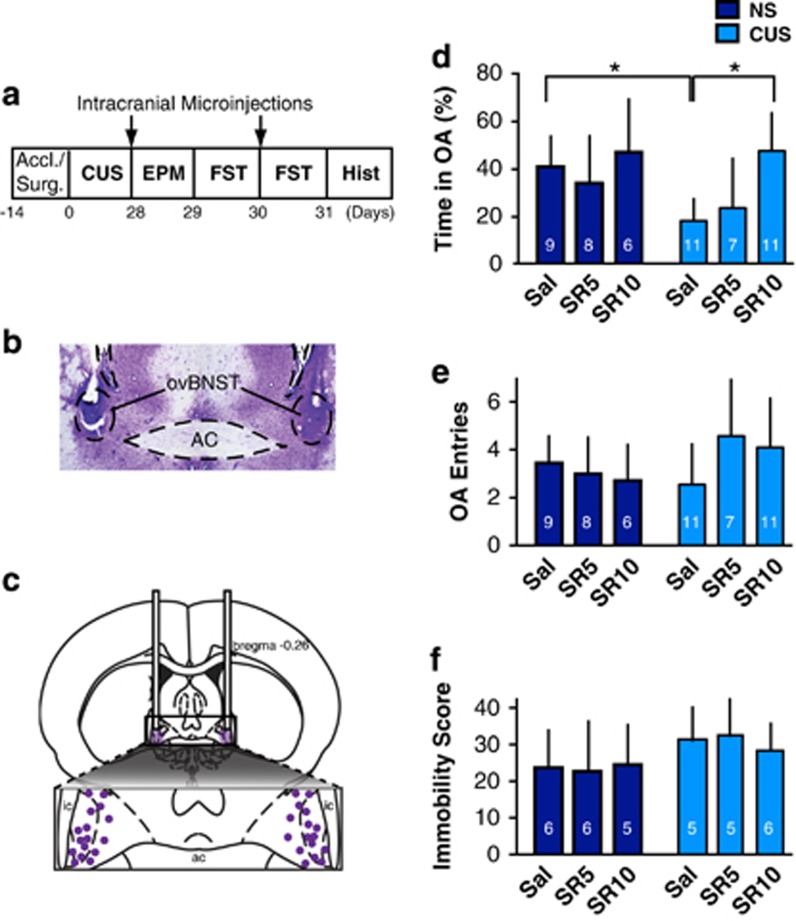
Figure 5.
Effect of intra-ovBNST NTR pharmacological blockade on elevated plus maze (EPM) and forced swim test (FST) behaviors in NS and CUS rats. (a) Experimental timeline. (b) Photomicrograph showing a representative accurate bilateral cannula placement. (c) Drawing showing all intracranial cannula placements. (d) Bar graph representing the percentage of time spent in the EPM open arms (OA) across experimental groups. (e) Bar graph representing the number of OA entry across experimental groups. (f) Bar graph representing immobility scores in the FST across experimental groups. Accl./Surg., acclimatation/surgeries; Hist, histology; Sal, saline; SR5, SR 142948 (5 μM); SR 10, SR-142948 (10 μM). *p<0.05.

