

Abstract
Background
Alcohol craving, defined as the subjective experience of an urge or desire to use alcohol, has been identified in numerous settings as a significant predictor of alcohol use and alcohol relapse following treatment for alcohol use disorders. Yet, numerous limitations to the conceptualization and measurement of drinking temptation has led many researchers to question whether self-reported drinking temptation is a useful construct for evaluating treatments for alcohol use disorders.
Methods
Secondary analyses of data from Project MATCH, a multisite randomized clinical trial, were conducted to examine the association between a single item measure of self-reported “temptation to drink” and drinking outcomes. The first goal was to determine whether temptation to drink changed during the course of treatment for alcohol dependence. The second goal was to assess the predictive validity of temptation to drink, assessed during the fourth session of treatment, as a predictor of past 30 day drinking rates and past 90 day drinking-related consequences at one year and three years following treatment.
Results
The temptation to drink decreased significantly during treatment and self-reported temptation to drink during the fourth session of treatment was significantly associated with numerous drinking outcomes (including quantity, frequency, and consequences) at one year post-treatment (R2 = 0.04 to 0.11), and number of drinks per drinking day at three years following treatment (R2 = 0.02). A dichotomous measure of temptation to drink (not at all tempted versus all other levels of temptation) had greater sensitivity as a predictor of drinking outcomes at one-year and three-years post treatment than alternative drinking measures (e.g., any drinking, any heavy drinking days) assessed during treatment.
Conclusions
A single item measure of temptation to drink was a reasonable predictor of short- and long-term drinking outcomes following treatment and comparable to commonly used measures of drinking outcomes for alcohol clinical trials.
Keywords: craving, drinking temptation, alcohol use disorder, relapse, treatment
Introduction
Alcohol craving is one of the strongest predictors of alcohol relapse to emerge in both pre-clinical and clinical research studies on alcohol dependence (Anton, 1999; Breese et al., 2011; Drummond, 2001; Marlatt, 1978; Sinha and O’Malley, 1999). Many of the promising pharmacotherapies and the most effective psychotherapies for addiction have focused on reducing or managing alcohol craving (Leggio et al., 2010; O’Brien, 2005). The association between craving and alcohol use disorders has been so strongly supported in empirical research that the revision of the Diagnostic and Statistical Manual for Mental Disorders (American Psychiatric Association, 2000) may incorporate craving as one of the diagnostic criteria for alcohol use disorders (de Bruijn et al., 2005; Keyes et al., 2011). The International Classification of Diseases (ICD-10) currently includes “A strong desire or sense of compulsion to drink” as a diagnostic criterion for alcohol dependence (World Health Organization, 1992).
Researchers, clinicians and patients generally agree that “craving” is an important feature in the maintenance of heavy drinking and in the precipitation of drinking lapses following treatment. Yet, conceptual definitions of craving vary widely (Anton, 1999; Potgieter et al., 1999; Rosenberg, 2009; Skinner and Aubin, 2010; Tiffany et al., 2000) and there has been controversy over the measurement and utility of the craving construct (Abrams, 2000; Drummond, 2001; Sayette et al., 2000). Neurobiological, physiological, affective, cognitive, and behavioral models of craving exist and each model has its own set of definitions for the term “craving.” Despite the ongoing debate about the operationalization of craving (Skinner and Aubin, 2010), there is a growing literature supporting the concept of craving as an important treatment target for individuals with alcohol use disorders (Addolorato et al., 2005a; Anton, 1999; Oslin et al., 2009; Tiffany et al., 2012).
Based on the extant literature craving has largely been defined as a multidimensional construct (Addolorato et al., 2005b; Kavanagh et al., 2009; Potgieter et al., 1999; Raabe et al., 2005), with a considerable focus on developing “objective” measures of craving (Drummond et al., 2000). For example, physiological and neurobiological responses to substance cues or stressors are commonly employed as measures of cue reactivity (Addolorato et al., 2005b; Goudriaan et al., 2010; Heinz et al., 2009; Sinha et al., 2009). From the cognitive perspective researchers have attempted to understand craving using tests of attentional bias and implicit attitudes (Field et al., 2008; Garland et al., 2012; Schoenmakers and Wiers, 2010). Yet the question of whether these “objective” measures can take the place of self-report measures has been debated (Rosenberg, 2009). Importantly the antecedents of craving may be less important than the patient’s own experience of craving and drinking temptation, especially considering the variety of triggers that can elicit the desire or temptation to drink. The experience of temptation to drink could also be reflective of greater dysfunction in reward circuitry, which may make an individual more susceptible to relapse (Kühn and Gallinat, 2011). Thus, the client’s own report of drinking temptation during an intervention could be an important factor in understanding the client’s potential for alcohol relapse.
The strong association between subjective craving during treatment and post-treatment drinking outcomes has been supported in several recent studies (e.g., Higley et al., 2011; Oslin et al., 2011; Schmidt et al., 2011; Sinha et al., 2011; Witkiewitz et al., 2011). Higley and colleagues (2011) recently found that self-reported stress-induced craving in the laboratory significantly predicted shorter time to first drink, more drinks per week, and lower abstinence rates following 12-weeks of outpatient treatment for alcohol dependence. Self-reported alcohol craving in response to stress and alcohol cues (Sinha et al., 2011) or in the absence of any alcohol cues (Oslin et al., 2011) has also been shown to predict a shorter time to alcohol relapse 3- and 6-months following residential treatment, respectively. Schmidt and colleagues (2011) found that a multidimensional craving scale predicted treatment outcomes up to two years following residential treatment for alcohol dependence. Yet few studies have examined changes in craving during treatment or whether craving predicts longer term drinking outcomes following outpatient treatment.
Importantly, the multidimensional craving scales and laboratory assessments of craving used in prior studies may not be feasible for most clinical settings. Thus, research is needed on whether brief self-report measures of craving can be useful for predicting clinical outcomes following alcohol treatment. The goal of the current study was to examine a single item measure of “temptation to drink” assessed during treatment as a predictor of drinking rates and drinking-related consequences at one year and three years following treatment using data from Project MATCH, a multisite randomized clinical trial for alcohol dependence. I was specifically interested in whether changes in temptation to drink occurred during treatment and how well temptation to drink predicted both short- and long-term drinking outcomes following treatment. Finally I compared the overall accuracy, sensitivity, and specificity of self-reported temptation to drink in predicting short- and long-term categorical drinking outcomes in comparison to two commonly employed endpoints in alcohol clinical trials (no drinking days and no heavy drinking days; see Falk et al., 2010).
Materials and Methods
The data for the current study is from the outpatient sample of the multi-site, randomized clinical trial of alcohol treatment matching, known as “Matching Alcoholism Treatments to Client Heterogeneity” (Project MATCH Research Group 1993). The trial recruited 1,726 participants with alcohol use disorders and randomly assigned them to three individually delivered treatments: (a) Cognitive-Behavioral Therapy (CBT; Kadden et al., 1992)), (b) Motivational Enhancement Therapy (MET; Miller et al., 1992), and (c) Twelve-Step Facilitation (TSF; Nowinski et al., 1992). Project MATCH recruited from nine clinical research sites across the United States and consisted of two independent arms of investigation, referred to as the “outpatient” and “aftercare” arms. In the outpatient arm (n = 952), participants were recruited from the community or outpatient treatment centers. In the aftercare arm (n =774), participants were recruited from intensive day hospital or inpatient treatment centers. The outpatient arm completed follow-up assessments up to one year and three years following treatment, whereas the aftercare arm only completed follow-up assessments up to one year following treatment. Given the focus on one and three year outcomes in the current study, only the data from the outpatient arm were analyzed.
Upon meeting inclusion and exclusion criteria, participants were given an intake diagnostic evaluation, which consisted of: (a) demographic history; (b) alcohol, drug, and psychotic screen sections of the Structured Clinical Interview for DSM-III-R (Spitzer and Williams, 1985); (c) estimates of alcohol consumption via the Form 90 (Miller and Del Boca, 1994); (d) legal, psychiatric, and family history sections of the Addiction Severity Index (McLellan et al., 1992); and (e) measures of mood disorders, sociopathy, and social support. After providing informed consent and completing intake assessments, participants were then randomized to one of three treatments (CBT, MET, and TSF). Follow-up assessments were conducted immediately post-treatment, 6-, 9-, 12-, 15-, and 39-months after the first therapy session (i.e., 3-, 6-, 9-, 12-, and 36-months following treatment). A comprehensive list of all assessments can be found in previous Project MATCH publications (Project MATCH Research Group, 1993; 1997; 1998). For the current study, measures were used from assessments during the three months of treatment, one year following treatment, and three years following treatment. Measures relevant to the current study are described below.
Measures
The reliability and validity of the measures used in Project MATCH were adequate (see Project MATCH Research Group, 1997; Connors et al., 1994). Self-reported drinking data were corroborated via collateral informants and biochemical measures.
Temptation to drink
One item assessed at every MATCH treatment session was used as an indicator of temptation to drink in the current study. Specifically clients were asked at each session: “Overall, how tempted to drink have you been during this past week? on a scale of 1 (“Not at all”) to 5 (“Extremely”). Data on this item were available from at least one session for 894 individuals in the outpatient sample (92.4% of total sample; 98.1% of those individuals who attended at least one treatment session). The consistency of the temptation to drink item over time was α= 0.90 (whereby each assessment of the item was included in the calculation providing an estimate of the variance/covariance in the item across administrations of the item). There was good stability of adjacent session temptation ratings (correlations between adjacent session ratings ranged from 0.42 to 0.71). The intraclass correlation of the temptation to drink item assessed across time was 0.46, indicating that 46% of the variance in temptation to drink was attributable to differences across participants. Across sessions the rate of missing data ranged from 6.9% during the first session to 30.9% at the last session. Missing treatment session record data were not significantly associated with MATCH treatment assignment, gender, age, alcohol dependence symptoms, or baseline measures of drinking frequency, quantity, and drinking-related consequences.
Drinking outcomes
Drinks per drinking day (DDD), percent drinking days (PDD), percent heavy drinking days (PHD), percent of subjects with no drinking days (ANYDD), and percent of subjects with no heavy drinking days (ANYHDD) were assessed using the Form-90 (Miller and Del Boca, 1994). The primary goal of the Form-90 interview is to gather information regarding a person’s drinking behavior over a three month (90 day) period using a calendar method, such that data can be summarized weekly or monthly during the assessment window. For the current study, I used drinking in the prior 30 days at each assessment to define each of the outcome measures. Heavy drinking was defined as more than five standard drinks per occasion for men and more than four standard drinks per occasion for women.
The Drinker Inventory of Consequences (DrInC; Miller et al., 1995) was used to assess consequences experienced from drinking in the last three months. The DrInC is a self-report measure that asks the respondent to report on a 4-point Likert-type scale (0 = never, 3 = daily) how frequently they have experienced each of 50 drinking consequences, with higher DrInC scores indicating more consequences. The DrInC was treated as continuous for the majority of analyses and for the sensitivity/specificity analyses the approach of Cisler and Zweben (1999) was used to divide DrInC scores into “no alcohol problems” (subjects reporting “never” or “once or a few times” for any consequence item) and “with alcohol problems” (subjects reporting “once or twice a week” or “daily or almost daily” for any consequence item).
Missing drinking data were not significantly associated with MATCH treatment assignment, gender, age, alcohol dependence symptoms, or baseline measures of drinking frequency, quantity, and drinking-related consequences.
Statistical Analyses
For the current study, I had three primary analytic aims: (1) to assess whether changes in temptation to drink occurred during treatment; (2) to examine the association between self-reported temptation to drink and both short- and long-term drinking outcomes (including PDD, DDD, PHD, and DrInC scores) following treatment; and (3) to estimate the overall accuracy, sensitivity, and specificity of self-reported temptation to drink during treatment, as compared to ANYDD and ANYHDD during the last month of treatment, in predicting categorical drinking outcomes (including ANYDD, ANYHDD, and drinking-related consequences) at the 12-month and three year follow-ups.
To assess changes in temptation to drink over time during treatment I estimated a latent growth curve model using Mplus version 6.1 (Muthén and Muthén, 2010). The parameters derived from a latent growth model provide information about the average level of temptation to drink (mean intercept) and the average change in temptation to drink over time (mean slope), as well as the individual variance around the intercept and slope. All models were estimated using maximum likelihood estimation, which provides the estimated variance-covariance matrix for the available data and is a preferred method for estimation when some data are missing, assuming the data are missing at random (Schafer and Graham, 2002). Attrition analyses revealed no significant differences on any baseline study variables between those with missing data and those with complete data. Model fit was evaluated based on recommended cutoffs (Hu and Bentler, 1999) using non-significant χ2, Root Mean Square Error of Approximation (RMSEA < 0.06) and the Comparative Fit Index (CFI > 0.95).
Next, linear regression models were used to examine the strength and direction of the association between temptation to drink during treatment and drinking outcomes (including PDD, DDD, PHD, DrInC scores, ANYDD, ANYHDD, and the DrInC composite) following treatment. First, the association between temptation to drink and drinking outcomes was examined without additional covariates. Next, temptation to drink was examined together with drinking covariates, to determine whether temptation to drink predicted unique variance above and beyond the variance explained by the analagous variables assessed during treatment (e.g., PDD during treatment predicting PDD at one year).
Finally, I used binary classification tests (Altman and Bland, 1994) to estimate the overall accuracy, sensitivity (i.e., true positive rate), and specificity (i.e., true negative rate) of self-reported temptation to drink in predicting short and long term categorical drinking outcomes (including ANYDD, ANYHDD, and DrInC composite) in comparison to two commonly employed binary endpoints in alcohol clinical trials (ANYDD and ANYHDD). For the binary classification tests (and no other analyses described above) the rating scale for the temptation item was dichotomized at the lowest level (“Not at all tempted”) versus all other levels (“a little tempted” to “extremely tempted”). To create the binary ANYDD and ANYHDD items I coded any drinking days and any heavy drinking days during the last month of treatment, respectively, as a “hit” (Falk et al., 2010).
Sensitivity represents the proportion of individuals who were positive on the outcome (e.g., heavy drinking), given a positive score on the predictor (e.g., tempted to drink). Specificity is the proportion of individuals who were not positive on the outcome (e.g., no heavy drinking days), given a negative result on the predictor (e.g., not tempted to drink). The overall accuracy is the proportion of correct results within the sample. While sensitivity, specificity, and overall accuracy are sample specific they do provide an estimate of how well a given variable might predict short- and long-term outcomes and can be particularly useful for comparing across different “diagnostic tests.”
Missing data is often prevalent in longitudinal studies. While the maximum likelihood approach being used in the latent growth curve and regression models uses all available outcome data, the predictor variables in the linear regression models and binary classification tests are not incorporated into the estimation and missing values are excluded. Thus for all regression and classification analyses, missing data needed to be excluded, imputed, or estimated. For both the temptation to drink and the ANYDD and ANYHDD outcomes I used four methods for handling missing data in separate analyses. First, a “complete case” analysis was done whereby all individuals who provided any of the treatment session data (n = 894) and Form 90 drinking day during treatment (n = 930) in the outpatient arm were examined. Next, three separate methods for imputing missing data were then conducted based on prior research: last observation carried forward (LOCF), missing equals the worst case scenario (e.g., heavy drinking), and multiple imputation. For the LOCF models, the last observed score on each temptation to drink item or drinking day was treated as the final score/drinking day using a last observation carried forward approach to the missing data. For the worst case models, any missing data were treated as having the worst possible outcome on that measure. For the PDA, PHD, ANYDD, and ANYHDD variables I recoded each missing drinking day as a drinking day (PDA. ANYDD) or a heavy drinking day (PHD, ANYHDD). For the DDD and DrInC variables I recoded each missing drinking day and DrInC assessment to the baseline levels of DDD and DrInC. For the temptation to drink items I recoded each missing temptation to drink assessment as “extremely tempted.” For the mutiple imputation models I generated 20 datasets using Bayesian estimation to impute a range of plausible values for each missing value. The imputation values for the 20 datasets were then averaged within the analysis model.
For the complete case analyses I used the temptation to drink item assessed during the fourth session for both practical and clinical reasons. First, the MET participants in Project MATCH only received a maximum of four sessions. Second, using a specific session (rather than last observation carried forward or as treated, which would be varying numbers of sessions across individuals) was also clinically intuitive, given that it represents a known quantity that can be consistently measured across client populations (i.e., temptation to drink in the fourth session of an intervention).
Results
Descriptive statistics for the drinking outcomes at each time-point are provided in Table 1. In comparison to baseline levels, all drinking outcomes were greatly improved by the end of treatment through the three year follow-up. At baseline the participants consumed 11.30 drinks per drinking day and nearly everyone (99.7%) had at least one heavy drinking day in the month prior to treatment. By the end of treatment, the participants were drinking fewer than 5.0 drinks per drinking day and fewer than half (46.8%) had at least one heavy drinking day.
Table 1.
Descriptive Statistics for Drinking Outcome Measures for Total Sample
| Baseline M (SD) | End of Treatment M (SD) | 1 YR Post M (SD) | 3 YR Post M (SD) | |
|---|---|---|---|---|
| % drinking days (past 30 days) | n =952 | n =923 | n =871 | n =806 |
| 65.45 (30.43) | 19.92 (30.22) | 27.58 (34.86) | 30.77 (36.07) | |
| % heavy drinking days (past 30 days) | n =952 | n =923 | n =867 | n =806 |
| 57.28 (31.29) | 13.97 (25.27) | 18.55 (29.40) | 19.53 (30.22) | |
| Drinks per drinking day (past 30 days) | n =952 | n =923 | n =871 | n =806 |
| 11.30 (7.36) | 4.36 (6.18) | 5.10 (6.23) | 4.10 (5.08) | |
| DrInC (past 90 days) | n =871 | n =601 | n =544 | n =558 |
| 44.22 (20.95) | 32.89 (24.46) | 28.09 (22.77) | 33.25 (24.89) | |
|
| ||||
| Baseline % | End of Treatment % | 1 YR Post % | 3 YR Post % | |
| Any drinking days (past 30 days) | n =952 | n =923 | n =867 | n =806 |
| 100% | 59.4% | 61.5% | 70.6% | |
| Any heavy drinking (past 30 days) | n =952 | n =923 | n =871 | n =806 |
| 99.7% | 46.8% | 49.7% | 59.3% | |
| Alcohol problems (past 90 days) | n =871 | n =601 | n =544 | n =558 |
| 99.8% | 76.2% | 69.7% | 88.4% | |
Note. DrInC = continuous Drinker Inventory of Consequences score. Alcohol problems = composite derived from the DrInC based on the experience of drinking consequences.
Observed Temptation to Drink
Table 2 provides the frequencies of each response of the temptation to drink item for each session of treatment. At the first treatment session more than 42% of the sample reported they were “considerably” or “extremely” tempted to drink in the past week and only 10% were “not at all tempted.” After eight sessions fewer than 15% of the sample reported they were “considerably” or “extremely” tempted to drink and more than two-thirds were “not at all” or “a little” tempted to drink in the past week. The majority of the analyses described below are based on the self-reported temptation to drink in the fourth session during which 23.5% of the sample reported they were “considerably” or “extremely” tempted to drink and more than half were “not at all” or “a little” tempted to drink in the past week.
Table 2.
Descriptive Statistics for “How Tempted to Drink in Past Week?” Item During Treatment
| n | Mean (SD) | Not at all | A little | Somewhat | Considerably | Extremely | |
|---|---|---|---|---|---|---|---|
| Session 1 | 852 | 3.22 (1.23) | 10.3% | 18.4% | 27.6% | 25.8% | 17.8% |
| Session 2 | 821 | 2.99 (1.23) | 12.9% | 23.8% | 29.1% | 20.3% | 13.9% |
| Session 3 | 736 | 2.76 (1.22) | 16.3% | 30.8% | 23.9% | 18.9% | 10.1% |
| Session 4 | 680 | 2.56 (1.23) | 22.6% | 30.9% | 22.9% | 15.0% | 8.5% |
| Session 5 | 465 | 2.58 (1.24) | 19.6% | 36.6% | 20.0% | 13.5% | 10.3% |
| Session 6 | 428 | 2.54 (1.17) | 19.4% | 37.1% | 19.9% | 17.3% | 6.3% |
| Session 7 | 406 | 2.41 (1.23) | 27.8% | 30.8% | 21.2% | 12.6% | 7.6% |
| Session 8 | 380 | 2.41 (1.22) | 27.6% | 31.3% | 20.8% | 13.4% | 6.8% |
| Session 9 | 345 | 2.20 (1.16) | 34.8% | 30.4% | 19.7% | 10.4% | 4.6% |
| Session 10 | 306 | 2.22 (1.15) | 32.0% | 33.7% | 19.9% | 8.8% | 5.6% |
| Session 11 | 245 | 2.07 (0.99) | 32.7% | 39.6% | 18.4% | 7.3% | 2.0% |
| Session 12 | 159 | 2.04 (1.05) | 35.2% | 39.6% | 13.8% | 8.2% | 3.1% |
Note. Participants who received Motivation Enhancement Therapy (n = 316) only received four sessions of treatment, thus explaining the large drop in subjects from session 4 to session 5.
The mean drinking outcomes (SD) for each level of the temptation to drink item at the fourth session are provided in Table 3. As seen in the table, individuals who were “not at all” tempted to drink had the lowest drinking consumption rates (PDD, PHD, and DDD), as well as the fewest drinking related consequences at both follow-up timepoints. An analysis of variance comparing the levels of temptation indicated significant mean differences across the levels of the tempted to drink item for all four drinking outcomes (PDD, PHD, DDD, and DrInC) at the one year follow-up and for PHD and DDD at the three year follow-up.
Table 3.
Descriptive Statistics for Drinking Outcomes by the item “How Tempted to Drink in Past Week?” in Session #4
| Not at all M (SD) | A little M (SD) | Somewhat M (SD) | Considerably M (SD) | Extremely M (SD) | |
|---|---|---|---|---|---|
| PDD 1 year post* | 13.9 (28.2) | 21.5 (29.9) | 30.7 (35.1) | 34.5 (38.1) | 35.0 (33.5) |
| PHD 1 year post* | 8.3 (22.6) | 11.8 (21.4) | 19.7 (29.8) | 24.9 (33.0) | 29.8 (33.3) |
| DDD 1 year post* | 2.6 (4.6) | 4.2 (5.7) | 4.8 (5.3) | 5.5 (5.9) | 7.4 (6.8) |
| DrInC 1 year post* | 21.0 (22.8) | 22.1 (20.4) | 28.9 (21.2) | 29.4 (18.9) | 34.5 (23.3) |
| PDD 3 years post | 23.1 (32.6) | 32.1 (36.7) | 31.8 (36.3) | 35.9 (37.9) | 30.3 (36.5) |
| PHD 3 years post* | 11.9 (24.6) | 19.7 (29.7) | 20.2 (31.5) | 25.7 (33.6) | 17.6 (27.9) |
| DDD 3 years post* | 2.6 (3.8) | 3.8 (3.9) | 4.2 (4.8) | 4.3 (4.7) | 4.9 (5.7) |
| DrInC 3 years post | 25.8 (23.9) | 31.6 (22.8) | 31.4 (25.7) | 35.4 (25.5) | 35.5 (23.6) |
Note.
p < 0.05 based on analysis of variance;
PDD = percent drinking days over past 30 days; PHD = percent heavy drinking days over past 30 days; DDD = drinks per drinking day over past 30 days; DrInC = continuous Drinker Inventory of Consequences score over past 90 days.
Changes in Temptation to Drink over Time
The latent growth model of the temptation to drink item over time across twelve sessions of treatment (for the CBT and TSF conditions) provided an excellent fit to the data (χ2 (95) = 202.97, p < 0.005, RMSEA =0.033 (90% CI: .026 to .039), CFI = 0.99). As seen in Figure 1 there was a significant average reduction in temptation to drink over time (linear slope: β = −0.76, B (SE) = −0.06 (0.004), p < 0.001). Results were entirely consistent for the MET sample, who received only four sessions. The latent growth model of temptation to drink over the four sessions in the MET sample also provided an excellent fit to the data (χ2 (11) = 18.76, p = 0.07, RMSEA =0.049 (90% CI: .000 to .086), CFI = 0.98) and there was also a significant reduction in temptation to drink over time (linear slope: β = −0.94, B (SE) = −0.24 (0.03), p < 0.001).
Figure 1.
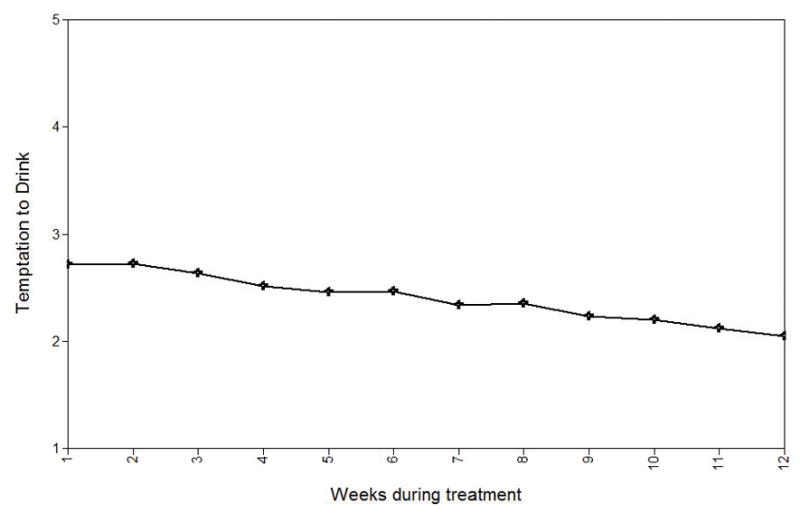
Average reduction in “temptation to drink” during the course of treatment for the CBT and TSF groups of the outpatient sample (n = 636).
Regression Models
The results from the regression analyses of drinking outcomes regressed on the temptation to drink item (Model 1) and drinking outcomes regressed on the temptation to drink item and drinking covariates (Model 2) for one year and three year outcomes are provided in Table 4. Standardized β coefficients provide an estimate of the association between each predictor and the outcome, taking into account the other predictors in the model. The R2 value for each model is also included to provide an estimate of the total variance explained in each of the drinking outcomes. All analyses were conducted using four methods for measuring temptation to drink (complete case, LOCF, worst case, and multiple imputation) and the results were entirely consistent across models. The results from the complete case analysis are provided in the table and results from the LOCF, worst case, and multiple imputation models are available upon request.
Table 4.
Prediction of Drinking Outcomes from Session #4 Temptation to Drink
| Drinking Outcomes | |||||||
|---|---|---|---|---|---|---|---|
| PDD | PHD | DDD | ANY | HDD | DrInC | PROB | |
| Predicting one year outcome | |||||||
| Model 1: | |||||||
| Temptation β | .22* | .25* | .23* | .28* | .33* | .20* | .29* |
| Model 1: R2 | .05 | .06 | .05 | .08 | .11 | .04 | .09 |
| Model 2: | |||||||
| Temptation β | .10* | .14* | .17* | .18* | .22* | .17* | .18* |
| Drinking covariate β | .42* | .38* | .26* | .38* | .38* | .46* | .36* |
| Model 2: R2 | .21 | .19 | .11 | .21 | .24 | .27 | .19 |
|
| |||||||
| Predicting three year outcomes | |||||||
| Model 1: | |||||||
| Temptation β | .08* | .10* | .14* | .08 | .08 | .12* | .03 |
| Model 1: R2 | .01 | .01 | .02 | .01 | .01 | .01 | .001 |
| Model 2: | |||||||
| Temptation β | −.51 | .02 | .09* | −.02 | .00 | .04 | −.02 |
| Drinking covariate β | .49* | .30* | .22* | .34* | .29* | .38* | .05 |
| Model 2: R2 | .11 | .10 | .07 | .11 | .09 | .15 | .003 |
Note.
p < 0.05;
β = standardized regression coefficient; PDD = percent drinking days over past 30 days; PHD = percent heavy drinking days over past 30 days; DDD = drinks per drinking day over past 30 days; ANY = any drinking over past 30 days; HDD = any heavy drinking days over past 30 days; DrInC = continuous Drinker Inventory of Consequences score over past 90 days; PROB = with alcohol problems (based on the experience of drinking consequences over past 90 days).
At the one year follow-up, the temptation to drink item was significantly associated with all drinking outcomes (Model 1), explaining 4% to 11% of the variance. When the analagous drinking covariate at the end of treatment was included in the model the associations between the temptation to drink item and drinking outcomes remained significant, albeit somewhat attenuated by the inclusion of the drinking covariate (Model 2). Thus, temptation to drink explained a small, but significant amount of unique variance in drinking outcomes at one year following treatment, above and beyond the variance explained by the same drinking measure at an earlier time point. At the three year follow-up, temptation to drink (Model 1) only explained 1–2% of the variance in drinking outcomes and temptation to drink was only significantly associated with DDD after the drinking covariates were included in the model.
Binary Classification Tests
Binary measures of temptation to drink (“not at all tempted” vs “a little” “somewhat” “considerably” or “extremely”), any drinking days, and any heavy drinking days (based on drinking days in the last month of treatment) were used as “diagnostic tests” in analyses predicting short- and long-term drinking outcomes. Again, all analyses were conducted using four methods for measuring the predictors and outcomes (complete case, LOCF, worst case, and multiple imputation) and the results were consistent across models. The results from the complete case models are provided in the table and results from the LOCF, worst case, and multiple imputation models are available upon request.
As reported in Table 5, the overall accuracy was mostly the highest for any drinking days (range from 0.61 to 0.70), although the accuracy of temptation to drink was highest in predicting alcohol problems at three years following treatment (0.73). Sensitivity (true positive rate) was highest for the temptation to drink item (range from 0.80 to 0.88) and was lowest for any heavy drinking days (range from 0.51 to 0.66), with any drinking falling in between (range from 0.65 to 0.77). Thus, reporting any temptation to drink during treatment was the most accurate in identifying individuals who would have negative drinking outcomes at one year and three years post-treatment. Specificity (true negative rate) was highest for any heavy drinking days (range from 0.55 to 0.76) and was lowest for temptation to drink (range from 0.32 to 0.35), with any drinking falling in between (range from 0.65 to 0.77). Thus, no heavy drinking days in the last month of treatment was the most accurate in identifying individuals who would have better drinking outcomes at one year and three years post-treatment.
Table 5.
Binary Classification Tests for Each Drinking Outcome and Temptation to Drink using Observed “Complete Case” Data
| Base rate N (%) | Accuracy | Sensitivity | Specificity | |||||||
|---|---|---|---|---|---|---|---|---|---|---|
| ANY | HDD | PROB | ANY | HDD | PROB | ANY | HDD | PROB | ||
| One year outcomes | ||||||||||
| Tempted to drink | 499 (77%) | 0.63 | 0.58 | 0.68 | 0.85 | 0.88 | 0.84 | 0.33 | 0.32 | 0.35 |
| Any drinking | 511 (59%) | 0.69 | 0.67 | 0.70 | 0.73 | 0.77 | 0.71 | 0.62 | 0.58 | 0.68 |
| Any heavy drinking | 403 (47%) | 0.63 | 0.69 | 0.62 | 0.58 | 0.66 | 0.56 | 0.71 | 0.72 | 0.76 |
|
| ||||||||||
| Three year outcomes | ||||||||||
| Tempted to drink | 462 (78%) | 0.62 | 0.55 | 0.73 | 0.80 | 0.82 | 0.80 | 0.28 | 0.27 | 0.23 |
| Any drinking | 461 (58%) | 0.64 | 0.61 | 0.62 | 0.66 | 0.68 | 0.65 | 0.58 | 0.53 | 0.40 |
| Any heavy drinking | 363 (46%) | 0.57 | 0.62 | 0.52 | 0.52 | 0.57 | 0.51 | 0.66 | 0.67 | 0.55 |
Note. Base rate = number of individuals who met cutoff criteria (e.g., tempted to drink, drinking, and heavy drinking) for each predictor; ANY = any drinking over past 30 days; HDD = any heavy drinking days over past 30 days; PROB = with alcohol problems (based on the DrInC composite) over past 90 days.
Additional classification tests were conducted with alternative cut-points for the temptation to drink variable (e.g., “not at all” or “a little” versus “somewhat” to “extremely”) and the drinking outcomes (e.g., any drinking days and any heavy drinkings in all months of treatment or months two and three of treatment only). Accuracy and sensitivity were consistently the highest for the any drinking days outcome (regardless of the cut-point) and the temptation to drink item (regardless of cut-point). Any heavy drinking days had the lowest sensitivity and low accuracy (regardless of cut-point).
Discussion
The current study was designed to evaluate self-reported “temptation to drink” as an alternative non-consumption predictor of outcomes in comparison to typically employed consumption items. The results indicated that temptation to drink changed in a linear fashion during treatment, with each successive assessment associated with a decrease in mean self-reported temptation. Regression analyses indicated that self-reported temptation to drink during the fourth session of treatment was significantly associated with all drinking outcomes at one year following treatment and was significantly associated with drinks per drinking day (but not drinking frequency or consequences) at three years following treatment.
Classification tests of “diagnostic accuracy” indicated that temptation to drink had the greatest level of sensitivity and similar levels of overall accuracy as the drinking consumption indicators in predicting drinking outcomes at one and three-years post-treatment, while the drinking consumption indicators had greater levels of specificity across outcomes. There is often a trade-off between sensitivity and specificity and it is useful to evaluate these measures of accuracy in light of the outcomes at stake. In this case, the temptation to drink during treatment was more sensitive than the levels of drinking during treatment in predicting the proportion of individuals who had any drinking days, any heavy drinking days, and alcohol problems at one year and three years post-treatment. Thus, one’s evaluation of their desire to drink may be a better indicator of worse treatment outcomes than levels of drinking, this may be especially true if an individual has significant temptations to drink and is struggling to maintain abstinence. Specificity results indicated that having no heavy drinking days in the last month of treatment was most accurate in predicting the proportion of individuals who had no drinking days, no heavy drinking days, and no alcohol problems at one year and three years post-treatment. This result is consistent with recent recommendations by Falk and colleagues (2010) who suggested that individuals with no heavy drinking days tend to have better outcomes than those with some heavy drinking days.
Importantly, the results from the regression analyses and classification tests were robust to different missing data assumptions. This finding could be partially explained by the low attrition rate in the drinking outcome data in Project MATCH (less than 9% missing data at one year post and only 15% missing data at three years post). It is unclear whether future studies with higher dropout rates will yield similar results.
Limitations
The primary limitations of the current study were the reliance on a single-item self-reported measure of temptation to drink, the interpretation of this item as an index of craving, and the lack of a more comprehensive multi-item measure of craving in the MATCH dataset. Most importantly, a single item measure of temptation to drink could be interpreted differently from person-to-person and an individual’s response to the item could also change based on the time of day, situational factors (e.g., content of the session), and other variables not included in the current analyses (e.g., mood, exposure to cues). I was unable to determine whether there were different interpretations of the item across individuals or within individuals across time. Similarly, a person’s self-reported temptation to drink could also be reflective of intentions to drink or self-efficacy, and may not necessarily reflect the subjective experience of craving. Preliminary analyses of other items asked during the fourth session indicated that temptation to drink was significantly correlated with the items: “how difficult was it to abstain since the last session” (r = 0.78), “how stressful life has been since the last session” (r = 0.38), and “how confident are you in your ability to abstain through next week” (r = −0.27). The temptation to drink item was more strongly correlated with drinking outcomes than these other items.
The need to make numerous analytic decisions regarding the definitions of temptation to drink and drinking outcomes also limits the results and interpretation of the current study. As noted above, I explored alternative definitions and the results were relatively consistent, but other measures could be more or less predictive. For example, it is unclear whether the wording of the question in the Project MATCH sample is superior or inferior to other methods for assessing self-reported temptation to drink. It would be important to compare the results of a single item measure to those of a more comprehensive measure of self-reported craving (Anton, 2000; Raabe et al., 2005; Statham et al., 2011).. Similarly, the results from the current study are based on a single sample and the findings should be replicated in other alcohol clinical trial datasets. Finally, while the temptation to drink item was significantly associated with drinking outcomes at one year and three years following treatment, the actual amount of variance explained by temptation to drink was notably small.
Conclusions
Reliance on a single-item, self-reported measure of temptation to drink is a primary limitation of the current study and is also a strength from a clinical perspective. Most clinicians do not have the time or inclination to assess drinking temptations as a multidimensional construct with a combination of objective and subjective measures. Asking a client “How tempted to drink have you been in the past week?” is an easy to administer, brief assessment device. The current study provides evidence that even this brief measure has reasonable predictive validity and sensitivity to detect short- and long-term drinking outcomes. Moreover the temptation to drink item might be a useful tool for assessing the level of aftercare needed and whether an individual might need additional weeks of treatment until the temptation to drink is reduced or eliminated. Given the ease of administration and predictive validity, future research would benefit from incorporating single item measures in multimethod evaluations of the craving construct.
Acknowledgments
The author thanks Dr. Dennis Donovan for numerous discussions relevant to the current study, Janice Vendetti for her tremendous assistance with the Project MATCH data, Daniel Kivlahan for his editorial feedback and two anonymous reviewers for their helpful comments.
References
- Abrams DB. Transdisciplinary concepts and measures of craving: Commentary and future directions. Addiction. 2000;95:S237–S246. doi: 10.1080/09652140050111807. [DOI] [PubMed] [Google Scholar]
- Addolorato G, Abenavoli L, Leggio L, Gasbarrini G. How many cravings? Pharmacological aspects of craving treatment in alcohol addiction: a review. Neuropsychobiology. 2005a;51:59–66. doi: 10.1159/000084161. [DOI] [PubMed] [Google Scholar]
- Addolorato G, Leggio L, Abenavoli L, Gasbarrini G. Neurobiochemical and clinical aspects of craving in alcohol addiction: A review. Addictive Behaviors. 2005b;30:1209–1224. doi: 10.1016/j.addbeh.2004.12.011. [DOI] [PubMed] [Google Scholar]
- Altman DG, Bland JM. Diagnostic tests. 1: Sensitivity and specificity. BMJ. 1994;308:1552. doi: 10.1136/bmj.308.6943.1552. [DOI] [PMC free article] [PubMed] [Google Scholar]
- American Psychiatric Association. Diagnostic and statistical manual of mental disorders. 4. Washington, DC: Author; 2000. text revision. [Google Scholar]
- Anton RF. What is craving? Models and implications for treatment. Alcohol Res Health. 1999;23:165–173. [PMC free article] [PubMed] [Google Scholar]
- Anton RF. Obsessive-compulsive aspects of craving: development of the Obsessive Compulsive Drinking Scale. Addiction. 2000;95:S211–217. doi: 10.1080/09652140050111771. [DOI] [PubMed] [Google Scholar]
- Breese GR, Sinha R, Heilig M. Chronic alcohol neuroadaptation and stress contribute to susceptibility for alcohol craving and relapse. Pharmacol Ther. 2011;129:149–171. doi: 10.1016/j.pharmthera.2010.09.007. [DOI] [PMC free article] [PubMed] [Google Scholar]
- Cisler RA, Zweben A. Development of a composite measure for assessing alcohol treatment outcome: operationalization and validation. Alcohol Clin Exp Res. 1999;23:263–271. [PubMed] [Google Scholar]
- Connors GJ, Allen JP, Cooney NL, DiClemente CC, Tonigan JS, Anton RF. Assessment issues and strategies in alcoholism treatment matching research. J Stud Alcohol Suppl. 1994;12:92–100. doi: 10.15288/jsas.1994.s12.92. [DOI] [PubMed] [Google Scholar]
- de Bruijn C, van den Brink W, de Graaf R, Vollebergh WAM. The craving withdrawal model for alcoholism: Towards the DSM-V. Improving the discriminant validity of alcohol use disorder diagnosis. Alcohol and Alcoholism. 2005;40:314–322. doi: 10.1093/alcalc/agh166. [DOI] [PubMed] [Google Scholar]
- Donovan DM, Bigelow GE, Brigham GS, Carroll KM, Cohen AJ, Gardin JG, Hamilton JA, Huestis MA, Hughes JR, Lindblad R, Marlatt GA, Preston KL, Selzer JA, Somoza EC, Wakim PG, Wells EA. Primary outcome indices in illicit drug dependence treatment research: systematic approach to selection and measurement of drug use end-points in clinical trials. Addiction. 2012;107:694–708. doi: 10.1111/j.1360-0443.2011.03473.x. [DOI] [PMC free article] [PubMed] [Google Scholar]
- Donovan D, Mattson ME, Cisler RA, Longabaugh R, Zweben A. Quality of life as an outcome measure in alcoholism treatment research. J Stud Alcohol Suppl. 2005;15:119–139. doi: 10.15288/jsas.2005.s15.119. discussion 92–93. [DOI] [PubMed] [Google Scholar]
- Drummond DC. Theories of drug craving, ancient and modern. Addiction. 2001;96:33–46. doi: 10.1046/j.1360-0443.2001.961333.x. [DOI] [PubMed] [Google Scholar]
- Drummond DC, Litten RZ, Lowman C, Hunt WA. Craving research: future directions. Addiction. 2000;95(Suppl 2):S247–255. doi: 10.1080/09652140050111816. [DOI] [PubMed] [Google Scholar]
- Falk D, Wang XQ, Liu L, Fertig J, Mattson M, Ryan M, Johnson B, Stout R, Litten RZ. Percentage of subjects with no heavy drinking days: evaluation as an efficacy endpoint for alcohol clinical trials. Alcohol Clin Exp Res. 2010;34:2022–2034. doi: 10.1111/j.1530-0277.2010.01290.x. [DOI] [PubMed] [Google Scholar]
- Field M, Schoenmakers T, Wiers RW. Cognitive processes in alcohol binges: a review and research agenda. Curr Drug Abuse Rev. 2008;1:263–279. doi: 10.2174/1874473710801030263. [DOI] [PMC free article] [PubMed] [Google Scholar]
- Garland EL, Carter K, Ropes K, Howard MO. Thought suppression, impaired regulation of urges, and Addiction-Stroop predict affect-modulated cue-reactivity among alcohol dependent adults. Biol Psychol. 2012;89:87–93. doi: 10.1016/j.biopsycho.2011.09.010. [DOI] [PMC free article] [PubMed] [Google Scholar]
- Goudriaan AE, de Ruiter MB, van den Brink W, Oosterlaan J, Veltman DJ. Brain activation patterns associated with cue reactivity and craving in abstinent problem gamblers, heavy smokers and healthy controls: an fMRI study. Addict Biol. 2010;15:491–503. doi: 10.1111/j.1369-1600.2010.00242.x. [DOI] [PMC free article] [PubMed] [Google Scholar]
- Heinz A, Beck A, Grüsser SM, Grace AA, Wrase J. Identifying the neural circuitry of alcohol craving and relapse vulnerability. Addiction Biology. 2009;14:99–107. doi: 10.1111/j.1369-1600.2008.00136.x. [DOI] [PMC free article] [PubMed] [Google Scholar]
- Higly AE, Crane NA, Spadoni AD, Quello SB, Goodell V, Mason BJ. Craving in response to stress induction in a human laboratory paradigm predicts treatment outcome in alcohol dependent individuals. Psychopharmacology. 2011;218:121–129. doi: 10.1007/s00213-011-2355-8. [DOI] [PMC free article] [PubMed] [Google Scholar]
- Hu L, Bentler PM. Cutoff criteria for fit indexes in covariance structure analysis: Conventional criteria versus new alternatives. Structural Equation Modeling. 1999;6:1–55. [Google Scholar]
- Kadden RM, Carroll K, Donovan D, Cooney N, Monti PM, Abrams D, Litt M, Hester R. Cognitive behavioral coping skills therapy manual: A clinical research guide for therapists treating individuals with alcohol abuse and dependence. Vol. 3. National Institute on Alcohol Abuse and Alcoholism; Rockville, MD: 1992. [Google Scholar]
- Kavanagh DJ, May J, Andrade J. Tests of the elaborated intrusion theory of craving and desire: Features of alcohol craving during treatment for an alcohol disorder. British Journal of Clinical Psychology. 2009;48:241–254. doi: 10.1348/014466508X387071. [DOI] [PubMed] [Google Scholar]
- Keyes KM, Krueger RF, Grant BF, Hasin DS. Alcohol craving and the dimensionality of alcohol disorders. Psychol Med. 2011;41:629–640. doi: 10.1017/S003329171000053X. [DOI] [PMC free article] [PubMed] [Google Scholar]
- Kühn S, Gallinat J. Common biology of craving across legal and illegal drugs – a quantitative meta-analysis of cue-reactivity brain response. European Journal of Neuroscience. 2011;33:1318–1326. doi: 10.1111/j.1460-9568.2010.07590.x. [DOI] [PubMed] [Google Scholar]
- Leggio L, Garbutt JC, Addolorato G. Effectiveness and safety of baclofen in the treatment of alcohol dependent patients. CNS Neurol Disord Drug Targets. 2010;9:33–44. doi: 10.2174/187152710790966614. [DOI] [PubMed] [Google Scholar]
- Marlatt GA. Craving for alcohol, loss of control, and relapse: A cognitive-behavioral analysis. In: Nathan PE, Marlatt GA, Loberg T, editors. Alcoholism: New directions in research and treatment. Plenum Press; New York: 1978. pp. 271–314. [Google Scholar]
- McLellan AT, Kushner H, Metzger D, Peters R, Smith I, Grissom G, Pettinati H, Argeriou M. The Fifth Edition of the Addiction Severity Index. J Subst Abuse Treat. 1992;9:199–213. doi: 10.1016/0740-5472(92)90062-s. [DOI] [PubMed] [Google Scholar]
- Miller WR, Del Boca FK. Measurement of drinking behavior using the Form 90 family of instruments. J Stud Alcohol. 1994;12:112–118. doi: 10.15288/jsas.1994.s12.112. [DOI] [PubMed] [Google Scholar]
- Miller WR, Tonigan JS, Longabaugh R. The Drinker Inventory of Consequences (DrInC): An instrument for assessing adverse consequences of alcohol abuse. National Institute on Alcohol Abuse and Alcoholism; Rockville, MD: 1995. [Google Scholar]
- Miller WR, Zweben A, DiClemente CC, Rychtarik RG. Motivational Enhancement Therapy Manual: A Clinical Research Guide for Therapists Treating Individuals with Alcohol Abuse and Dependence. Government Printing Office; Washington: 1992. [Google Scholar]
- Muthén B, Muthén L. Mplus User’s Guide. 6. Muthén & Muthén; Los Angeles, CA: 2010. [Google Scholar]
- Nowinski J, Baker S, Carroll K. Twelve Step Facilitation Therapy Manual: A Clinical Research Guide for Therapists Treating Individuals with Alcohol Abuse and Dependence. Government Printing Office; Washington: 1992. [Google Scholar]
- O’Brien CP. Anticraving medications for relapse prevention: a possible new class of psychoactive medications. Am J Psychiatry. 2005;162:1423–1431. doi: 10.1176/appi.ajp.162.8.1423. [DOI] [PubMed] [Google Scholar]
- Oslin DW, Cary M, Slaymaker V, Colleran C, Blow FC. Daily ratings measures of alcohol craving during an inpatient stay define subtypes of alcohol addiction that predict subsequent risk for resumption of drinking. Drug Alcohol Depend. 2009;103:131–136. doi: 10.1016/j.drugalcdep.2009.03.009. [DOI] [PubMed] [Google Scholar]
- Potgieter AS, Deckers F, Geerlings P. Craving and relapse measurement in alcoholism. Alcohol Alcohol. 1999;34:254–260. doi: 10.1093/alcalc/34.2.254. [DOI] [PubMed] [Google Scholar]
- Project MATCH Research Group. Project MATCH (Matching Alcoholism Treatment to Client Heterogeneity): rationale and methods for a multisite clinical trial matching patients to alcoholism treatment. Alcohol Clin Exp Res. 1993;17:1130–1145. doi: 10.1111/j.1530-0277.1993.tb05219.x. [DOI] [PubMed] [Google Scholar]
- Project MATCH Research Group. Matching Alcoholism Treatments to Client Heterogeneity: Project MATCH posttreatment drinking outcomes. J Stud Alcohol. 1997;58:7–29. [PubMed] [Google Scholar]
- Project MATCH Research Group. Matching alcoholism treatments to client heterogeneity: treatment main effects and matching effects on drinking during treatment. J Stud Alcohol. 1998;59:631–639. doi: 10.15288/jsa.1998.59.631. [DOI] [PubMed] [Google Scholar]
- Raabe A, Grüsser SM, Wessa M, Podschus J, Flor H. The assessment of craving: Psychometric properties, factor structure and a revised version of the Alcohol Craving Questionnaire (ACQ) Addiction. 2005;100:227–234. doi: 10.1111/j.1360-0443.2005.00960.x. [DOI] [PubMed] [Google Scholar]
- Rosenberg H. Clinical and laboratory assessment of the subjective experience of drug craving. Clin Psychol Rev. 2009;29:519–534. doi: 10.1016/j.cpr.2009.06.002. [DOI] [PubMed] [Google Scholar]
- Sayette MA, Shiffman S, Tiffany ST, Niaura RS, Martin CS, Shadel WG. The measurement of drug craving. Addiction. 2000;95:S189–210. doi: 10.1080/09652140050111762. [DOI] [PMC free article] [PubMed] [Google Scholar]
- Schafer JL, Graham JW. Missing Data: Our view of the state of the art. Psychol Methods. 2002;7:147–177. [PubMed] [Google Scholar]
- Schmidt P, Helten C, Soyka M. Predictive value of Obsessive-Compulsive Drinking Scale (OCDS) for outcome in alcohol-dependent inpatients: Results of a 24-month follow-up study. Substance Abuse Treatment, Prevention, and Policy: 6. 2011 doi: 10.1186/1747-597X-6-14. [DOI] [PMC free article] [PubMed] [Google Scholar]
- Schoenmakers TM, Wiers RW. Craving and attentional bias respond differently to alcohol priming: A field study in the pub. Eur Addict Res. 2010;16:9–16. doi: 10.1159/000253859. [DOI] [PubMed] [Google Scholar]
- Sinha R, Fox HC, Hong KA, Bergquist K, Bhagwagar Z, Siedlarz KM. Enhanced negative emotion and alcohol craving, and altered physiological responses following stress and cue exposure in alcohol dependent individuals. Neuropsychopharmacology. 2009;34:1198–1208. doi: 10.1038/npp.2008.78. [DOI] [PMC free article] [PubMed] [Google Scholar]
- Sinha R, Fox HC, Hong KI, Hansen J, Tuit K, Kreek MJ. Effects of Adrenal Sensitivity, Stress- and Cue-Induced Craving, and Anxiety on Subsequent Alcohol Relapse and Treatment Outcomes. Arch Gen Psychiatry. 2011;68:942–952. doi: 10.1001/archgenpsychiatry.2011.49. [DOI] [PMC free article] [PubMed] [Google Scholar]
- Sinha R, O’Malley SS. Craving for alcohol: findings from the clinic and the laboratory. Alcohol Alcohol. 1999;34:223–230. doi: 10.1093/alcalc/34.2.223. [DOI] [PubMed] [Google Scholar]
- Skinner MD, Aubin HJ. Craving’s place in addiction theory: contributions of the major models. Neurosci Biobehav Rev. 2010;34:606–623. doi: 10.1016/j.neubiorev.2009.11.024. [DOI] [PubMed] [Google Scholar]
- Spitzer RL, Williams JB. Structured Clinical Interview for DSM-III-R, Patient Version. New York State Psychiatric Institute; New York, NY: 1985. [Google Scholar]
- Statham DJ, Connor JP, Kavanagh DJ, Feeney GFX, Young RMD, May J, Andrade J. Measuring alcohol craving: Development of the Alcohol Craving Experience questionnaire. Addiction. 2011;106:1230–1238. doi: 10.1111/j.1360-0443.2011.03442.x. [DOI] [PubMed] [Google Scholar]
- Tiffany ST, Carter BL, Singleton EG. Challenges in the manipulation, assessment and interpretation of craving relevant variables. Addiction. 2000;95:S177–187. doi: 10.1080/09652140050111753. [DOI] [PubMed] [Google Scholar]
- Tiffany ST, Friedman L, Greenfield SF, Hasin DS, Jackson R. Beyond drug use: a systematic consideration of other outcomes in evaluations of treatments for substance use disorders. Addiction. 2012;107:709–718. doi: 10.1111/j.1360-0443.2011.03581.x. [DOI] [PMC free article] [PubMed] [Google Scholar]
- Witkiewitz K, Bowen S, Donovan DM. Moderating effects of a craving intervention on the relation between negative mood and heavy drinking following treatment for alcohol dependence. J Consult Clin Psychol. 2011;79:54–63. doi: 10.1037/a0022282. [DOI] [PMC free article] [PubMed] [Google Scholar]
- World Health Organisation. ICD-10 Classifications of Mental and Behavioural Disorder: Clinical Descriptions and Diagnostic Guidelines. Geneva: World Health Organisation; 1992. [Google Scholar]