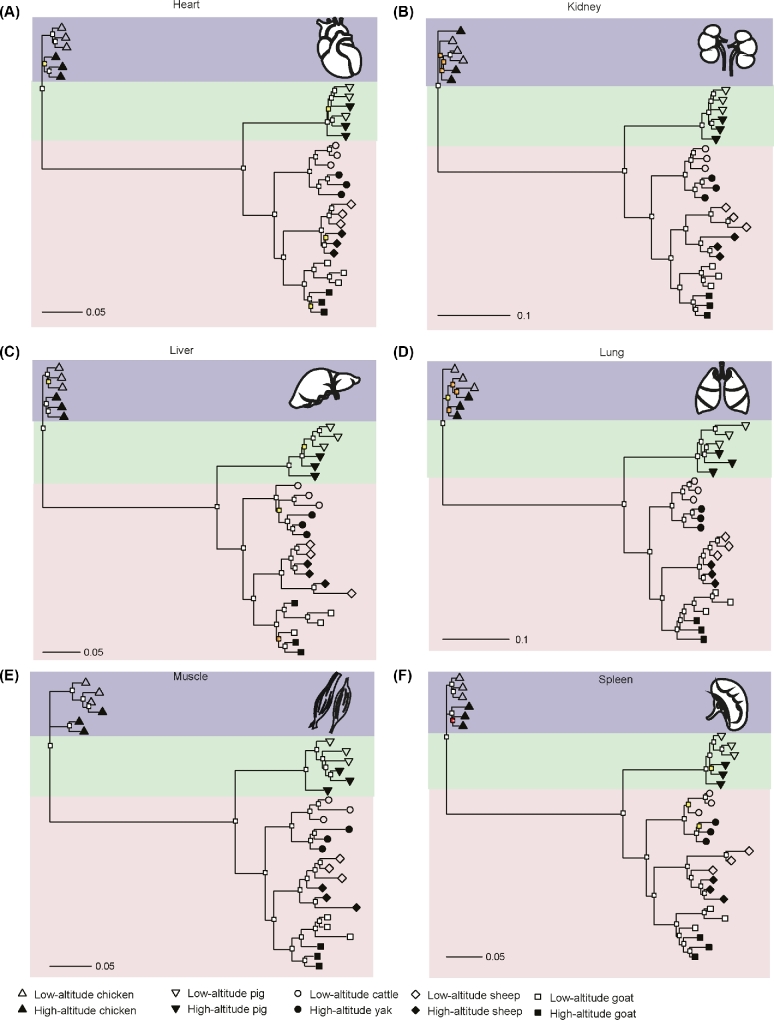
Figure 2:
Gene expression phylogenies for 6 tissues across 5 vertebrates. Neighbor-joining expression tree constructed based on 1-Spearman correlation distances in 6 tissues. We performed 100 bootstraps by randomly sampling the single-copy orthologues with replacement. Bootstrap values (fractions of replicate trees that have the branching pattern, as in the shown tree constructed using all the transcribed single-copy orthologues) are indicated by different colors: red color of the node indicates support from less than 50% of bootstraps, while orange, yellow, and white colors indicate support between 50% and 70%, between 70% and 90%, and greater than 90%, respectively.

