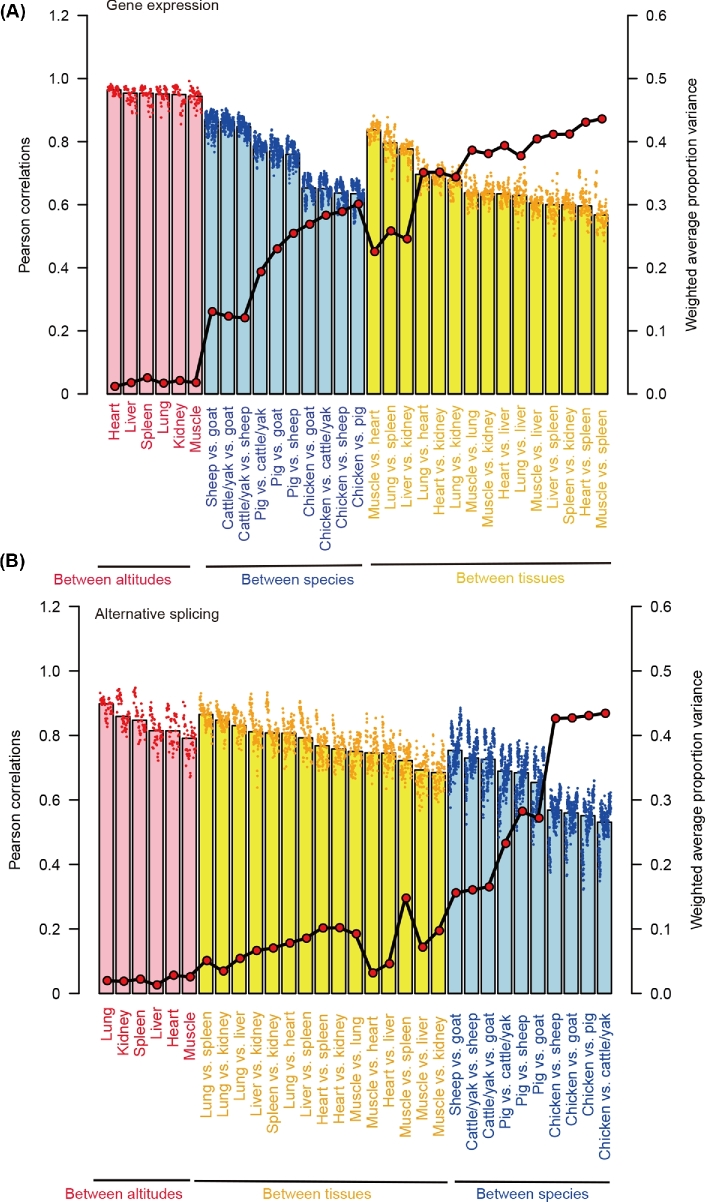
Figure 3:
Comparison of variations between altitudes, species, and tissues revealed by (a) gene expression and (b) alternative splicing pattern. Scatter-point and bar plots represent the pairwise Pearson's correlation between samples. Weighted average proportion variance of the alternative splicing (reflected by PSI values) was determined using the PVCA approach and is depicted as red dots connected by black lines.

