Abstract
N6 -methyladenosine (m6A) is the most common and abundant messenger RNA modification, modulated by ‘writers’, ‘erasers’ and ‘readers’ of this mark 1,2. In vitro data have shown that m6A influences all fundamental aspects of mRNA metabolism, mainly mRNA stability, to determine stem cell fates 3,4. However, its in vivo physiological function in mammals and adult mammalian cells is still unknown. Here we show that deletion of m6A ‘writer’ protein METTL3 in mouse T cells disrupts T cell homeostasis and differentiation. In a lymphopenic mouse adoptive transfer model, naive Mettl3 deficient T cells failed to undergo homeostatic expansion and remarkably remained in the naïve state up through 12 weeks, thereby preventing colitis. Consistent with these observations, the mRNAs of SOCS family genes encoding STAT- signaling inhibitory proteins, Socs1, Socs3 and Cish, were marked by m6A, exhibited slower mRNA decay and increased mRNAs and protein expression levels in Mettl3 deficient naïve T cells. This increased SOCS family activity consequently inhibited IL-7 mediated STAT5 activation and T cell homeostatic proliferation and differentiation. We also found that m6A plays important roles for inducible degradation of Socs mRNAs in response to IL-7 signaling in order to reprogram Naïve T cells for proliferation and differentiation. Our study elucidates for the first time the in vivo biological role of m6A modification in T cell mediated pathogenesis and reveals a novel mechanism of T cell homeostasis and signal-dependent induction of mRNA degradation.
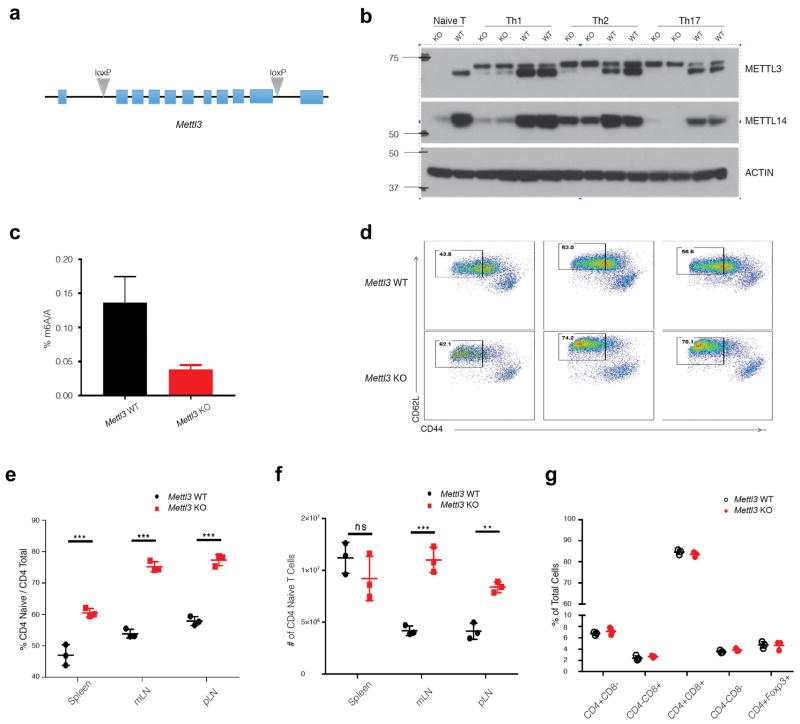
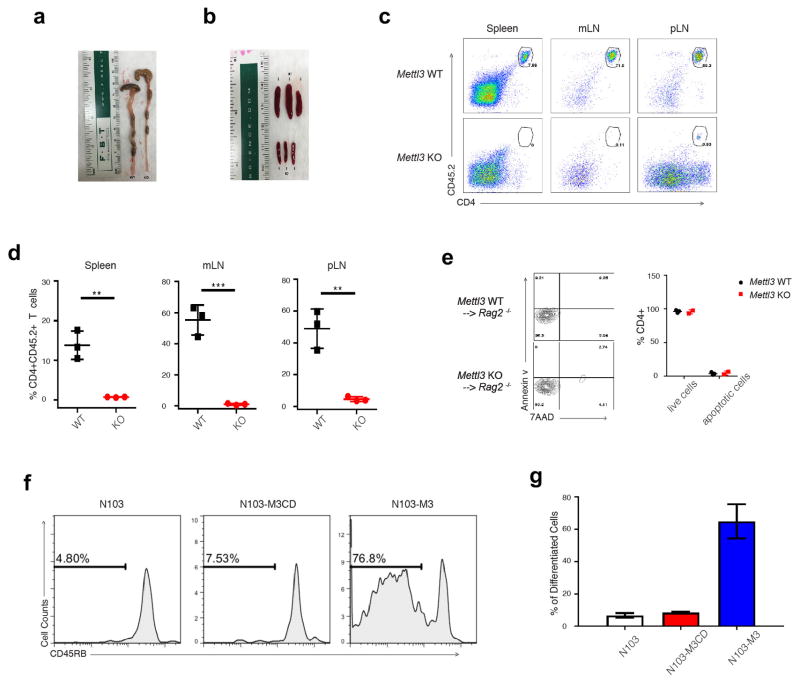
T cell differentiation and proliferation represent an exceptionally simple and tractable model system to understand the general principles of cellular specification and gene regulation. Alpha beta naïve T cells can differentiate and proliferate into distinct functional T helper effector subset cells in response to defined cytokines in vitro and different micro-environmental signals in vivo 5,6. As m6A plays an essential role during the cell fate patterning of embryonic stem cells in vitro, we hypothesized m6A might be an important regulator of T helper (Th) differentiation. To study the in vivo functions of m6A, we generated conditional knockout mice for the m6A writer protein, METTL3 (Extended Data Fig. 1a), as Mettl3 knockout (KO) mice are embryonic lethal 3. CD4+ T cells from CD4-CRE conditional Mettl3Lox/Lox mice displayed absence of both METTL3 and its associated METTL14 proteins (Extended Data Fig. 1b). Concomitantly, the overall RNA m6A methylation levels in KO cells were decreased to roughly 28% of that in wild type (WT) cells (Extended Data Fig. 1c). Characterization of murine immune cell populations in the steady state revealed that T cell homeostasis was abnormal in spleen and lymph nodes, but not thymus, exhibited by the fact that naïve T cell numbers from lymph nodes were increased (Extended Data Fig. 1d–g).
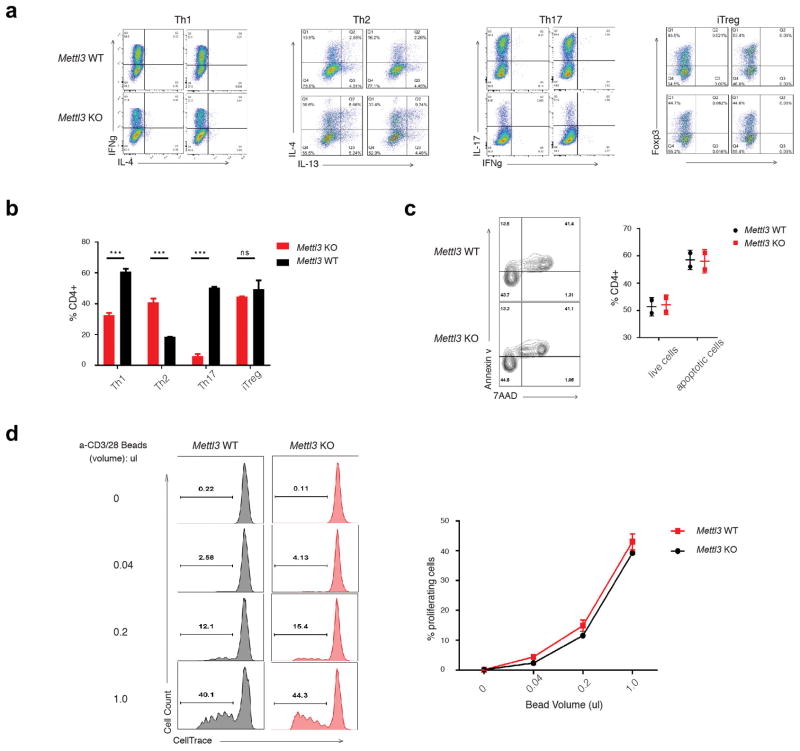
To characterize the possible defects of the Mettl3 KO naïve T cells, we utilized the defined in vitro TCR-dependent T cell differentiation system and found that Mettl3 deficient naïve T cells exhibited reduction of Th1 and Th17 cells, an increase in Th2 cells, and no changes in Treg cells relative to WT naïve T cells (Extended Data Fig. 2a, b). We also saw no significant differences in proliferation and apoptosis between the WT and KO naïve T cells in these cultures (Extended Data Fig. 2c, d). Together, these findings suggest that m6A modification plays an important role during CD4+ T cell differentiation, but not on T cell apoptosis and TCR-mediated proliferation.
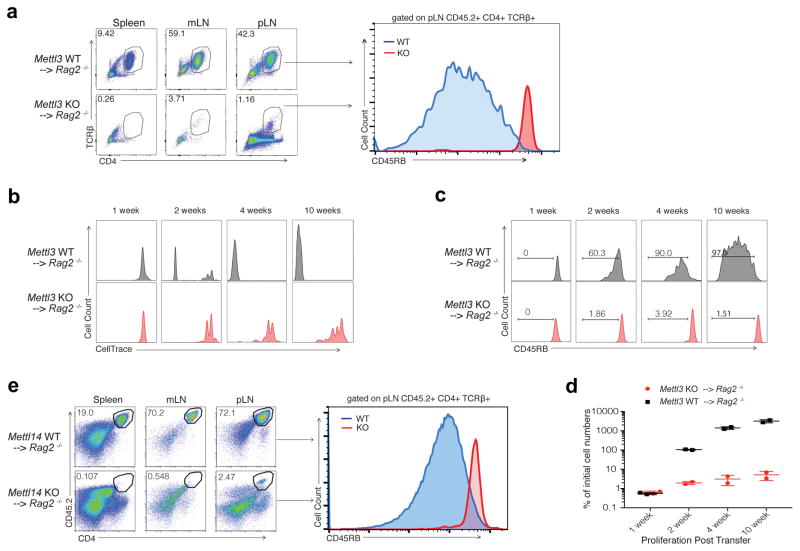
Upon adoptive transfer into lymphopenic mice, naïve T cells normally undergo homeostatic expansion in response to the elevated IL-7 levels in such mice and differentiate into effector T cells, causing colitis 7. To study how Mettl3 regulates naïve T cell homeostasis in vivo, we adoptively transferred CD4+CD25−CD45RBhi naïve T cells into Rag2−/− mice, and found that mice receiving KO naïve T cells (Mettl3−/− recipients) showed no signs of disease up to 12 weeks after transfer. Mettl3−/− recipients continued to gain weight throughout the experiment, while control mice that received WT naïve T cells (Mettl3+/+ recipient) began losing weight at the 5th week after transfer (Fig. 1a). Mettl3−/− recipients exhibited no colitis upon endoscopy, displayed normal colon length, and were found to have reduced spleen and lymph node sizes compared to WT control mice at the 8th week after transfer (Fig. 1b, Extended Data 3a, b). When analyzed by FACS, Mettl3−/− CD45.2 CD4+ donor T cells were nearly undetectable in recipient colons (Fig. 1d), as well as in the spleen, but instead remained in peripheral and mesenteric lymph nodes, while WT donor T cells were found in large numbers in all lymphoid organs of the recipients (Extended Data Fig. 3c, d). Haematoxylin and Eosin (H&E) staining and analysis of colons also confirmed that the Mettl3 KO T cells caused no T cell infiltration and inflammation, while WT T cells caused severe colonic inflammation and disrupted colon structure (Fig. 1c). Remarkably, FACS analysis further revealed that the vast majority of transferred Mettl3−/− T cells recovered from the peripheral lymph nodes still displayed their original naïve T cell marker CD45RB+ as long as 12 weeks after transfer into Rag2−/− mice, while the transferred WT cells differentiated into the effector/memory T cells (CD45RBlow) which mediated the pathology in this model (Fig. 2a).
Figure 1. Mettl3 KO naïve T cells do not promote disease in CD45RB-High adoptive transfer colitis mouse model.
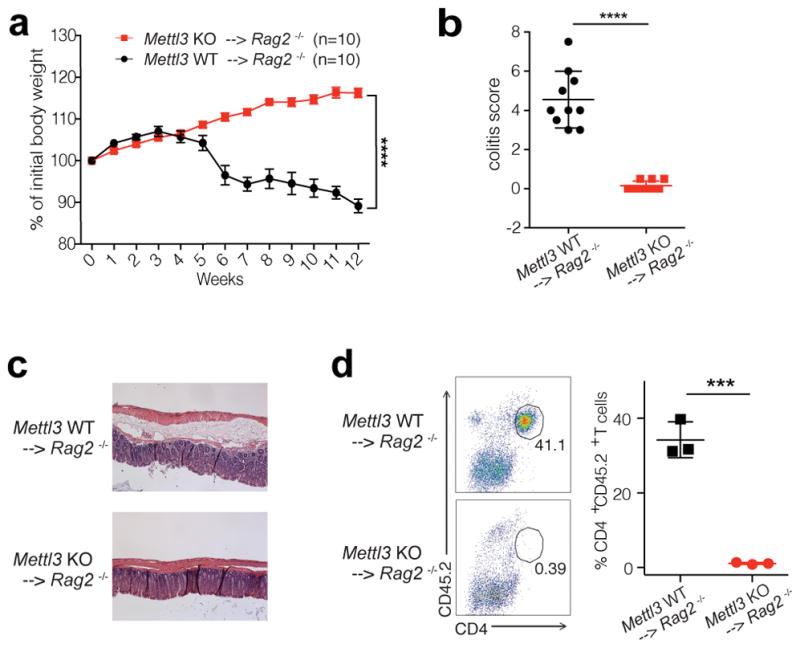
a, Body weight changes after naïve T cell adoptive transfer into Rag2−/− host mice (n=10), 2-way ANOVA. b, c, Endoscopic colitis scores and representative pictures of H&E staining of the colon from Rag2−/− receiving WT and KO naive T cells 8 weeks after transfer (n=10), unpaired t test. d, FACS analysis of transferred T cells in colon tissues (n=3), unpaired t test. n=number of biological replicates. p***<0.001, p****<0.0001.
Figure 2. Mettl3 KO naïve T cells are locked in the naïve state and proliferate much slower than WT cells after transfer into Rag2−/− mice.
a, Most of the Mettl3 KO donor cells are retained in lymph nodes (LN) and are locked in naïve states 12 weeks after transfer. b, The WT donor naïve T cells start to differentiate from the second week after transfer (CD45RBlow), while the Mettl3 KO donor naïve T cells always stay in naïve states (CD45RBhigh). c, d, The WT donor naïve T cells are driven to proliferate rapidly from the 2nd week, while the Mettl3 KO T cells slowly proliferate, with the total number of cells recovered from pLN shown in (d). e, Mettl14 KO donor naïve T cells recapitulate the phenotype of Mettl3 KO donor cells. At least 6 animals in each group were analyzed, and representative images were shown.
We next sought to investigate whether Mettl3−/− naïve T cells were capable of proliferation and could demonstrate normal survival after transfer into Rag2−/− mice 8. Using CellTrace labeling of the transferred naïve T cells, proliferation of WT cells was observable beginning week 2, whereas Mettl3 KO T cells retained a naïve phonotype and proliferated slowly. Four weeks after transfer, over 90% of WT cells had differentiated into effector/memory cells, while most of the Mettl3 KO T cells remained naïve and failed to display increased proliferation (Fig. 2b, c). Despite starting with a similar number of cells, WT cells proliferated over 50 times more than Mettl3 KO cells by the second week, and over 400 times more by week four (Fig. 2d). No differences in apoptosis were observed between Mettl3 KO and WT T cells (Extended Data Fig. 3e), suggesting the differences in cell number were not due to defects in cell viability.
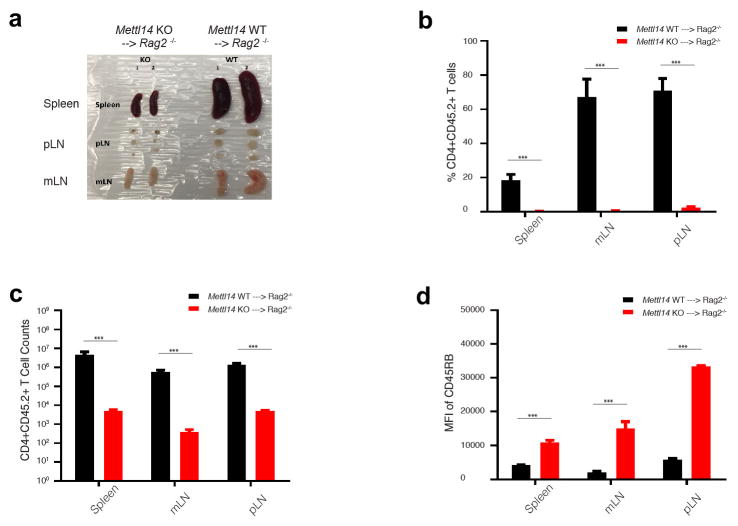
To establish that m6A directly controls T cell homeostatic expansion, we re-introduced WT Mettl3 gene or m6A catalytic dead Mettl3 gene back into Mettl3 KO naïve T cells, and showed that the WT Mettl3 gene, but not m6A catalytic dead Mettl3, could largely rescue the differentiation defects of Mettl3 KO naïve T cells in vivo (Extended Data Fig. 3f, g). Furthermore, we also generated an additional CD4-CRE conditional mouse line for Mettl14, an essential m6A catalytic partner for Mettl3 in the same m6A ‘writer’ complex. Mettl14 KO mice showed an identical phenotype to Mettl3 KO mice. Specifically, 4 weeks after transfer into Rag2−/− mice Mettl14 KO naïve T cells remained in the naïve state (Fig. 2e), the mice displayed smaller lymphoid organs, and expanded less than transferred WT naïve T cells (Extended Data Fig. 4a–d). Taken together, our data suggest that m6A RNA modification is required not only for Th cell differentiation and proliferation in vivo, but also for T cells to properly exit the naïve “progenitor” state.
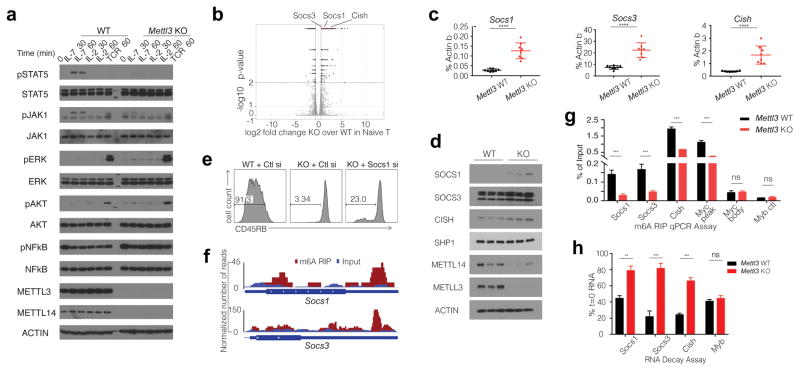
Peripheral T cell pools are maintained by complex mechanisms, and naïve T cell homeostasis and survival is mainly sustained by the IL-7/STAT5 and self-peptide-MHC/TCR signaling axes 9. It is well established that the elevated levels of IL-7 in lymphopenic mice induce extensive homeostatic proliferation and differentiation of naïve T cells after adoptive transfer 10. We hypothesized that the IL-7 receptor and its downstream molecular pathway were compromised in Mettl3 KO cells. Consistently, we observed dramatically decreased JAK1 and STAT5 phosphorylation levels in KO naïve T cells upon IL-7 stimulation (Fig. 3a). Moreover, basal ERK and AKT, but not NFκB, phosphorylation was found to be elevated in KO naive T cells, with TCR stimulation only minimally enhancing ERK and AKT signaling. These findings are consistent with the observation that Mettl3 KO naïve T cells proliferate normally ex vivo after TCR stimulation, indicating the limited proliferation found after adoptive transfer to lymphopenic mice was driven by defects in STAT5 phosphorylation, while their long term survival in these recipients was maintained by elevated basal ERK and AKT signaling. We conclude that m6A controls the balance of the two essential signaling pathways to control the T cell homeostasis, IL-7 mediated JAK-STAT signaling and TCR mediated ERK/AKT signaling, thus uncoupling T cell proliferation from cell survival.
Figure 3. Overexpressed m6A target genes Socs1, Socs3 and Cish in Mettl3 KO naïve T cells suppress IL-7/STAT5 signaling pathway.
a, Phosphorylation of STAT5 and JAK1 is diminished upon IL-7 stimulation in vitro, and basal levels of ERK and AKT phosphorylation are enhanced in KO naïve T cells. b, Socs1, Socs3 and Cish are among the most significant up-regulated genes in Mettl3 KO over WT naïve T cells from RNA-Seq. c, d, RT-qPCR and Western Blots validate that Socs1, Socs3 and Cish mRNA are over-expressed in Mettl3 KO versus WT naïve T cells, unpaired t test. e, Socs1 siRNA knockdown in Mettl3 KO naïve T cells partially rescues the differentiation defects 4 weeks after transfer into Rag2−/− mice. f, m6A peaks are enriched in 3′-UTR of Scos1 and Socs3 genes from m6A RIP-Seq data with WT CD4+ T cells. g, Socs1, Socs3 and Cish are m6A modified, and the marker is lost in Mettl3 KO naïve T cells., 2-way ANOVA. h, RNA degradation assay shows Socs1, Socs3 and Cish mRNAs degrade slower in Mettl3 KO naïve T cells than that in WT cells two hours after Actinomycin-D treatment. The residual RNA were normalized to t=0. Three independent experiments were done for all the blots and qPCR assays. **p<0.01. ***p<0.001. ****<0.0001.
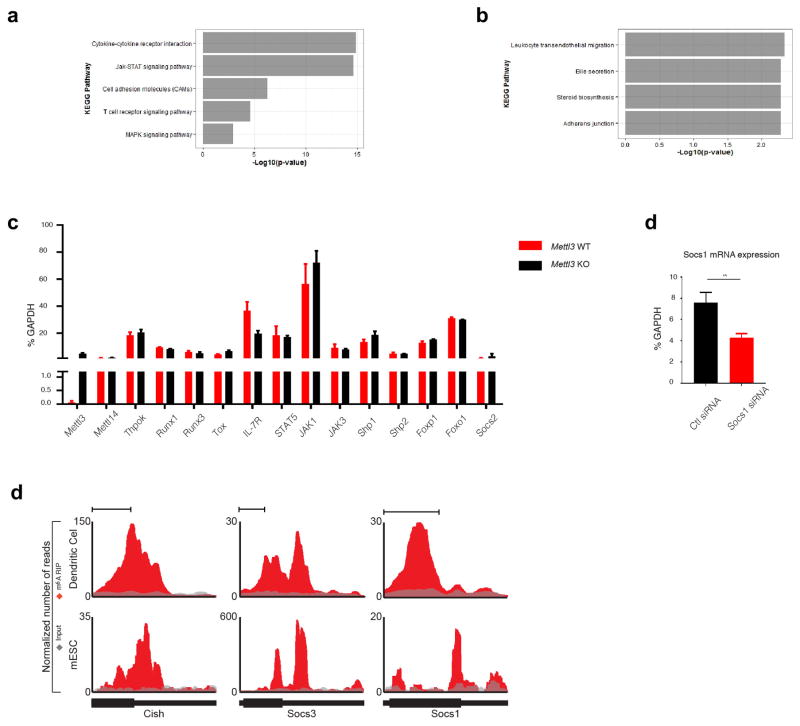
To further explore the molecular mechanism underlying the IL-7 signaling pathway defects, we performed an RNA-Seq analysis on the naïve T cells isolated from Mettl3 KO mice and littermate control WT mice. Consistent with our biochemical observations, the JAK-STAT and TCR signaling pathways were among the top up-regulated KEGG pathways (Extended Data Fig. 5a, b & Supplementary Information Table 3). Notably, three Suppressor of cytokine signaling (SOCS) family genes (Socs1, Socs3 and Cish) were among the most significantly up-regulated genes. RNA-Seq results were validated by qPCR and western blot, confirming that Socs1, Socs3 and Cish were over-expressed and SOCS1 in particular showed even higher relative expression in Mettl3 KO naïve T cells (Fig. 3c, d), while other important genes in IL-7 signaling pathways did not change (Extended Data Fig. 5c). SOCS proteins are the key physiological inhibitors of JAK-STAT signaling pathways and play important roles in T cell proliferation and differentiation 11,12. In particular, SOCS1 is a well-known negative regulator of IL-7 signaling, and SOCS3 and CISH also inhibit STAT5 phosphorylation, and T cell proliferation, while promoting ERK activity by binding to RasGAP 13,14,15,16,17. Consistently, siRNA mediated Socs1 knockdown partially rescued the in vivo differentiation defects of Mettl3 KO Naïve T cells 4 weeks after adoptive transfer into Rag2−/− mice (Fig. 3e, Extended Data Fig. 5d). Altogether, overexpression of SOCS1, SOCS3 and CISH in Mettl3 KO cells likely synergistically suppresses IL-7/STAT5 signaling, while enhancing ERK and AKT signaling, to inhibit naïve T cell proliferation and differentiation but maintain its survival.
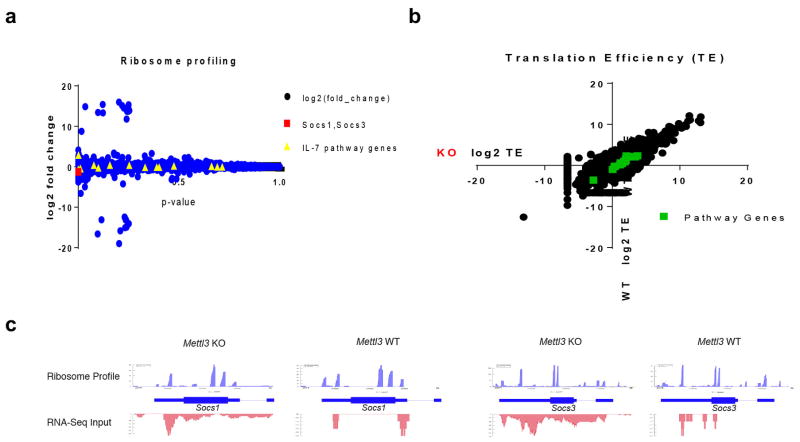
RNA m6A methylation is understood to affect RNA stability, with Mettl3 deletion resulting in loss of the m6A marker and in turn a slower RNA decay of m6A targets 2–4,18. To assess whether loss of Mettl3 resulted in decreased m6A methylation of SOCS family member mRNA, we performed genome-wide m6A methylation profiling using m6A-RIP-Seq with WT CD4+ T cells, and found that Socs1 and Socs3 mRNA 3′UTRs have highly enriched and specific m6A peaks (Fig. 3f), which is consistent with published mouse ESC and mouse dendritic cell m6A-Seq datasets4,19 (Extended Data Fig. 5e). We confirmed by m6A RNA-IP qPCR that Socs1, Socs3 and Cish mRNAs were bona fide m6A targets, and that m6A was lost in Mettl3 KO naïve T cells (Fig. 3g). Next, we performed RNA decay assays and found that Socs1, Socs3 and Cish mRNA levels were all increased in Mettl3−/− cells in comparison to WT cells 2 hours after Actinomycin-D treatment (Fig. 3h). m6A was also reported to affect RNA splicing and translation 2–4,18. To address those possibilities, we first performed genome-wide Ribosome profiling, and found that ribosome occupancy and the calculated translation efficiency were not affected for all the related genes in Mettl3 KO cells versus WT cells (See Methods and Extended Data Fig. 6a–d & Supplementary Information Table 4); Next, we analyzed our deep RNA-Seq data, and did not find any splicing differences between Mettl3 KO and WT cells, suggesting that the Naïve T cell homeostasis defect is mainly due to m6A mediated degradation, rather than splicing or translation. Taken together, loss of m6A modification in Mettl3 KO naïve T cells leads to increased Socs1, Socs3 and Cish mRNA half-life and proteins levels, thus suppressing the IL-7/STAT5 signaling pathway.
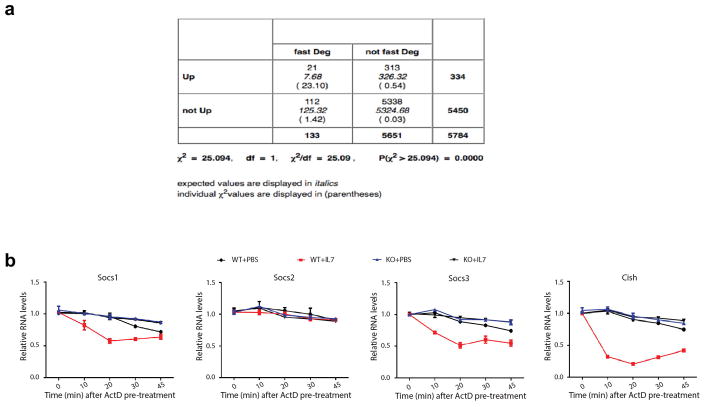
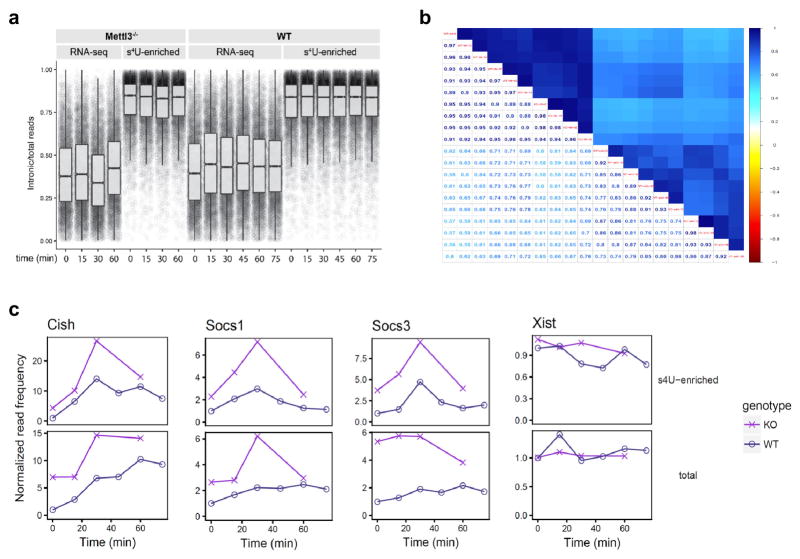
mRNA levels are tightly regulated by both transcription and degradation 20. While the abundance of most of transcripts are mainly controlled by transcription rate, it has been shown that the mRNA levels of a minority of genes (~17%) are significantly regulated by mRNA degradation rates, notably immediate-early inducible genes 21,22. Socs genes are well-known immediate-early genes induced upon IL-7 stimulation 11,12, thus we hypothesized that m6A specifically targets “signal-dependent immediate-early genes” for degradation. Interestingly, we found that up-regulated genes (including Socs1 and Socs3) in Mettl3 KO Naïve T cells were significantly enriched in the degradation controlled group of genes from LPS stimulated dendritic cells (chi square test, p<0.0001, Extended Data fig. 7a ) 20, 21. In addition, using the RNA decay assay we found that mRNAs of all the three Socs genes were degraded faster upon IL-7 stimulation as early as 10min after IL-7 stimulation comparing to control treatment in WT cells, while the accelerated mRNA degradation upon IL-7 stimulation is abrogated in Mettl3 KO naïve T cells (Extended Data Fig. 7b). To extend our observation genome-wide and estimate the rates of synthesis and degradation, we conducted a time course s4U-Seq with IL-7 induction and found a cluster of 34 transcripts including Cish, Socs1 and Socs3 are increased in Mettl3 KO relative to WT cells and show similar kinetics of induction (Fig. 4a, b, See Methods and Extended Data Fig. 8a–c & Supplementary Information Table 5) 23. This analysis also confirmed that the estimated degradation rates were lower in Mettl3 KO cells for Socs transcripts after IL-7 induction (Fig. 4c, d). We conclude that m6A targets a group of immediate-early inducible genes including Socs1, Socs3 and Cish for rapid mRNA degradation upon IL-7 stimulation, allowing IL-7-JAKs signaling to activate the downstream target STAT5, to initiate the re-programming of the naïve T cells for differentiation and proliferation.
Figure 4. m6A specifically target a group of immediate-early genes for degradation upon IL-7 stimulation.
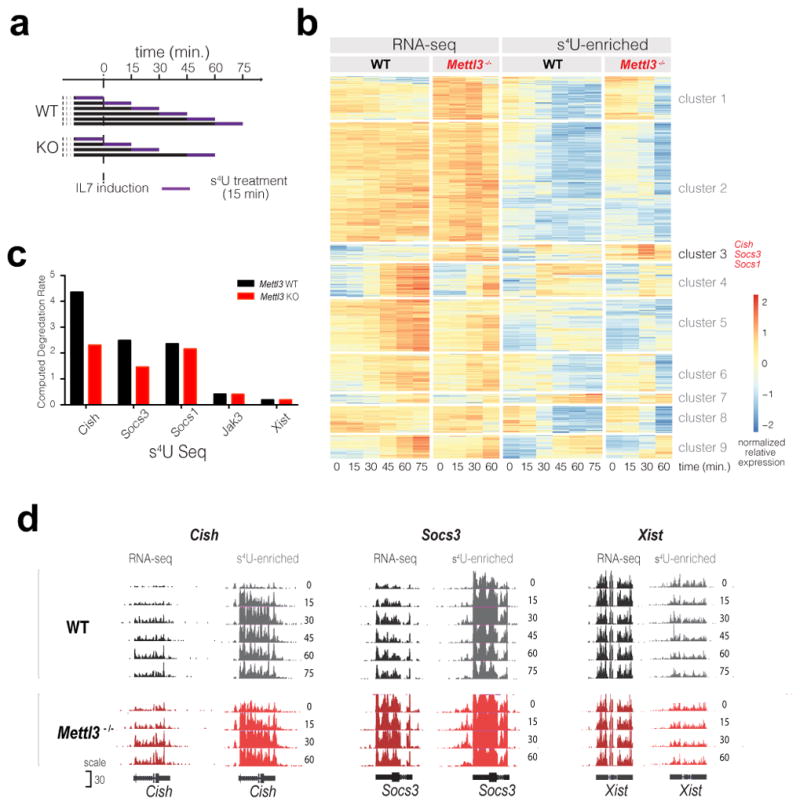
a, s4U-Seq experiment overview. b, Heatmap showing the results of clustering that normalizes transcript expression levels with significant changes after IL-7 induction and differences between WT and Mettl3−/−. Cluster 3 contains 34 transcripts with similar expression profiles including Cish, Socs3 and Socs1. c, Computed RNA degradation rates from s4U-Seq data. d, Read density for total RNA and s4U-enriched RNA at the indicated genes for WT and Mettl3−/− samples after IL-7 stimulation.
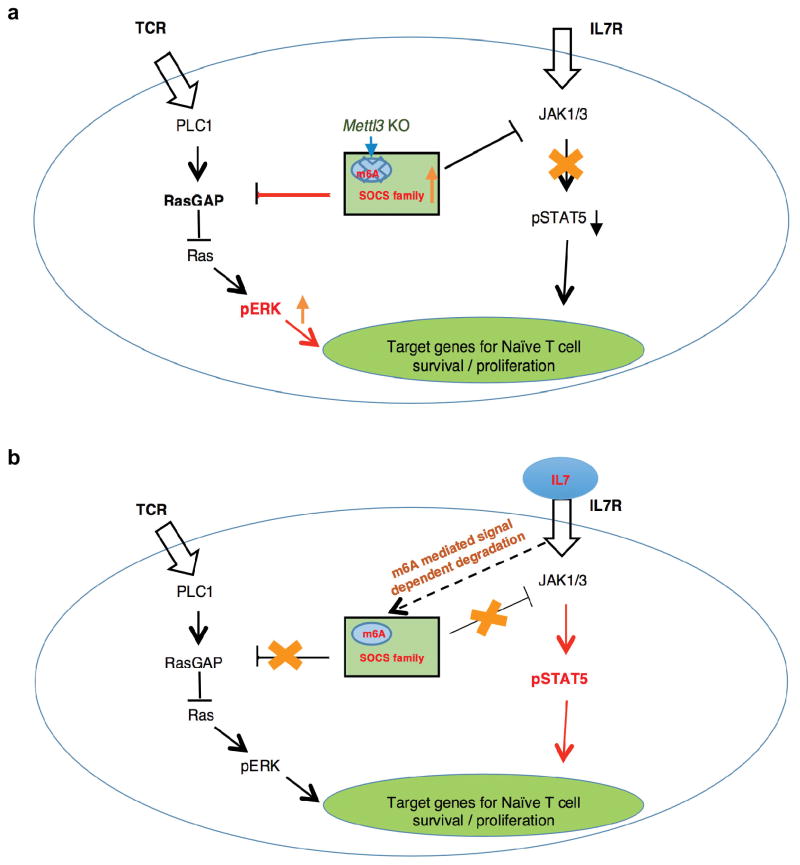
T cell homeostasis is essential to maintain the T cell pool size and forms the basis for adaptive immunity. Rather than the findings of m6A functions in ESCs, here we have revealed a different strategy, whereby m6A targets mRNAs encoding signaling proteins which control the “gatekeeper” IL-7 signal in naïve T cells, the progenitors of the adaptive immune system. Thus these targets expand the scope of m6A biology and enables RNA modification to impact critical dynamic signaling systems and response to external stimuli that maintain homeostasis. Specifically, using Mettl3 and Mettl14 conditional knockout mice, our current study demonstrates a novel mechanism whereby m6A functions in vivo to control T cell homeostasis by inducible degradation of Socs gene family mRNA, and consequently relieving the block on IL-7 signaling and T cell proliferation (Extended Data Fig. 9). Our study implies that m6A represents an evolutionarily conserved mechanism to specifically control the degradation rates of a group of immediate-early response genes in response to various environmental stimuli. Our study illustrates how this important epitranscriptomic marker not only plays an essential role in development, but that m6A modifications act as a critical regulator of immune cell homeostasis and function, opening new avenues of investigation into the function of m6A in human health and disease. Since T cells regulate the entire adaptive immune response, this has broad implications. These findings further suggest that T cell specific delivery of m6A-modifying agents might be an effective therapeutics to alleviate various autoimmune diseases.
Methods
Mice
Mettl3 and Mettl14 conditional knockout mice were both generated by inserting two lox sites into the first and the last introns using the CRISPR/cas9 based genome-editing system as previously described (Extended Data Fig. 1a) 24. The gRNA and donor oligos used for Mettl3 left side lox were: agtgctgccatgtgaatgaa agg, and ag*t*a*gttctctggaaaatccaggattattttggcaaaacagcaagtgctgccatgtgaatgaa ataacttcgtataatgtatgctatacgaagttat aggtgatctagagctaacgctggtcagagaccctgcttgaagtgaaagatgtgtgtgctagcg*a*t*g; for Mettl3 right side lox: atacattctggtagtctaga tgg, and cc*c*c*caaaaaaccctttatggacaaagacagatgtcactgagttgt atacattctggtagtctaga ataacttcgtataatgtatgctatacgaagttat tggcttaagctttaccagaatctacaacattcattagaacccaaagggctgttcttaaagctc*t*a*a. The gRNA and donor oligos used for Mettl14 left side lox were: cataaagtggttcacatgaa ggg, and aa*t*g*aagctgagtgcatctctgtgagagcaggagatacatgtagtacataaagtggttcacatgaa ataacttcgtataatgtatgctatacgaagttat gggctttgctttctgtgttactgcttctgatgccaacttgtatttcattcaccattggcgaca*g*g*g. for Mettl14 right side lox were: tacatagatgaggaacaata agg, and at*t*g*tgtattaaaatatcttttctaagtggtattctaacaacacaatacatagatgaggaacaata ataacttcgtataatgtatgctatacgaagttat aggatgatatgtaacaaaagctataatctagaacgagaaacaaggtatgtgcatatggacctt*t*t*a. The donor oligos were synthesized by IDT with 5′- and 3′-ends modified by Phosphorothioate bonds to increase the oligo stability after delivered into mouse embryos. The pulps born were genotyped and the PCR products were sequenced to validate intact integration of the lox sequences into the right genome loci.
We crossed floxed Mettl3 mice or Mettl14 with CD4-CRE mice to obtain conditional knockout mice. The CD4-CRE mice has been purchased from the Jackson laboratory and been fully backcrossed to C57BL/6 mice from the Charles River laboratories (over more than 10 generations).
Mettl3-fl/fl without CD4-CRE, or only CD4-CRE mice had both been used as WT controls for Mettl3-fl/fl; CD4-CRE mice, and we found there were no signs of differences using either one regarding our observed phenotypes. Thereafter, we only used Mettl3-fl/fl as WT controls for Mettl3-fl/fl; CD4-CRE KO mice for most of the experiments reported here. All the KO and WT mice were littermates and co-housed for any experiments described. All the mice were bred and maintained under specific pathogen-free conditions at the animal facility of Yale University School of Medicine. Animal procedures were approved by the Institutional Animal Care and Use Committee of Yale University. Both female and male mice were used in experiments. Wherever possible, preliminary experiments were performed to determine requirements for sample size, taking into account resources available and ethical, reductionist animal use. Exclusion criteria such as inadequate staining or low cell yield due to technical problems were pre-determined. Animals were assigned randomly to experimental groups. Each cage contained animals of all the different experimental groups.
Reagents and antibodies
The detailed information on all reagents and antibodies used in this study are listed in Supplementary Information table 1.
CD45RBhi adoptive transfer colitis, endoscopic and histologic analysis
We performed the experiment as described 7,25. Briefly, pure CD4+CD25−CD45RBhi naïve T cells were sorted from WT and Mettl3 or Mettl14 KO mice by FACS, washed twice with PBS, counted, and intravenously injected 0.5 million cells into each Rag2−/− receipt mice. The receipt mice were monitored and weighted each week.
At week 7, colon colitis was visualized using Coloview system (Karl Storz, Germany). Briefly, colitis score was evaluated considering the consistence of stools, granularity of the mucosal surface, translucency of the colon, fibrin deposit and vascularization of the mucosa (0–3 points for each parameter). Haematoxilin and eosin staining were performed on paraffin sections of colon previously fixed in Bouin’s fixative solutions.
Cell Proliferation and apoptosis assay
To trace T cell homeostatic proliferation in vivo, we labeled the FACS purified CD4+CD25−CD45RBhi naïve cells with CellTrace (ThermoFisher Scientific, C34557) before I.V. injections 8. We then intravenously injected 0.5 million cells into each Rag2−/− receipt mice. We analyzed the mice at 1 week, 2 week, 4 week and 10 weeks respectively after injection by FACS using the naive T cell marker CD45RB for differentiation, and CellTrace violet for proliferation.
For apoptosis assay, we stained the in vitro cultured cells or cells from mice with Annexin V and 7-AAD and analyzed by FACS, in which double negative cells are viable cells, while Annexin V+ or double positive cells are apoptotic cells.
T cell ex vivo differentiation
We FACS sorted CD4+ C62L+CD44low cells with FACSAria II Cell Sorter (BD Biosciences) and activated them with plate-bound monoclonal antibodies to CD3 (10 μg ml−1, 145-2C11) and CD28 (1–2 μg ml−1, PV-1) in the presence of mouse recombinant cytokines and blocking antibodies. Specifically, Th1 direction with IL-12 (10ng ml-1) and antibody to IL-4 (11B11, 10 μg ml−1); Th2 direction with IL4 (10 ng ml-1) and antibody to IFN-γ (XMG1.2, 10 μg ml−1); Th17 with IL-6 (20 ng ml−1), IL-23 (20 ng ml−1), and antibodies to IFN-γ (XMG1.2, 10 μg ml−1) and IL-4 (11B11, 10 μg ml−1); iTreg with TGF-β (2 ng ml−1), IL-2 (50 U ml−1), IL-23 (20 ng ml−1), and antibodies to IFN-γ (XMG1.2, 10 μg ml−1) and IL-4 (11B11, 10 μg ml−1). All cytokines were purchased from R&D. Click’s (Irvine Scientific) or RPMI (SIGMA-ALDRICH) (when indicated) media were supplemented with 10% FBS, L-glutammine (2 mM), penicillin (100 U ml−1) and β-mercaptoethanol (40 nM). After 4 days of culture, the cells were analyzed by FACS.
Signaling Assay
Naïve T cells were isolated by FACS, counted, and 1 million cells in cell culture media were plated on each well of 48 well plate. 10 μg of IL-7, or IL-2, or 0.2 μl of CD3/CD28 beads (ThermoFisher Scientific, 11452D) were added into the media, mixed and incubated in 37 °C incubator. Cells were harvested before adding cytokines or antibody beads (t=0), or 30 min (t=30), or 60 min (t=60) after adding the cytokines or antibody beads. The cells were lysed on ice for 30 min in RIPA buffer (ThermoFisher Scientific, 89901) with protease inhibitor cocktails (ThermoFisher Scientific, 78437) and phosphatase inhibitor cocktails (ThermoFisher Scientific, 78428). The supernatant were subjected western blot.
RNA-Seq
We isolated CD4+ cells using StemCell mouse CD4+ Kit (StemCell Technologies, Catalog # 19852) from spleen and lymph nodes. Then pure CD4+CD25−CD45RBhi naïve T cells were isolated by FACS sorting. We used two pairs of WT and KO mice for the experiment. Total RNAs were isolated with Direct-zol RNA MicroPrep kits (Zymo Research, R2062). Yale Center for Genome Analysis (YCGA) processed the total RNA by Ribo-Zero rRNA removal kit, constructed the libraries, and subject them to standard illumine HiSeq2000 sequencing, and obtained >40 million reads for each samples.
Raw RNA sequencing reads were aligned to the mouse genome (mm10, GRCm38) with Tophat 26. Gene expression levels were measured by Cufflinks and differential analysis was performed with Cuffdiff 27. Genes were considered significantly differentially expressed if showing ≥ 1.5 fold change and <0.01 p-value. Gene set analysis was performed and enriched KEGG pathways were obtained through online bioinformatics tools 28. Volcano plot and pathway plot were generated with R package “ggplot2” 29. We used CuffDiff and rMATS to analyze the possible splicing difference events, and did not find any significant difference between Mettl3 KO and WT samples 30.
RT-qPCR
Total RNA was isolated from Naïve T cells as described in ‘RNA-Seq’ section, then reverse transcribed using High-Capacity cDNA Reverse Transcription Kit (ThermoFisher Scientific, 4368814). Primers used for qPCR are included in Supplementary Information table 2. All qPCRs were run on Bio-Rad CFX96 real-time system using iTaq Universal SYBR Green Supermix (Bio-Rad, #1725124). Actin-b was used as internal control to normalize the data across different samples.
RNA degradation assay
Purified Naïve T cells by FACS sorting were plated on 96-well plate with 0.5 million cells per well. Actinomycin-D (Sigma-Aldrich, A1410) was added to a final concentration of 5μM, and cells were harvested before, or 2hrs after adding actinomycin-D. Then the cells were processed as described in ‘RT-qPCR’ section, except that the data were normalized to the t=0 time point.
For signaling dependent degradation assay, we first treat the naïve T cells with actinomycin-D for 1hr to fully inhibit transcription, then add IL-7 (10 μg/mL) or PBS as control into each well of the cells. Cells were lysed with Trizol LS at 0, 10min, 20min, 30min, 0r 45min after IL-7 addition.
HPLC quantification of m6A levels
RNA was collected with RLT buffer (Qiagen) according to manufactures instruction. Two rounds of poly(A) selection were performed using PolyA purist Mag kit (Ambion). 200 ng of Poly(A)-selected RNA was digested with 1 unit of Nuclease P1 in 50 mM NH4OAc at 37°C for 1 hour, and sample was cleared on a 0.22 μm filter. HPLC was performed on an Agilent 1290 Infinity UPLC system coupled to the Agilent 6490 Triple Quad mass spectrometer with the iFunnel. For the LC, the A solvent is water with 0.1% formic acid and B solvent is acetonitrile with 0.1% formic acid. The MS is in positive mode, scanning for the AMP and m6A product ion of 136 and 150.1, respectively. Samples were run in duplicate, and m6A/A ratios calculated.
m6A RNA-IP-qPCR & m6A RNA-IP-Seq
Total RNA was isolated with TRIZOL, according to manufactures instructions, and subjected to rRNA depletion with RiboMinus kit (Ambion). RNA was fragmented to ~100 nucleotide fragments with Ambion fragmentation reagent (40 second incubation at 94°C). 200 ng of RNA was denatured and incubated with 20ul of protein A beads, previously bound to 1 μg of anti-m6A polyclonal antibody (Synaptic Systems) or Rabbit IgG in 1× IPP buffer (150 mM NaCl, 10 mM TRIS-HCL and 0.1% NP-40). RNA was incubated with the antibody for 3 hours at 4°C in 1× IPP buffer. Beads where washed 2 times with 1× IPP buffer, 2 times with low salt buffer (50 mM NaCl, 10 mM TRIS-HCL and 0.1% NP-40), 2 times with high salt buffer (500 mM NaCl, 10 mM TRIS-HCL and 0.1% NP-40) and 1 time with 1× IPP buffer. RNA was eluted from the beads with 50 μl of RLT buffer, and purified with Qiagen RNeasy columns. RNA was eluted in 100 ul of RNase free water.
m6A enrichment was analyzed on a LightCycler 480 by RT-qPCR with One-Step RT-PCR Master Mix SYBR Green (Stratagene). The PCR was carried on using a standard protocol with melting curve. The amount of target were calculated using the formula: Amount of target = 2−ΔΔC(T) 31. Myc peak is positive control, Myc body and Myb are negative controls for m6A RIP qPCR. Two tailed T test for unequal, unpaired data sets with heteroscedastic variation was used to compare samples.
For m6A RNA-IP-Seq, we started with 200~300 ug of total RNA from CD4+ T cells isolated from wild type mice using StemCell CD4+ T cell kits. Using the same protocol with scale-up reagents, the eluted IP RNA were concentrated by ethanol precipitation, and resolved in 10 ul DEPC water. 10 ng RNA from input and enriched IP RNA samples were used for library preparation with the SMARTer Stranded Total RNA-Seq Kit – Pico Input Mammalian (Clontech) according to the manufacturer’s instructions. Input and enriched samples were multiplexed with Illumia bar codes and sequenced using paired-end 2×75-nt cycles on an Illumina HiSeq 2500 instrument. To process m6A-Seq data, reads were aligned using Tophat2. Macs was then used for peak calling following the protocol in Dominissini et al 32. Samples were normalized to get pileup per million reads in each sample, using the number of reads which were left after filtering redundant tags from MACS 33. Peaks were then visualized using IGV 34.
siRNA knockdown
Socs1 siRNA and non-targeting control siRNA were purchased from GE-Dharmacon (E-043120-00-0005), and the experiments were done by strictly following manufacturer’s manual. The Naïve T cells with siRNA transfection were incubate in 37°C incubator for 3 hrs, then were transferred into Rag2−/− receipt mice by intravenous injection (1 million cells per mice). 4 weeks after transfer, the cells from spleen, peripheral lymph nodes, and mesenteric lymph nodes were analyzed by FACS. Representative FACS images show that the Naïve marker CD45RB peaks shift leftwards upon Socs1 siRNA treatment.
Mettl3 KO rescue
The WT and catalytic dead Mettl3 genes were cloned into N103 plasmid in Chang lab. To create a catalytic dead mutant Mettl3, we inserted the mutations D395A and W398A (DPPW catalytic motif of METTL3) based on published data, which show that those two residues are absolutely required for METTL3 activity 35–37. Mettl3 KO naïve T cells were isolated from Mettl3 KO mice with StemCell Naïve T cell purification kit, then electroporated by nucleofection by exactly following the Amaxa mouse T cell nucleofector kit manual (Lonza). 4 hours after nucleofection in 37°C incubator, the cells were transferred into Rag2−/− receipt mice by intravenous injection (1 million cells per mice). 4 weeks after transfer, the cells from spleen, periphery lymph nodes, and mesenteric lymph nodes were analyzed by FACS for cell numbers, and naïve Cell marker CD45RB. The CD4+ T cells were isolated from lymph nodes using StemCell CD4+ T cell kit, and total RNA was isolated from the CD4+ T cells using Direct-zol RNA microprep columns (Zymo Research). RT-qPCR was performed using the isolated RNAs. Each group has at least 5 mice to ensure statistical significance.
Ribosome Profiling
We performed the Ribosome profiling by strictly following the manual of Illumina TruSeq Ribo Profile (Mammalian) Kit. Briefly, 50 million of Naïve T cells were isolated from WT and Mettl3 KO mice, and washed and treated with 0.1 mg/ml cycloheximide for 1min. After lysis, 1/10 of the cell lysate were used to isolate RNA for preparing input RNA library, the remaining were used to prepare ribosome footprints by first digested with 60U of 10 U/ul nuclease, then cleaned up by MicroSpin S-400 columns. The total RNAs and ribosome protected RNAs were then isolated with RNA Clean & Concentrator-25 kit (Zymo Reseaarch), and subjected to rRNA removal with Illumina Ribo-Zero Gold Kits. Polyacrylamide gel electrophoresis (PAGE) was used to purify the 28nt and 30nt long ribosome protected fragments, which were ligated 3′ adapters and prepared cDNA library. The cDNA library were PAGE gel purified again for the 70–80nt fragments, circularized, and amplified by PCR for 9 cycles, the resulting libraries were cleaned up by AMPure XP beads, purified by PAGE purification for 140~160bp fragments, and subjected to Illumina Hi-Seq for 75bp paired-end sequencing.
We used the tuxedo suite (https://ccb.jhu.edu/software/tophat/) to align the ribosome profiling reads and determine FPKM, fold change, and the associated p-value. All genes which did not have enough reads aligned to determine FPKM were discarded, and the remaining genes were plotted. To calculate translation efficiency, HTseq was used to count the number of reads in each experiment. The normalized translation efficiency was calculated by taking the log2 of the quotient of the ribosome footprint read count divided by the mRNA-Seq read count. The individual graphs were plotted using R package (https://bioconductor.org/packages/release/bioc/html/Sushi.html).
Enrichment of s4U-labeled RNA
Naïve T cells were isolated from Mettl3 KO and WT mice with Naïve T cell purification kits (StemCell). The cells were counted and aliquoted 4million per 1mL FACS buffer per Eppendorf tube. Each tube except t=0 receives 10 μg/ml IL-7 cytokine and incubate in 37°C incubator. 15minu before spanned down and lysed with Trizol, the cells were labeled with 250 μM s4U. The Enrichment of s4U-RNA was performed using MTS-biotin chemistry 23,38. Briefly, cells were lysed in TRIzol, extracted with chloroform once and the nucleic acids precipitated with isopropanol. DNA was removed with DNase, the proteins removed with phenol:chloroform:isoamylalcohol extraction, and RNA isolated using isopropanol precipitation. Total RNA was sheared to ~200bp by adding shearing buffer (150 mM Tris·HCl, pH 8.3, 225 mM KCl, 9 mM MgCl2) and heating to 94°C for 4 min, followed by quench on ice with EDTA. Sheared RNA was purified using a modified protocol with the RNeasy Mini Kit (Qiagen). To biotinylate the s4U-RNA, 20 μg sheared RNA was incubated with 2 μg MTS-biotin in biotinylation buffer for 30 min. Excess biotin was removed via chloroform extraction using Phase-Lock Gel Tubes. RNA was precipitated with a 1:10 volume of 3 M NaOAc and an equal volume of isopropanol and centrifuged at 20,000 × g for 20 min. The pellet was washed with an equal volume of 75% ethanol. Purified RNA was dissolved in 50 μL RNase-free water. Biotinylated RNA was separated from non-labeled RNA using glycogen-blocked Dynabeads Streptavidin C1 Beads (Invitrogen). Beads (10 μL) were added to each sample and incubated for 15 min at room temperature, then washed three times with high salt wash buffer (100 μL each, 100 mM Tris-HCl [pH 7.4], 10mM EDTA, 1 M NaCl, and 0.1% Tween-20). In order to improve the stringency of the washes, an additional 3 washes with buffer TE (10 mM Tris pH 7.4, 1 mM EDTA) at 55°C were added to the protocol. s4U-RNA was eluted from Dynabeads with 25 μL freshly prepared elution buffer (10 mM DTT, 100 mM NaCl, 10 mM Tris pH 7.4, 1 mM EDTA, 10 pg/μL S. pombe total RNA [a generous gift from Julien Berro]) and incubated for 15 min, followed by a second elution with an additional 25μL elution buffer. Both elutions were pooled and purified by ethanol precipitation. 1% input (200ng sheared RNA) was also saved from each sample before enrichment, and 500pg S. pombe total RNA was added as a normalization spike-in.
s4U-Seq library preparation and sequencing
10ng RNA from input and enriched RNA samples was used for library preparation with the SMARTer Stranded Total RNA-Seq Kit – Pico Input Mammalian (Clontech) according to the manufacturer’s instructions. Input and enriched samples were multiplexed with Illumina bar codes and sequenced using single-end 1×75-nt cycles on an Illumina HiSeq instrument.
Mapping and quantification of s4U-Seq libraries
Sequencing reads were aligned using STAR (version 2.4.2a; Dobin 2013) to a joint index of the M. musculus and S. pombe genomes (mm10 and sp2) and transcriptomes (UCSC and Ensembl Fungi v22) 39,40. Alignments and analysis were performed on the Yale High Performance Computing clusters. Following alignment, HTSeq-count (version 0.6.1p1) was used to quantify annotated M. musculus and S. pombe transcripts for total RNA (−t gene) and mRNA (−t exon) 41. Tracks normalized using the S. pombe reads were uploaded to the UCSC genome browser. The scale was normalized using exogenous S. pombe RNA added prior to library preparation.
Transcript abundance, synthesis and degradation rates were estimated using the INSPEcT package in R 42. Spearman correlation between samples were visualized using the corrplot package. Transcripts with significant time-dependent changes were determined and clustered using the maSigPro package in R and heatmaps were made using the pheatmap package 43.
Statistical Analysis
The sample size chosen for our animal experiments in this study was estimated based on our prior experience of performing similar sets of experiments. All animal results were included and no method of randomization was applied. We at least independently repeated the data once, and all attempt to reproduce the results were successful. For all the bar graphs, data were expressed as mean ± SEM. Statistical analyses were performed using GraphPad Prism 6. Differences were analyzed by Student’s t test, or Two-way ANOVA test using GraphPad Prism 6. P values ≤ 0.05 were considered significant (*: P < 0.05; **: P < 0.001; ***: P < 0.0001); P values >0.05; non-significant (NS). FlowJo (Treestar) was used to analyze all the flow cytometry data. The sample sizes (biological replicates), specific statistical tests used, and the main effects of our statistical analyses for each experiment were detailed in each figure legend.
Data Availability Statement
The data that support the findings of this study are available from the corresponding author upon reasonable request. RNA-Seq, Ribosome Profiling, s4U-Seq, and m6A RIP-Seq datasets have been deposited in GEO under the accession number: GSE100048.
Extended Data
Extended Data Figure 1. Abnormal T cell homeostasis in generated Mettl3 CD4-CRE conditional Knockout mice.
a, The two lox sites were inserted into the first and last introns by CRISPR technology. b, Protein levels of METTL3 and its associated METTL14 were analyzed by Western Blot in the naïve T cells and in vitro differentiated Th1, Th2, Th17 cells from Mettl3 KO and WT mice. c, Overall levels of RNA m6A methylation in Naïve T cells from Mettl3 KO and WT mice. d, Naïve T cells increased in all lymphoid organs from Mettl3 KO mice comparing to littermate control WT mice. Cells from spleen (SPL), mesenteric lymph node (mLN), and peripheral lymph node (pLN) were analyzed by FACS by staining with CD4/CD44/CD62L. e, The percentage of CD4+CD44lowCD62+ naïve T cells increased in all three lymphoid organs in Mettl3 KO mice, f, and the total number of naïve T cells in mLN and pLN also increased in KO mice. g, The cell population in the thymus do not have any changes in Mettl3 KO.
Extended Data Figure 2. Naïve T cells from Mettl3 KO mice differentiated into less Th1 and Th17 cells, more Th2 cells ex vivo comparing to WT naïve T cells.
a, Naïve T cells isolated from Mettl3 WT and KO mice were differentiated into effector subsets under defined optimal conditions. b, The percentages of each T cell subtypes over total CD4+ T cells were analyzed by FACS. c, No apoptosis defects were found in ex vivo cultured cells from WT and Mettl3 KO naïve T cells by FACS staining of Annexin V and 7AAD. Double negative stained cells are live cells, and the remaining are apoptotic cells. The percentage is listed in the right graph. d, No proliferation differences were found in ex vivo cultured cells from WT and Mettl3 KO naïve T cells. Naïve T cells labeled with CellTrace were culture ex vivo under different concentration of Anti-CD3/CD28 beads for 4 days. The percentages of proliferating cells were listed in the right graph.
Extended Data Figure 3. m6A methylation function of Mettl3 controls Naïve T cell homeostatic expansion.
a, Mettl3−/− receipts had normal colon length, and Mettl3+/+ receipts had shorter colon length. b, Mettl3+/+ receipts had enlarged spleens indicative of normal homeostatic expansion, while Mettl3−/− receipts have very small spleens. c, All lymph organs have much less transferred KO cells comparing to WT cells analyzed by FACS. d, the percentage of transferred Mettl3 KO and WT cells in Rag2−/− host mice. e, No apoptosis defects were found in in vivo cells recovered from peripheral lymph nodes of Mettl3 WT and KO receipt mice by FACS staining of Annexin V and 7AAD. Double negative stained cells are live cells, and the remaining are apoptotic cells. The percentage is listed in the right graph. f–g, WT Mettl3 constructs, but not m6A catalytic dead Mettl3 constructs, could rescue Mettl3 KO in vivo defect phenotypes. Empty construct (N103), catalytic dead Mettl3 construct (N103-CD), and WT Mettl3 construct (N103-M3) were electroporated into Mettl3 KO Naïve T cells, and then transferred into Rag2−/− mice. Four weeks after transfer, the cell number (proliferation) and CD45RB marker (differentiation) were analyzed by FACS, and representative images were shown in f, and the statistics of cell number were shown in g.
Extended Data Figure 4. Mettl14 KO naïve T cell adoptive transfer pheno-copies Mettl3 KO cells.
a, Mettl14 KO receipt mice have smaller lymphoid organs, including spleen, peripheral lymph nodes, and mesenteric lymph nodes. b–c, The percentage and the number of transferred Mettl14 KO cells in Rag2−/− receipt mice were much less than that of WT cells 4 weeks after transfer in all lymphoid organs. d, The MFI (Median Fluorescence Intensity) of naïve marker CD45RB is much higher in KO than WT, suggesting Mettl14 naïve T cells were locked in naïve state while WT naïve T cells differentiated after 4 weeks in Rag2−/− mice.
Extended Data Figure 5. Socs genes are the m6A targets that contribute to the observed phenotypes.
a, Up-regulated KEGG pathways in Mettl3 KO cells over WT cells based on RNA-Seq data. b, Down-regulated pathways in Mettl3 KO cells over WT cells. c, RT-qPCR validated the RNA-Seq data that the mRNA expression levels of other genes and regulators in IL-7 pathways did not change in Mettl3 KO naïve T cells comparing to WT cells (n=6). d, Socs1 siRNAs knock down Socs1 gene expression by half in vitro. Naïve T cells were incubated with Socs1 or control siRNA in vitro for 3 days, and RT-qPCR was used to measure the mRNA levels of Socs1 gene. e, Socs1, Socs3 and Cish mRNA 3′ UTRs are enriched with m6A peaks from published ESC and Dendritic Cell m6A-RIP genome mapping. Red denotes the IP RNA counts, and Grey denotes input.
Extended Data Figure 6. Ribosome profiling does not reveal any ribosome occupancy differences in IL-7 and TCR signaling related genes.
a, Overall statistical analysis for all genes. Socs genes and other IL-7 pathway genes are highlighted. The y-axis is the log (base2) fold change of Mettl3 KO over WT, and the x-axis plots the p-value of the fold change value. b, Calculated translation efficiency for all genes, and the IL-7 & TCR pathway genes do not show difference in translation efficiency between Mettl3 KO and WT naïve T cells. c, Overall levels of RNA m6A methylation in Naïve T cells from Mettl3 KO and WT mice. c–d, Example ribosome profiles of Socs1 and Socs3 mRNAs, which do not show any significant differences between WT (right panel) and Mettl3 KO (left panel) samples. The RNA-Seq for the inputs are shown below the ribosome profiles, which also demonstrate enhanced mRNA expression for Socs genes.
Extended Data Figure 7. Socs genes are signal inducible degradation-controlled genes.
a, Up-regulated genes in Mettl3 KO Naïve T cells are significantly enriched in the degradation-controlled group of genes from LPS stimulated dendritic cells. We compared the genes differentially regulated by m6A in naïve T cells to degradation controlled genes in dendritic cells. We can assign cluster information to 5784 genes in our sequencing dataset. Looking at the clusters where fast degradation plays a key role (cluster 2, 4 and 6), and asking if the number of genes unregulated is significant, with a chi square test. The p value is < 0.0001. fast deg --- genes in clusters 2,5,6; not fast deg --- all other clusters; Up --- genes unregulated (marked as significant and positive fold change); Not up --- genes that don’t change or are down-regulated. b, Socs1, Socs3, and Cish, but not Socs2 degrade faster upon IL-7 treatment in WT cells, and the faster degradation with IL-7 stimulation is abrogated in Mettl3 KO naïve T cells. The Naïve T cells isolated from both WT or Mettl3 KO mice were pre-treated with Actinomycin-D for 1hr to fully stop transcription before IL-7 stimulation, the residual mRNAs at different time points were normalized back to t=0 (100%).
Extended Data Figure 8. Summary of s4U-Seq data.
a, Analysis of reads mapping to introns demonstrates high intronic read density in s4U-enriched samples. The ratio of reads mapping to introns is expressed as a ratio to the total number of reads that map to each transcript in each sample. b, Plot illustrating the spearman correlations of the transcript-level read frequencies in total and s4U-enriched samples for WT and Mettl3 KO cells at various times after IL-7 stimulation. c, Changes in transcript frequencies after IL-7 stimulation for WT or Mettl3 KO cells with and without s4U enrichment based on s4U-Seq data. Expression levels are presented relative to the transcript levels of WT cells before IL-7 stimulation. Shown are cluster-3 Socs genes and a control gene Xist.
Extended Data Figure 9. Working model for m6A controlled Naïve T cell homeostasis.
a, Mettl3 KO Naïve T cell molecular Mechanism: Loss of m6A lead to slower Socs mRNA degradation and increased SOCS protein levels, which blocked the IL7 pathway. b, Revised T cell differentiation model: m6A targets Socs1, Socs3 and Cish for inducible and rapid mRNA degradation upon IL-7 stimulation, allowing IL-7-JAKs signaling to activate the downstream target STAT5, to initiate the re-programming of the naïve T cells for differentiation and proliferation.
Supplementary Material
Acknowledgments
We thank R. Flynn, R. Jackson, Y. Yang, M. Vesely, R. Paiva, N. Palm and all the other members of the Flavell lab for discussions and comments. We thank J. Alderman, C. Lieber, C. Hughes and J. Stein for technical support. H.-B.L. was supported by NIH T32 2T32DK007356. S.Z was supported by the fellowship from Helen Hay Whitney Foundation-Howard Hughes Medical Institute. This work was supported by the Howard Hughes Medical Institute (R.A.F.), R01-HG004361 (H.Y.C.), NIH New Innovator Award DP2 HD083992-01 (M.D.S.), and a Searle scholarship (M.D.S.).
Footnotes
Supplementary Information is available in the online version of the paper.
Author Contributions H-B. L. conceived the project. H.-B. L., J. T., S. Z., P.B., E.E.D., W.B., G.C., Y. C., G.W., J.P.B. and Y.G.C. performed the experimental work. J.Z., L.K., M.D.S. and P.B. analyzed the RNA-Seq, Ribo-Profiling, s4U-Seq, m6A-Seq data and performed the statistical analysis. H.Y.C., M.D.S., Y.K., and Z.Y. provided key suggestions. H.-B. L. and R.A.F designed the study, analyzed the data and wrote the manuscript. R.A.F supervised the study.
The authors declare no competing financial interests.
References
- 1.Cao G, Li HB, Yin Z, Flavell RA. Recent advances in dynamic m6A RNA modification. Open Biol. 2016;6:160003. doi: 10.1098/rsob.160003. [DOI] [PMC free article] [PubMed] [Google Scholar]
- 2.Fu Y, Dominissini D, Rechavi G, He C. Gene expression regulation mediated through reversible m(6)A RNA methylation. Nature reviews. Genetics. 2014;15:293–306. doi: 10.1038/nrg3724. [DOI] [PubMed] [Google Scholar]
- 3.Geula S, et al. Stem cells. m6A mRNA methylation facilitates resolution of naive pluripotency toward differentiation. Science. 2015;347:1002–1006. doi: 10.1126/science.1261417. [DOI] [PubMed] [Google Scholar]
- 4.Batista PJ, et al. m(6)A RNA Modification Controls Cell Fate Transition in Mammalian Embryonic Stem Cells. Cell stem cell. 2014;15:707–719. doi: 10.1016/j.stem.2014.09.019. [DOI] [PMC free article] [PubMed] [Google Scholar]
- 5.Collins A, Littman DR. Selection and lineage specification in the thymus: commitment 4-stalled. Immunity. 2005;23:4–5. doi: 10.1016/j.immuni.2005.07.003. [DOI] [PubMed] [Google Scholar]
- 6.Esplugues E, et al. Control of TH17 cells occurs in the small intestine. Nature. 2011;475:514–518. doi: 10.1038/nature10228. [DOI] [PMC free article] [PubMed] [Google Scholar]
- 7.Ostanin DV, et al. T cell transfer model of chronic colitis: concepts, considerations, and tricks of the trade. American Journal of Physiology-Gastrointestinal and Liver Physiology. 2009;296:G135–G146. doi: 10.1152/ajpgi.90462.2008. [DOI] [PMC free article] [PubMed] [Google Scholar]
- 8.Martin CE, Frimpong-Boateng K, Spasova DS, Stone JC, Surh CD. Homeostatic proliferation of mature T cells. Methods in molecular biology. 2013;979:81–106. doi: 10.1007/978-1-62703-290-2_9. [DOI] [PubMed] [Google Scholar]
- 9.Takada K, Jameson SC. Naive T cell homeostasis: from awareness of space to a sense of place. Nature reviews. Immunology. 2009;9:823–832. doi: 10.1038/nri2657. [DOI] [PubMed] [Google Scholar]
- 10.Sprent J, Surh CD. Normal T cell homeostasis: the conversion of naive cells into memory-phenotype cells. Nature immunology. 2011;12:478–484. doi: 10.1038/ni.2018. [DOI] [PMC free article] [PubMed] [Google Scholar]
- 11.Yoshimura A, Naka T, Kubo M. SOCS proteins, cytokine signalling and immune regulation. Nature Reviews Immunology. 2007;7:454–465. doi: 10.1038/nri2093. [DOI] [PubMed] [Google Scholar]
- 12.Palmer DC, Restifo NP. Suppressors of cytokine signaling (SOCS) in T cell differentiation, maturation, and function. Trends in immunology. 2009;30:592–602. doi: 10.1016/j.it.2009.09.009. [DOI] [PMC free article] [PubMed] [Google Scholar]
- 13.Surh CD, Sprent J. Homeostasis of Naive and Memory T Cells. Immunity. 2008;29:848–862. doi: 10.1016/j.immuni.2008.11.002. [DOI] [PubMed] [Google Scholar]
- 14.Chong MM, et al. Suppressor of cytokine signaling-1 is a critical regulator of interleukin-7-dependent CD8+ T cell differentiation. Immunity. 2003;18:475–487. doi: 10.1016/s1074-7613(03)00078-5. [DOI] [PubMed] [Google Scholar]
- 15.Cacalano NA, Sanden D, Johnston JA. Tyrosine-phosphorylated SOCS-3 inhibits STAT activation but binds to p120 RasGAP and activates Ras. Nature cell biology. 2001;3:460–465. doi: 10.1038/35074525. [DOI] [PubMed] [Google Scholar]
- 16.Matsumoto A, et al. A role of suppressor of cytokine signaling 3 (SOCS3/CIS3/SSI3) in CD28-mediated interleukin 2 production. The Journal of experimental medicine. 2003;197:425–436. doi: 10.1084/jem.20020939. [DOI] [PMC free article] [PubMed] [Google Scholar]
- 17.Matsumoto A, et al. Suppression of STAT5 functions in liver, mammary glands, and T cells in cytokine-inducible SH2-containing protein 1 transgenic mice. Mol Cell Biol. 1999;19:6396–6407. doi: 10.1128/mcb.19.9.6396. [DOI] [PMC free article] [PubMed] [Google Scholar]
- 18.Yue Y, Liu J, He C. RNA N6-methyladenosine methylation in post-transcriptional gene expression regulation. Genes & development. 2015;29:1343–1355. doi: 10.1101/gad.262766.115. [DOI] [PMC free article] [PubMed] [Google Scholar]
- 19.Schwartz S, et al. Perturbation of m6A Writers Reveals Two Distinct Classes of mRNA Methylation at Internal and 5 ′ Sites. Cell reports. 2014;8:284–296. doi: 10.1016/j.celrep.2014.05.048. [DOI] [PMC free article] [PubMed] [Google Scholar]
- 20.Tani H, Akimitsu N. Genome-wide technology for determining RNA stability in mammalian cells: historical perspective and recent advantages based on modified nucleotide labeling. RNA biology. 2012;9:1233–1238. doi: 10.4161/rna.22036. [DOI] [PMC free article] [PubMed] [Google Scholar]
- 21.Rabani M, et al. Metabolic labeling of RNA uncovers principles of RNA production and degradation dynamics in mammalian cells. Nat Biotech. 2011;29:436–442. doi: 10.1038/nbt.1861. [DOI] [PMC free article] [PubMed] [Google Scholar]
- 22.Rabani M, et al. High-Resolution Sequencing and Modeling Identifies Distinct Dynamic RNA Regulatory Strategies. Cell. 2014;159:1698–1710. doi: 10.1016/j.cell.2014.11.015. doi: http://dx.doi.org/10.1016/j.cell.2014.11.015. [DOI] [PMC free article] [PubMed] [Google Scholar]
- 23.Duffy EE, et al. Tracking Distinct RNA Populations Using Efficient and Reversible Covalent Chemistry. Molecular cell. 2015;59:858–866. doi: 10.1016/j.molcel.2015.07.023. [DOI] [PMC free article] [PubMed] [Google Scholar]
- 24.Henao-Mejia J, et al. Generation of Genetically Modified Mice Using the CRISPR-Cas9 Genome-Editing System. Cold Spring Harb Protoc. 2016 doi: 10.1101/pdb.prot090704. pdb prot090704. [DOI] [PMC free article] [PubMed] [Google Scholar]
- 25.Gagliani N, et al. TH17 cells transdifferentiate into regulatory T cells during resolution of inflammation. Nature. 2015;523:221–U225. doi: 10.1038/nature14452. [DOI] [PMC free article] [PubMed] [Google Scholar]
- 26.Kim D, et al. TopHat2: accurate alignment of transcriptomes in the presence of insertions, deletions and gene fusions. Genome biology. 2013;14:R36. doi: 10.1186/gb-2013-14-4-r36. [DOI] [PMC free article] [PubMed] [Google Scholar]
- 27.Trapnell C, et al. Transcript assembly and quantification by RNA-Seq reveals unannotated transcripts and isoform switching during cell differentiation. Nature biotechnology. 2010;28:511–U174. doi: 10.1038/nbt.1621. [DOI] [PMC free article] [PubMed] [Google Scholar]
- 28.Wang J, Duncan D, Shi Z, Zhang B. WEB-based GEne SeT AnaLysis Toolkit (WebGestalt): update 2013. Nucleic acids research. 2013;41:W77–W83. doi: 10.1093/nar/gkt439. [DOI] [PMC free article] [PubMed] [Google Scholar]
- 29.Wickham H. ggplot2: Elegant Graphics for Data Analysis. Use R. 2009:1–212. doi: 10.1007/978-0-387-98141-3. [DOI] [Google Scholar]
- 30.Shen S, et al. rMATS: robust and flexible detection of differential alternative splicing from replicate RNA-Seq data. Proceedings of the National Academy of Sciences of the United States of America. 2014;111:E5593–5601. doi: 10.1073/pnas.1419161111. [DOI] [PMC free article] [PubMed] [Google Scholar]
- 31.Livak KJ, Schmittgen TD. Analysis of relative gene expression data using real-time quantitative PCR and the 2(−Delta Delta C(T)) Method. Methods. 2001;25:402–408. doi: 10.1006/meth.2001.1262. [DOI] [PubMed] [Google Scholar]
- 32.Dominissini D, Moshitch-Moshkovitz S, Salmon-Divon M, Amariglio N, Rechavi G. Transcriptome-wide mapping of N(6)-methyladenosine by m(6)A-seq based on immunocapturing and massively parallel sequencing. Nature protocols. 2013;8:176–189. doi: 10.1038/nprot.2012.148. [DOI] [PubMed] [Google Scholar]
- 33.Zhang Y, et al. Model-based analysis of ChIP-Seq (MACS) Genome biology. 2008;9:R137. doi: 10.1186/gb-2008-9-9-r137. [DOI] [PMC free article] [PubMed] [Google Scholar]
- 34.Robinson JT, et al. Integrative genomics viewer. Nature biotechnology. 2011;29:24–26. doi: 10.1038/nbt.1754. [DOI] [PMC free article] [PubMed] [Google Scholar]
- 35.Sledz P, Jinek M. Structural insights into the molecular mechanism of the m(6)A writer complex. eLife. 2016;5 doi: 10.7554/eLife.18434. [DOI] [PMC free article] [PubMed] [Google Scholar]
- 36.Clancy MJ, Shambaugh ME, Timpte CS, Bokar JA. Induction of sporulation in Saccharomyces cerevisiae leads to the formation of N6-methyladenosine in mRNA: a potential mechanism for the activity of the IME4 gene. Nucleic acids research. 2002;30:4509–4518. doi: 10.1093/nar/gkf573. [DOI] [PMC free article] [PubMed] [Google Scholar]
- 37.Wang P, Doxtader KA, Nam Y. Structural Basis for Cooperative Function of Mettl3 and Mettl14 Methyltransferases. Molecular cell. 2016;63:306–317. doi: 10.1016/j.molcel.2016.05.041. [DOI] [PMC free article] [PubMed] [Google Scholar]
- 38.Duffy EE, Simon MD. Enriching s4 U-RNA Using Methane Thiosulfonate (MTS) Chemistry. Curr Protoc Chem Biol. 2016;8:234–250. doi: 10.1002/cpch.12. [DOI] [PMC free article] [PubMed] [Google Scholar]
- 39.Rosenbloom KR, et al. The UCSC Genome Browser database: 2015 update. Nucleic acids research. 2015;43:D670–681. doi: 10.1093/nar/gku1177. [DOI] [PMC free article] [PubMed] [Google Scholar]
- 40.Kersey PJ, et al. Ensembl Genomes: an integrative resource for genome-scale data from non-vertebrate species. Nucleic acids research. 2012;40:D91–97. doi: 10.1093/nar/gkr895. [DOI] [PMC free article] [PubMed] [Google Scholar]
- 41.Anders S, Pyl PT, Huber W. HTSeq--a Python framework to work with high-throughput sequencing data. Bioinformatics. 2015;31:166–169. doi: 10.1093/bioinformatics/btu638. [DOI] [PMC free article] [PubMed] [Google Scholar]
- 42.de Pretis S, et al. INSPEcT: a computational tool to infer mRNA synthesis, processing and degradation dynamics from RNA- and 4sU-seq time course experiments. Bioinformatics. 2015;31:2829–2835. doi: 10.1093/bioinformatics/btv288. [DOI] [PubMed] [Google Scholar]
- 43.Nueda MJ, Tarazona S, Conesa A. Next maSigPro: updating maSigPro bioconductor package for RNA-seq time series. Bioinformatics. 2014;30:2598–2602. doi: 10.1093/bioinformatics/btu333. [DOI] [PMC free article] [PubMed] [Google Scholar]
Associated Data
This section collects any data citations, data availability statements, or supplementary materials included in this article.
Supplementary Materials
Data Availability Statement
The data that support the findings of this study are available from the corresponding author upon reasonable request. RNA-Seq, Ribosome Profiling, s4U-Seq, and m6A RIP-Seq datasets have been deposited in GEO under the accession number: GSE100048.


