

SUMMARY
Bone metastasis is a major health threat to breast cancer patients. Tumor-derived Jagged1 represents a central node in mediating tumor-stromal interactions that promote osteolytic bone metastasis. Here, we report the development of a highly effective fully human monoclonal antibody against Jagged1 (clone 15D11). In addition to its inhibitory effect on bone metastasis of Jagged1-expressing tumor cells, 15D11 dramatically sensitizes bone metastasis to chemotherapy, which induces Jagged1 expression in osteoblasts to provide a survival niche for cancer cells. We further confirm the bone metastasis-promoting function of osteoblast-derived Jagged1 using osteoblast-specific Jagged1 transgenic mouse model. These findings establish 15D11 as a potential therapeutic agent for the prevention or treatment of bone metastasis.
In Brief/eTOC
Zheng et al. develop 15D11, a fully human monoclonal antibody to Jagged1, which inhibits Jagged1 on breast cancer cells as well as blocks metastasis-promoting effects of osteoblast-derived Jagged1. 15D11 reduces bone metastasis and sensitizes metastases to chemotherapy in mouse models of breast cancer.
INTRODUCTION
Breast cancer is the most common female malignancy and the second leading cause of cancer-related death in the United States. Among late stage breast cancer patients, more than 70% suffer from bone metastasis, which is often accompanied by severe bone pain, fracture and potentially lethal complications such as hypercalcemia (Weilbaecher et al., 2011). Although radiotherapy, chemotherapy and anti-osteolytic agents such as bisphosphonate and RANKL antibody denosumab can reduce morbidity associated with bone metastasis, these treatments often do not significantly extend the survival time of the patients or provide a cure (Weilbaecher et al., 2011), as metastatic cancers often acquire resistance to these treatments.
Tumor-stromal interaction plays a major role in promoting bone metastasis of breast cancer (Weilbaecher et al., 2011). The bone microenvironment contains a great variety of stromal cell types, such as osteoblasts, osteoclasts, mesenchymal stem cells (MSCs), and hematopoietic cells. While previous research has focused on the cross-communication between breast cancer cells and bone resorbing osteoclasts, the contributions of other stromal cell types to bone metastasis are less studied. Among the supporting stromal cells, bone-building osteoblasts have recently been shown to constitute an osteogenic niche that is critical for the survival and colonization of disseminated tumor cells in the bone (Shiozawa et al., 2011; Wang et al., 2015). Despite these recent progresses, our molecular understanding of the interaction between tumor cells and osteoblastic cells in the bone niche remain largely incomplete. For example, how such tumor-niche interactions contribute to the resistance of metastatic breast cancer to standard bone metastasis treatments, such as chemotherapy, remains poorly understood.
In human breast cancer, elevated expression of Jagged1 and Notch1, but not other Notch pathway ligands or receptors, is significantly associated with poor prognosis (Reedijk et al., 2005; Sethi et al., 2011). Our previous study identified tumor-derived Jagged1 as a bone metastasis-promoting factor by activating Notch signaling in osteoblasts to increase the production of Interleukin-6 (IL6) and connective tissue growth factor (CTGF), which feeds back to tumor cells to promote proliferation and survival. Meanwhile, Jagged1 stimulates osteoclastogenesis and bone degradation, leading to the release of bone-derived growth factors including TGF-β, a potent inducer of Jagged1 expression in tumor cells, thus forming a positive feedback cycle (Sethi et al., 2011).
Besides Jagged1’s role in tumor-stromal interaction during bone metastasis progression, tumor- or stromal-derived Jagged1 has also been reported to induce angiogenesis, invasion, therapy resistance, and cancer stem cell renewal in lymphoma, colorectal cancer, and many other cancer types (Li et al., 2014). Endothelium-derived Jagged1 promotes Notch activation in B cell lymphoma, leading to extra-nodal invasion and chemoresistance (Cao et al., 2014). In colorectal cancer, a soluble form of Jagged1 derived from endothelial cells induces a cancer stem cell-like phenotype in colorectal cancer (Lu et al., 2013). These multi-functional roles of Jagged1 in different cancer types support the development of Jagged1 targeting therapeutics for cancer treatments.
Several therapeutic strategies have been developed to target the Notch signaling pathway. Most of the inhibitors were designed to target γ–secretase, which mediates the proteolytic cleavage of Notch receptors to generate signal-transducing Notch intracellular domain (NICD), a necessary step in Notch pathway activation upon ligand binding (Rizzo et al., 2008). However, γ-secretase inhibitor (GSI) has been reported to induce severe gastrointestinal (GI) tract toxicity (Imbimbo, 2008), preventing further clinical development of this class of inhibitors. Targeting individual Notch receptor or ligand can potentially achieve therapeutic effect without causing severe GI tract toxicity.
RESULTS
Generation and characterization of a fully human monoclonal antibody against Jagged1
We utilized the XenoMouse technology to generate fully human monoclonal antibodies against Jagged1. These mice have the endogenous mouse immunoglobulin loci inactivated and large transgenes introduced that are capable of recombination and fully human antibody repertoire development (Mendez et al., 1997). In brief, we immunized XenoMouse animals, including strains XMG2KL and XMG4KL (Kellermann and Green, 2002) with Chinese hamster cells (CHO) cells transiently expressing human Jagged1 to generate large panels of antibodies. Cell based fluorometric microvolume assay technology (FMAT) was used to analyze the specific binding of these antibodies to cell surface human Jagged1 protein. These antibodies were then counter screened to exclude cross-reactive binding to other major Notch ligands, including human Jagged2 and Dll4 (Figure S1A). In order to identify a suitable antibody antagonist that could be used for murine in vivo studies, the most potent blockers of the Notch receptor interaction were then further assayed for cross-reactive binding to murine Jagged1. Antibody clone 15D11 is of particularly high affinity to the murine Jagged1 protein with an approximate dissociation constant (Kd) of 23 pM in the enzyme kinetic exclusion assay (KinExA) (Figure 1A). Using a Notch luciferase reporter assay, we determined that 15D11 has a half maximal inhibitory concentration (IC50) of 3.63 nM to human Jagged1 and 14.07 nM to murine Jagged1 (Figure 1B and data not shown).
Figure 1. Characterization of fully human monoclonal antibodies against Jagged1.

(A) Kinetic exclusion assay for binding of 15D11 with murine Jagged1 protein. Increasing number (1.5×10² to 9×10⁶) of 293T cells with murine Jagged1 expression (Clone #1) were added into the solution with fixed amount of 15D11 antibody (10 or 100 pM) and remaining amount of antibody in the liquid was determined after 4 hr. (B) A Notch reporter luciferase assay was used to determine IC50 for 15D11 in Jagged1-induced Notch activation. Human TE671 expressing a multimerized 7XCSL-responsive element upstream of a minimal promoter (Notch reporter) were co-cultured with HEK293 expressing Jagged1. 15D11 (0.07–1333.4 nM) was added to the cells for 2 days. Luciferase signal was quantified. The percent inhibition was calculated relative to signals of reactions lacking 15D11 and 293T co-culture. (C) RAW264.7 pre-osteoclast cells were seeded on Fc- or recombinant Jagged1 coated plates in the presence of 5 ng/ml RANKL and indicated concentrations of IgG or 15D11. Cells were cultured for 5–7 days before fixing for TRAP staining to visualize multi-nucleated mature osteoclasts. (D) Quantification of TRAP+ osteoclasts per field from C. Data is presented as mean ± SEM. n = 3. **p<0.01 by Student’s t-test. n.s., not significant. (E) SCP28-Vector or SCP28-Jagged1 cells were co-cultured with RAW264.7 cells in the presence of 5 ng/ml RANKL and 1 μg/ml IgG or 15D11. Cells were cultured for 5–7 days before fixing for TRAP staining to visualize multi-nucleated mature osteoclasts. (F) Primary bone marrow cells were flushed from tibias of 4–6 week old wild-type FVB mice and plated for 24 hr, after which the non-adherent cells were collected and cultured in M-CSF (50 ng/mL) for 2 days and then co-cultured with SCP28-Vector or SCP28-Jagged1 in the presence of RANKL (20 ng/mL) and 1 μg/ml IgG or 15D11. Cells were allowed to differentiate into osteoclasts for additional 4–5 days before fixing and TRAP staining. (G) mRNA expression of mouse Il6 and Hes1 in MC3T3 cells co-cultured with SCP28-vector control or SCP28-Jagged1 cells, treated with either IgG control or 15D11. Primers used in this experiment were specifically designed to only detect mouse genes, but not human genes. n = 3. **p<0.01 by Student’s t-test. Data is presented as mean ± SEM. (H) Expression of IL6 protein in cell lysate and conditioned media (CM) taken from MC3T3 cells co-cultured with SCP28-Vector or SCP28-Jagged1 cells (left). Recombinant IL6 served as positive control. IL6 protein expression in CM from MC3T3 cells co-cultured with SCP28-Vector or SCP28-Jagged1 cells, treated with either IgG control or 15D11 antibody (right). β-actin served as loading control. Bars below the IL6 immunoblots represent relative band density of IL6 as quantified by ImageJ software. Scale bars in C, E, and F: 100 μm. See also Figure S1.
When administrated in vivo (10 mg/kg, twice a week), 15D11 displayed minimal general toxicity based on body weight measurement, in contrast to significant weight loss of mice treated with GSI (Figure S1B). Hematoxylin and Eosin staining (H&E) and Alcian blue staining revealed no obvious GI track toxicity after 15D11 treatment, compared to significant goblet cell metaplasia seen in GSI-treated animals (Figure S1C and S1D). To analyze liver toxicity, we measured the activity of Alanine Aminotransferase (ALT) and Aspartate Aminotransferase (AST) in the sera of these mice after the respective drug treatments. As a positive control, CCl4 treatment induced dramatic increase of ALT and AST activity (Figure S1E and S1F), while no change was observed after 15D11 or GSI treatment. A complete blood count (CBC) test further indicated no significant hematologic toxicity of 15D11 (Figure S1G). Analysis of T cell population and activation status also did not reveal any difference between the IgG or 15D11 treatment groups (Figure S1H–K). Taken together, these results indicate that 15D11 is a specific Jagged1-targeting agent with excellent safety profile for in vivo application.
Our previous study demonstrated that tumor-derived Jagged1 promotes the differentiation of monocytic pre-osteoclast into mature osteoclasts (Sethi et al., 2011). We developed an in vitro assay to test the potential inhibitory effect of 15D11 on Jagged1-dependent osteoclastogenesis. RAW264.7, a monocyte/macrophage cell line with the ability to differentiate into osteoclasts, were seeded on either Fc-coated or recombinant Jagged1 (rJagged1) coated plates with low level of RANKL (5 ng/ml), a concentration that is not sufficient to induce osteoclast differentiation (Ell et al., 2013). Within 5 days, large multi-nuclear mature osteoclasts were generated on rJagged1-coated plates, but only limited numbers can be seen on Fc-coated plates. Furthermore, such Jagged1-dependent osteoclast differentiation was completely blocked by 15D11 (Figure 1C and 1D). Similar results were observed when using bone marrow-derived primary pre-osteoclasts in the assay (Figure 1E and Figure S1L). To more closely mimic osteoclastogenesis induced by tumor-derived Jagged1, we co-cultured RAW264.7 cells with SCP28 cells, a MDA-MB-231 derivative cell line with moderate bone metastatic ability that has been stably labeled with luciferase and GFP (Kang et al., 2003), with or without stable overexpression of Jagged1. Administration of 15D11 also inhibited osteoclast differentiation in this co-culture assay (Figure 1F and Figure S1M).
Another previously reported mechanism for tumor-derived Jagged1 to promote bone metastasis is through increasing IL6 production from osteoblasts (Sethi et al., 2011). As previously reported, co-culture of SCP28 with the mouse MC3T3 osteoblast cell line led to elevated expression of IL6 in a Jagged1-dependent manner (Figure 1G and 1H). Administration of 15D11 in tumor-osteoblast co-culture significantly repressed the expression of the Notch induced gene Hes1 (detected by species-specific qRT-PCR) (Figure 1G), as well as IL6 expression at both the mRNA and protein levels (Figure 1G and 1H). Taken together, these in vitro experiments confirm that 15D11 effectively blocks Jagged1-Notch signaling activities that are important for bone metastasis development.
15D11 antibody attenuates bone metastasis of Jagged1-expressing tumor cells
To evaluate the therapeutic effect of 15D11 on bone metastasis, we turned to a well established xenograft model for bone metastasis by using SCP28 cells. SCP28 has a low basal level of Jagged1 expression, and ectopic overexpression of Jagged1 in SCP28 has been demonstrated to enhance its bone metastatic ability (Sethi et al., 2011). Tumor cells were inoculated via intracardiac (IC) injection into athymic nude mice to generate bone metastasis. We initiated the 15D11 antibody treatment one day before tumor cell injection and continued the treatment twice a week. Bone metastasis was monitored by weekly bioluminescence imaging (BLI) until mice were euthanized at the end of experiment (~5 weeks) for histopathological analysis (Figure 2A). We also used the decoy receptor for RANKL, OPG-Fc (equivalent to clinically approved RANKL blocking antibody denosumab) to block osteoclast differentiation as the positive control in the experiment. Jagged1 overexpression led to a significant increase in bone metastasis burden (Figure 2B and 2C), consistent with our previous report (Sethi et al., 2011). BLI analysis revealed a ~5 folds decrease in SCP28-Jagged1 bone metastasis in mice treated with 15D11 compared to IgG control group. As expected, OPG-Fc treatment also decreased the bone metastasis burden of mice (Figure 2B and 2C). X-ray imaging of the hind limbs of mice injected with SCP28-Jagged1 revealed significantly more osteolytic areas compared to mice injected with the control SCP28 cells, a phenotype that can be reversed by 15D11 treatment (Figure 2B and 2D). While OPG-Fc treatment also protected bone from osteolysis, it also led to an abnormal increase of the trabecular bone density as observed by X-ray and microcomputer tomography (μCT) analysis (Figure 2D–E and Movies S1–4). Consistently, tartrate-resistant acid phosphatase (TRAP) immunostaining of bone sections indicated an almost complete absence of osteoclasts in mice treated with OPG-Fc (Figure 2E). Interestingly, while Jagged1 overexpressing SCP28 promoted the recruitment of mature osteoclasts in the bone lesions, a considerable number of osteoclasts can still be observed in mice treated with 15D11 (Figure 2E and Figure S2A). Importantly, there was no abnormal increase of trabecular bone density in 15D11-treated animals, in contrast to OPG-Fc treated mice (Figure 2E). Taken together, these results suggest that 15D11 inhibits pathological activation of osteoclasts by tumor-derived Jagged1 but spares normal osteoclast activities needed to maintain normal bone homeostasis.
Figure 2. 15D11 inhibits tumor-derived Jagged1 dependent bone metastasis.

(A) Schematic representation of the experiment. 105 tumor cells were IC injected into each mouse. Mice were treated one day before the tumor cell injection and continued twice a week at the dosage of 10 mg/kg for IgG/15D11, and 3 mg/kg for OPG-Fc. (B) Representative BLI and X-ray images on Day 1 immediately after the IC injection and on Day 35 at the end point of the experiment. (C) Quantification of bone metastasis burden each week based on BLI imaging from the experiment. n = 10 per group; data presented as mean ± SEM. *p<0.05 by Mann-Whitney test. (D) Quantification of osteolytic lesions on Day 35. n = 8 per group; data presented as mean ± SEM. **p<0.01 by Student’s t-test. AU: arbitrary units. (E) Representative μCT, H&E staining and TRAP staining images from the experiment. T: tumor; B: bone. Scale bars: 100 μm for H&E and 25 μm for TRAP. See also Figure S2–3 and Movies S1–4.
To test the therapeutic effect of 15D11 on established bone metastasis, we used the SCP2 cell line, an extremely aggressive bone metastatic variant of MDA-MB-231 with a high level of endogenous Jagged1 expression (Sethi et al., 2011). The SCP2 cells rapidly generated multiple osteolytic bone metastases within 1 week after IC injection into nude mice, which often results in mortality within 4 weeks. We initiated twice weekly injection of 15D11 one week after IC injection of SCP2 cells when bone metastases were well established (Figure S2B). In this model of late treatment of aggressive bone metastasis, we detected a trend of reduced bone metastasis by either 15D11 or OPG-Fc treatment alone compared to the control group (Figure S2C and S2D), although neither of them reach statistical significance at the end point of the experiment (4 weeks) when the mice succumbed to metastatic cancers. Combinatory treatment of 15D11 and OPG-Fc resulted in a significant ~5-fold decrease of bone metastasis 3 weeks after the initiation of treatments, indicating the benefit of targeting two different molecular mediators of bone metastasis (Figure S2C and S2D). Similar to the preventive treatment protocol, 15D11 treatment reduced the number of osteoclasts and decreased osteolytic bone areas, although some basal level of osteoclasts can still be observed, as compared to the near complete absence of osteoclasts in mice treated with OPG-Fc (Figure S2E–G).
Jagged1 has been extensively studied for its role in developmental angiogenesis (Benedito et al., 2009). Therefore, we tested the inhibitory effect of 15D11 on angiogenesis by using two different angiogenesis models. In both neonatal mouse retina and subcutaneous xenograft tumor angiogenesis assays (Polverino et al., 2006; Ridgway et al., 2006), 15D11 treatment showed no effect on angiogenesis (Figure S3A–S3D). Therefore, it is unlikely 15D11 reduces bone metastasis through inhibiting angiogenesis.
15D11 sensitizes bone metastases to chemotherapy
Chemotherapy is commonly used to manage bone metastasis, although bone lesions are usually more refractory to chemotherapy (Gu et al., 2004). To evaluate the combinatorial effect of 15D11 with conventional chemotherapy, we treated bone metastasis generated by SCP28-Jagged1 cells with 15D11 and paclitaxel, using the late treatment protocol (treatment initiated 1 week after IC injection) (Figure 3A). The mouse group injected with SCP28-Jagged1 progressed slowly to the moribund state compared to mouse group injected SCP2 (7 weeks compared to 4 weeks with SCP2), which provided us with a sufficient time to observe the therapeutic effect of single or combinatory treatment of 15D11 and paclitaxel. Mice were treated with IgG, 15D11, paclitaxel or both, one week after IC injection of SCP28-Jagged1 to establish bone metastases. Monotherapy using 15D11 resulted in a nearly 10-fold reduction of metastasis burden (Figure 3B). While paclitaxel alone significantly slowed down bone metastasis progression at early time points, resistance to chemotherapy emerged at later time points, resulting in only a mild reduction of tumor burden at the end point of the experiment (Figure 3B). Strikingly, when mice were treated with both 15D11 and paclitaxel, a synergistic >100-fold reduction of bone metastasis was observed compared to the IgG control group (Figures 3B and 3C). X-ray images and TRAP staining for osteoclasts confirmed significant decrease of osteoclast number and osteolytic lesions after 15D11 treatment alone or combined with chemotherapy (Figure 3C–F). In particular, there is almost no osteolytic bone area in the combined treatment group, consistent with the BLI data. Taken together, these results demonstrate a potent synergistic effect of combined treatment of paclitaxel and 15D11 in diminishing bone metastasis generated by SCP28-Jagged1.
Figure 3. Synergistic inhibition of SCP28-Jagged1 bone metastasis with combined treatment of 15D11 and chemotherapy.

(A) Schematic representation of the experiment. 105 tumor cells were IC injected into each mouse. Treatments were initiated one week after the injection and continued twice a week at the dosage of 10 mg/kg for IgG/15D11, and 20 mg/kg for paclitaxel. (B) Quantification of bone metastasis burden each week based on BLI imaging. n = 10 mice per group; data presented as mean ± SEM. *p<0.05 and **p<0.01 by Mann-Whitney test. (C) Representative BLI and X-ray images of two mice per group at week 7. (D) Representative H&E and TRAP staining images from the experiment at the end point. Scale bar: 100 μm for H&E and 50 μm for TRAP. (E) Quantification of osteolytic lesions based on X-ray images from D. n = 10 mice per group; data presented mean ± SEM. **p<0.01 by Student’s t-test. AU: arbitrary units. (F) Quantification of TRAP+ osteoclasts from decalcificed histological bone sections of hind limbs from mice in D, n = 10 per group. Data is presented as mean ± SEM. **p<0.01 by Student’s t-test.
This strong inhibitory effect of the combined treatment on bone metastasis could potentially be explained by the combined effect of blocking Jagged1-dependent stromal engagement by 15D11 and cytotoxicity of paclitaxel to tumor cells. If this is indeed the case, no synergistic therapeutic benefit should be expected when chemotherapy is combined with 15D11 for the treatment of bone metastasis generated by tumor cells with low or no Jagged1 expression. We thus used the parental SCP28 cells, which has very low endogenous Jagged1 level (Figure S4A), to test this directly. We performed the same bone metastasis and treatment experiments as we did with SCP28-Jagged1 (Figure 4A). Paclitaxel initially reduced bone metastasis burden, but the lesions quickly become refractory to chemotherapy and only slightly reduced metastatic burden (Figures 4B and 4C). As expected from the lack of Jagged1 expression in SCP28, 15D11 had no effect on reducing bone metastasis burden by SCP28 (Figures 4B and 4C). To our surprise, the combined treatment group displayed a dramatic reduction of bone metastasis burden, decreased osteolytic bone lesion areas and reduced osteoclast number (Figure 4B–F). Such a therapeutic response is far superior than single treatment of either paclitaxel or 15D11 alone, suggesting a synergy of targeting Jagged1 along with chemotherapy for bone metastasis even in in tumor cells with low level of Jagged1 expression.
Figure 4. Synergistic inhibition of SCP28 bone metastasis with combined treatment of 15D11 and chemotherapy.

(A) Schematic illustration of the experimental procedure. 105 tumor cells were IC injected into each mouse. Treatments were initiated one week after the injection and continued twice a week at the dosage of 10 mg/kg for IgG/15D11, and 20 mg/kg for paclitaxel. (B) Quantification of bone metastasis burden based on BLI imaging. n = 10 mice per group; data presented as mean ± SEM. *p<0.05 and **p<0.01 by Mann-Whitney test. (C) Representative BLI images and X-ray images at week 6 of two mice per group. (D) Representative H&E and TRAP staining images from the experiment at the end point. Scale bar: 100 μm for H&E and 50 μm for TRAP. (E) Quantification of osteolytic lesions based on X-ray images from D. n = 10 mice per group. Data is presented as mean ± SEM. **p<0.01 by Student’s t-test. AU: arbitrary units. (F) Quantification of TRAP+ osteoclasts from decalcified histological bone sections of hind limbs from mice in D, n = 10 per group. Data presented as mean ± SEM. **p<0.01 by Student’s t-test. See also Figure S4.
To validate whether the observed synergy of combined treatment can also be observed in other models of bone metastasis beyond the MDA-MB-231 series, we used the bone metastatic SUM1315-M1B1 cell line, which has been recently developed in our laboratory by in vivo selection for increased bone metastatic propensity (manuscript in preparation) from the parental SUM1315 breast cancer cell line (Forozan et al., 1999). SUM1315-M1B1 has a similarly low basal level of Jagged1 expression as SCP28 (Figure S4A). Again, a significant reduction of bone metastasis burden, osteolytic lesion area, and osteoclast numbers was only observed in mice treated with both paclitaxel and 15D11 (Figure S4B–G). Taken together, we identified a potent synergistic inhibitory effect on bone metastasis by combining chemotherapy and 15D11, and such therapeutic synergy is not dependent on high expression level of Jagged1 in tumor cells.
Chemotherapy induces Jagged1 expression in osteoblast lineage cells
We considered the possibility that chemotherapy agents may induce Jagged1 expression in either tumor cells or in the bone stromal cells. Such chemotherapy-induced Jagged1 might contribute to the resistance of bone metastasis to chemotherapy and can be targeted by 15D11, as we saw in the combined treatment. Key stromal cell types in bone metastasis include osteoclasts, osteoblasts and their progenitors (such as MSCs), and endothelial cells. We tested if Jagged1 could be induced in these cells and various breast cancer cell lines upon treatment of two different chemotherapy agents, paclitaxel and cisplatin, which are commonly used in the treatment of breast cancer. Jagged1 expression was significantly increased only in MC3T3-E1 pre-osteoblast cell and MSCs (Ren et al., 2008) (Figure 5A). There was no significant induction of Jagged1 in endothelial cells, RAW 264.7 pre-osteoclasts, or in SCP28 and SUM1315-M1B1 tumor cells (Figure 5A).
Figure 5. Chemotherapy induces Jagged1 expression in osteoblast lineage cells.

(A) Jagged1 mRNA expression in osteoblast (OB) MC3T3-E1-Clone#4 osteoblast cells and mesenchymal stem cells (MSC), HPMECL endothelial cells (endo), RAW264.7 pre-osteoclasts (pre-OC), and SCP28 and SUM1315-M1B1 breast tumor cells 48 hr post-treatment with 25 nM paclitaxel or 10 μM cisplatin. n = 3 per group; data presented as mean ± SEM. *p<0.05 by Student’s t-test. (B) Athymic nude mice were intravenously (i.v.) injected with PBS or cisplatin (2 mg/kg) and euthanized 48 hr later. Hind limb bones were collected for IF staining against ALP (green) and Jagged1 (red). Nuclei were counter-stained with DAPI (blue). (C–E) Athymic nude mice were treated with either PBS or cisplatin (2 mg/kg) on Day 0. One day after the pre-treatment, MCF7 (C), SUM1315-M1B1 (D) or SCP28 (E) cells were delivered locally to the hind limbs of these mice by IIA injection. BLI imaging and quantification of BLI signal at Day 4. n = 5; data presented as mean ± SEM. *p<0.05 by Student’s t-test. (F) Mice from experiment in E were euthanized after BLI imaging at Day 4. Hind limbs were fixed and processed for IF imaging of GFP-expressing tumor cells (green) and ALP+ osteoblasts (red). Scale bar: 80 μm. See also Figure S5 and Movies S5–6.
To confirm this finding in vivo, female nude mice were treated with either PBS or cisplatin. Hind limb bones were dissected 48 hr later and immuno-stained with antibodies against Jagged1 and alkaline phosphatase (ALP), a marker for osteoblast cells. In the PBS control group, Jagged1+ cells were rarely detected and mostly co-localized with ALP+ osteoblasts. Cisplatin treatment induced much stronger Jagged1 expression based on immunostaining analysis, and these Jagged1+ cells again mostly overlapped with ALP+ cells (Figure 5B). This result thus indicates that chemotherapy induces Jagged1 expression in osteoblast cells in vivo.
We next sought to understand which signaling pathway is responsible for Jagged1 induction after chemotherapy in osteoblast lineage cells. Chemotherapy generates many stress responses in cells, including endoplasmic reticulum stress (ER stress) and oxidative stress. Some of the stress conditions have been associated with the regulation of Jagged1 expression (Paul et al., 2014). We utilized several treatments to mimic or inhibit these stress responses and then analyzed Jagged1 mRNA and protein levels within the cells. Among these treatments, we detected that ascorbate, which induces oxidative stress when used at high concentration, and H2O2 induced strong Jagged1 expression in MSCs, while ER stress inducers Brefeldin A (BFA) and Tunicamycin did not induce Jagged1 expression (Figure S5A and S5B). Consistent with this observation, cisplatin and docetaxel induced ROS production in MSCs, which could be completely blocked by N-Acetyl Cysteine (NAC), an ROS inhibitor (Figure S5C). Administration of NAC also completely blocked cisplatin-induced Jagged1 expression in MSCs (Figure S5D). These results indicate that Jagged1 is induced in osteoblastic lineage cells during chemotherapy, likely through the ROS pathway.
Osteoblast-derived Jagged1 promotes bone metastatic seeding and chemoresistance
To directly test the effect of increased Jagged1 expression in osteoblasts on bone metastasis seeding and progression, we utilized two models. In the first model, athymic nude mice were either treated with PBS or cisplatin, which has a much shorter half-life than paclitaxel. One day later, we inoculated tumor cells to the hind limbs using the intra-iliac artery injection (IIA) method (Wang et al., 2015) to specifically study the stromal effect on bone metastasis seeding after chemotherapy, as tumor cells were not exposed to clinical dose of cisplatin in this experimental setting. In all three different cancer cell lines tested (MCF7, SCP28 and SUM1315-M1B1), there was a significant increase of bone metastatic seeding (Figures 5C–E). Immunostaining confirmed that there were significantly more GFP-positive tumor cells in the bone among mice pre-treated with cisplatin, and these tumor cells are usually located in close proximity to ALP+ osteoblasts (Figure 5F and Movies S5–6).
Since chemotherapy may have broad systemic effects on mice that may directly or indirectly influence the outcome of the experiment that we described above, we decided to use an alternative approach to specifically increase Jagged1 expression in osteoblasts without using chemotherapy. To this end, we generated a transgenic mouse strain with osteoblast-specific Jagged1 overexpression driven by the Col1a1 promoter (Figure S6A and S6B). The Col1a1-Jag1 mice are generally healthy and fertile (detailed report in a separate manuscript under preparation), but developed a significant shortening and swelling of bone in the middle region of both femur and tibia (Figure S6C). μCT imaging and bone histology analysis showed decreased bone density and highly trabecularized bone in the cortical bone area, there was also significant decrease of bone density in trabecular bone region (Figure 6A and data not shown). We also found excessive TRAP-positive osteoclasts in the cortical bone of Col1a1-Jag1 mice (Figure 6B), consistent with the previously reported function of Jagged1 in promoting osteoclastogenesis (Sethi et al., 2011). After Col1a1-Jag1 mice were treated with 15D11 for three months, excessive TRAP-positive osteoclasts in Col1a1-Jag1 mice were reduced significantly, confirming that the phenotype in this mouse strain is indeed caused by osteoblast-derived Jagged1 (Figure 6B).
Figure 6. Osteoblast-derived Jagged1 promotes bone metastasis seeding and progression.

(A) Representative μCT imaging and H&E staining images from FVB WT and Col1a1-Jag1 mice. Yellow box: Trabecular bone areas of decreased bone density (in μCT imaging) that were filled with bone marrow cells (in H&E staining). Scale bar: 0.5 mm in μCT and 200 μm in H&E. (B) Col1a1-Jag1 mice were treated with IgG or 15D11(10 mg/kg) twice a week for 3 months. Mice were then euthanized for bone sample collection and histology analysis. Representative TRAP staining images from IgG or 15D11 group were presented. Scale bar: 200 μm. (C) PyMT-A-FIG cells were delivered locally to the hind limbs of WT and Col1a1-Jag1 mice by intra-tibial injection. Three weeks after injection, the engraftment of breast cancer cells in the bone was assessed by BLI. Each data point represents an individual mouse (n = 4); horizontal line represents mean ± SEM. **p<0.01 by Student’s t-test. (D) PyMT-A-FIG cells were delivered locally to the hind limbs of WT and Col1a1-Jag1 mice by IIA injection. Tumor cells in the bone were quantified based on BLI imaging at Day 1 and Day 4 (right panel). n = 5; data presented mean ± SEM. *p<0.05 by Student’s t-test. (E) IF staining of bone samples at Day 4 from experiment in C, showing GFP-expressing tumor cells (green) and ALP+ osteoblasts (red). Scale bar: 80 μm. See also Figure S6.
Next, we tested the long-term bone metastasis progression and short-term metastatic seeding on these mice. For the long-term bone metastasis assay, we used the syngeneic PyMT-A-FIG cell line previously established in our lab from a MMTV-PyMT mammary tumor (Wan et al., 2014) and stably labeled with the Firefly-IRES-GFP (FIG) reporter to facilitate in vivo tracking. PyMT-A-FIG cells were inoculated to wild-type (WT) or Col1a1-Jag1 mice via intra-tibial (IT) injection to generate bone metastasis. BLI analysis showed a nearly 20-fold increase of bone metastasis tumor burden in Col1a1-Jag1 mice than that in WT mice (Figure 6C). To test the short-term bone metastasis seeding, we injected PyMT-A-FIG cells by IIA into either Col1a1-Jag1 mice or WT mice. Four days after tumor inoculation, there were already ~3 times more tumor cells surviving in the bone of Col1a1-Jag1 mice than in WT mice (Figure 6D). Immunostaining revealed more seeding of GFP-positive tumor cells in bone of Col1a1-Jag1 mice, often in close contact with ALP+ osteoblasts (Figure 6E). Taken together, these results confirmed that osteoblast-derived Jagged1 promotes bone metastatic seeding and outgrowth.
To mimic chemoresistance and tumor seeding effects by osteoblast lineage cells in vitro, we adapted an in vitro 3D tumor-stroma co-culture assay (Wang et al., 2015). Consistent with the previous report, when tumor cells were co-cultured with osteoblast lineage cells in low attachment plates, they generated heterotypic spheres, with tumor cells forming an outside shell-like structure and osteogenic cells forming an inner core sphere (Figure S7A). There was increased survival of co-cultured tumorspheres compared to tumor-only spheres when treated with cisplatin or docetaxel (a potent form of paclitaxel) (Figure 7A), suggesting that osteoblast lineage cells promote the survival of tumor cells during chemotherapy. To examine cellular apoptotic pathway status, cell lysates were collected from either SCP28 culture alone or in co-culture with MC3T3 cells. Seventy-two hr post-treatment of cisplatin, there was a strong induction of cleaved PARP and cleaved Caspase-3 (CC3) CC3 in SCP28 singe-cultured cells, while the level of these apoptotic pathway-related proteins was still at low levels in co-culture samples (Figure 7B). To determine whether direct cell-cell contact is needed for the observed chemoresistance, we collected conditioned media (CM) from cisplatin-treated MSCs and performed the same assay. We found tumor cells were only partially protected from chemotherapy in the presence of CM compared to higher resistance to chemotherapy of tumor cells co-cultured with MSCs (Figure S7B). This result indicates that the direct tumor-stromal cell contact, which is required for Notch signaling, is needed for optimal Jagged1-mediated chemoresistance. Indeed, when we analyzed Notch downstream gene expression in co-cultured tumor cells after either cisplatin or docetaxel treatment, we found multiple Notch downstream genes, including human HES2, HEY1, and HEY2, were significantly upregulated in co-culture tumors cells after chemotherapy (Figure 7C). Co-culture of tumor cells with endothelial cells provided no protective effect during cisplatin or docetaxel treatment (Figure S7C–D), suggesting that only osteoblast lineage cells, but not endothelial cells, protect tumor cells against chemotherapy in the bone.
Figure 7. Pro-survival effect of osteoblast Jagged1 on cancer cells can be blocked by 15D11.

(A) 3-D tumorsphere culture of MCF7, SCP28, and SUM1315-M1B1 cells, alone or in co-culture with osteoblast cells, were treated with indicated concentrations of cisplatin or docetaxel. Two days after the chemotherapy, the surviving tumor spheres were counted under the fluorescent microscope. n = 3 per group; data presented as mean ± SEM. *p<0.05 by Student’s t-test. (B) Cell culture of SCP28 cells alone or in co-culture with MC3T3-E1 pre-osteoblast cells were treated with PBS or cisplatin. Protein samples were collected at 6 hr, 24 hr, and 72 hr later. Cleaved PARP and cleaved caspase-3 were determined by immunoblotting. Full length PARP is 116 kD and cleaved PARP is 89 kD. (C) Real-time PCR analysis of Notch target genes (HEY1, HEY2, and HES2) in tumor cells co-cultured with MSC and treated with indicated chemotherapeutic agents. n = 3 per group; data presented as mean ± SEM. *p<0.05 by Student’s t-test. (D) Microarray analysis was performed with mRNA from cell culture of SUM1315-M1B1cells alone or in co-culture with MC3T3-E1 osteoblasts, with or without cisplatin treatment. Heatmap shows 16 apoptosis-related genes with at least 2-fold change in the cisplatin treatment condition (tumor cell culture alone vs. co-culture). Five p53 pathway-related genes were highlighted in red. (E–F) 105 SCP28 cells were IC injected into each mouse. Treatments were initiated one week after the injection for twice at the dosage of 10 mg/kg for IgG/15D11, and 20 mg/kg for paclitaxel. Hind limb bones were collected, fixed and cryo-sectioned for IF staining against CC3 for apoptotic cells and GFP for tumor cells (E), and CC3 positive apoptotic cells among GFP-positive tumor cells were quantified in F. Scale bar: 25 μm. n = 5 mice per group; data presented as mean ± SEM. **p<0.01 by Student’s t-test. (G) Athymic nude mice were treated with either PBS or cisplatin via i.v. injection on Day 0. On Day 1, PBS pre-treated mice were treated with IgG, while cisplatin pre-treated mice were treated with either IgG or 15D11. SUM1315-M1B1 cells were delivered locally to the hind limbs of these nude mice by IIA injection. Tumor cells in the bone were quantified based on BLI imaging on Day 1 and Day 4. BLI signal at Day 4 was normalized to BLI signal intensity at Day 1 (lower panel). n = 5; data presented as mean ± SEM. *p<0.05 by Student’s t-test. (H) Mice from experiment in G were euthanized after BLI imaging at Day 4. Hind limbs were fixed and processed for IF imaging of GFP-expressing tumor cells (green) and ALP+ osteoblasts (red). Scale bars: 40 μm. See also Figure S7.
Notch activation is reported to circumvent apoptosis through affecting the p53-regulated apoptotic pathway (Dotto, 2009). We compared gene expression profile of SUM1315-M1B1 tumor cells before and after cisplatin treatment, in the presence or absence of osteoblast co-culture. We focused our analysis on 161 apoptosis-related genes (see STAR Methods for details). Among apoptosis-related genes that have more than 2 fold differential expression in co-culture versus tumor culture alone in cisplatin treatment conditions, 10 are anti-apoptotic genes that were reduced in expression upon cisplatin treatment in tumor culture alone, but were elevated in basal expression levels and further increased upon cisplatin treatment in the co-culture condition. Similarly, 6 pro-apoptotic genes were induced in tumor cells alone by cisplatin treatment, but such change was suppressed in the co-culture condition (Figure 7D). Notably, among those 16 genes, at least 5 genes are known to be regulated by the p53 pathway. MCL1, CCNA1, GADD45, and BAX are direct transcriptional targets of p53 and CCND2 is an indirect p53 pathway gene. Taken together, these results suggested that osteoblast-mediated chemoresistance of tumor cells is at least in part mediated by Notch activation and its effect on suppressing p53-regulated apoptotic pathway.
To directly analyze whether Jagged1 protects tumor cells from chemotherapy-induced apoptosis, we performed immunofluorescent staining of GFP+ tumor cells and CC3 of mouse bone sections after two rounds of single or combined treatments of paclitaxel and 15D11, as in the experiment in Figure 4A. In either IgG or 15D11 treated group, there was almost no detectable CC3 staining. While substantial number of tumor cells in the paclitaxel treatment group were positive for CC3, the paclitaxel and 15D11 combinational treatment group had the highest abundance of CC3+ tumor cells (Figures 7E and 7F).
To test whether Jagged1 antibody 15D11 could block the survival benefits conferred by MSCs during chemotherapy, we co-cultured SCP28 and SUM1315-M1B1 cells with MSCs. At the time of treating cells with chemotherapy, cells were also incubated with IgG or 15D11 antibody. Administration of 15D11 significantly reduced the number of surviving tumor spheres when the tumor cells were co-cultured with MSCs (Figures S7E and S7F). Similar findings were observed in co-culture experiment with MC3T3 cells. To confirm this result in vivo, we treated nude mice with cisplatin one day before the tumor cell injection. Right at the time of IIA injection of SUM1315-M1B1 tumor cell, mice were also treated with either IgG or 15D11 antibody. Bone metastatic seeding was tracked by BLI and by IF staining 4 days after the injection. Similar to the earlier experiment (Figures 5C–5E), more tumor cells were seeded in the bone of the mice pre-treated with cisplatin (Figure 7G). Such an increase of metastatic seeding in chemotherapy-primed bone was largely eliminated by 15D11 treatment. Similar result was also obtained using ER+ MCF7 breast cancer cells (Figure S7G–H). Confocal IF imaging of bone sections from euthanized animals further confirmed increased seeding of tumor cells next to ALP+ osteoblasts in chemotherapy-primed mice and the subsequent decrease after treatment with 15D11 (Figure 7H). In conclusion, our results demonstrate that although chemotherapy is cytotoxic to tumor cells, its full therapeutic potential is compromised by the increased expression of Jagged1 in osteoblast lineage cells in response to chemotherapy. Osteoblast derived-Jagged1 activates Notch signaling in tumor cells to promote resistance to chemotherapy-induced apoptosis. Combining chemotherapy with 15D11 treatment will nullify such stroma-mediated mechanism of chemoresistance, and achieve optimal outcome in the treatment of bone metastasis.
Combinatorial treatment of 15D11 and chemotherapy synergistically reduces the incidence of spontaneous bone metastasis
Our mouse model study revealed a role of chemotherapy-induced Jagged1 in osteoblasts in promoting chemoresistance of bone metastasis. To confirm whether Jagged1 is also induced in osteoblasts in human cancer patients receiving chemotherapy, we acquired the paired bone marrow cytospin samples of patients before and after receiving the adjuvant chemotherapy of carboplatin and paclitaxel and performed immunostaining analysis. Prior to chemotherapy, Jagged1 was expressed at a low level, mostly on ALP+ osteoblasts (Figure 8A). After chemotherapy, there is a significant increase of Jagged1 staining on osteoblasts (Figure 8A and 8B), consistent with our observation from in vitro and in mouse models (Figures 5A and 5B).
Figure 8. Combination of 15D11 and chemotherapy strongly inhibits spontaneous bone metastasis.

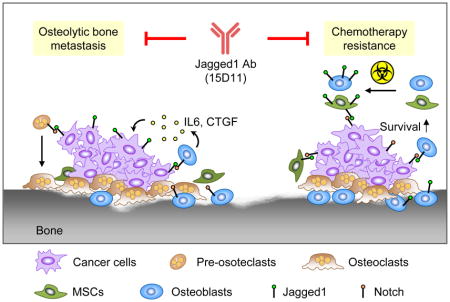
(A) Paired bone marrow cytospin samples were collected from cancer patients before and after cisplatin + paclitaxel chemotherapy. Slides were IF co-stained for ALP+ osteoblasts (red) and Jagged1 (green). Scale bar: 40 μm. (B) Normalized signal intensity of Jagged1 staining to ALP staining. Signal intensity was quantified using ImageJ software (NIH). n = 14 samples per group; data presented as mean ± SEM. *p<0.05 by Student’s t-test. (C) Schematic representation of experimental procedures. 4T1.2 mouse mammary tumor cells were injected in the mammary fat pad of 6–8 week old female Balb/c mice. Two weeks later when the primary tumors progressed to about 5–8 mm in diameter, mice were treated with IgG, 15D11 (10 mg/kg), paclitaxel (20 mg/kg) or both 15D11 and paclitaxel twice a week. Spontaneous bone metastasis progression was monitored by weekly X-ray images and by histological H&E staining and TRAP staining. n= 10 for each experimental group. (D) X-ray images of these experimental mice at Week 5. (E) Quantification of the percentage of mice that developed spontaneous bone metastasis based on X-ray and H&E staining at the end point. (F) Quantification of osteolytic lesions based on X-ray images. AU: arbitrary unit. n = 8; data presented as mean ± SEM. **p<0.05, **p<0.01 by Student’s t-test. (G) Schematic model for Jagged1-Notch signaling in bone metastasis progression and chemoresistance. Tumor-derived Jagged1 promote bone metastasis by engaging osteoblasts and osteoclasts (upper panel), while chemotherapy-induced Jagged1 in osteogenic cells promotes tumor cell survival under chemotherapy (lower panel). 15D11 targets both processes and synergizes with chemotherapy to strongly reduce bone metastasis.
In the clinical management of early stage breast cancer, neoadjuvant and adjuvant chemotherapy is commonly used to prevent future relapse. Although chemotherapy certainly decreases the local relapse and bone metastasis, it is potentially diminished by the chemotherapy-induced osteoblast Jagged1 in promoting metastatic seeding in bone. Therefore, combining chemotherapy and 15D11 treatment may further decrease the risk of bone relapse. To test this notion, we utilized 4T1.2 mammary tumor cells, which can spontaneously metastasize to the bone from the mammary glands (Eckhardt et al., 2005). 4T1.2 tumor cells were injected into mammary fat pads of female Balb/c mice to allow the establishment of primary tumors. Once the primary tumor sizes reached 5 mm, mice were randomly grouped for treatment with IgG, paclitaxel, 15D11, or both paclitaxel and 15D11 (Figure 8C). Based on X-ray images, we noticed that over 50% of mice in IgG control group developed bone metastasis in their hind limb bones. 15D11 or paclitaxel treatment reduced bone metastasis incidence by 15–30%, while a strong inhibition of bone metastasis was achieved by paclitaxel and 15D11 combinatorial treatment, with only 10% of mice developing bone metastasis (Figure 8D and 8E). Bone lesion areas were also significantly reduced in combinational treatment (Figure 8F). Overall, these results suggest that treating cancer patients with adjuvant chemotherapy combined with 15D11 could potentially reduce the incidence of future bone metastasis relapse.
DISCUSSION
As one of the major ligands for Notch, Jagged1 has been recently shown to be an important driver of cancer progression, including metastasis to bone (Sethi et al., 2011). In our effort to develop therapeutic antibodies against Jagged1, we utilized the XenoMouse technology to develop fully human Jagged1 antibodies and selected 15D11 for further testing based on blocking efficacy, affinity, and specificity. 15D11 displayed no detectable side effects in vivo while retaining a robust ability to inhibit Jagged1-mediated signaling in vitro and reduced in vivo bone metastasis of Jagged1-expressing breast cancer cells. In contrast to OPG-Fc, a decoy receptor for RANKL, 15D11 only inhibits pathological osteoclastogenesis but maintains a basal number of osteoclasts that is required for normal bone homeostasis, avoiding the abnormal increase of bone density typically observed after OPG-Fc, denosumab or bisphosphonate treatments. Thus, 15D11 represents a promising candidate for further clinical development as a therapeutic agent for bone metastasis.
While chemotherapy is effective in controlling or even curing different types of cancer, development of chemoresistance, especially in metastatic cancer, often leads to eventual mortality from cancer (Anampa et al., 2015). Understanding the mechanism of chemoresistance is crucial for developing strategies to re-sensitize chemo-resistant tumors. Previous studies of chemoresistance have mostly focused on tumor-intrinsic mechanisms, such as reduced drug uptake or increased drug efflux, alterations in drug-target interaction, changes in cellular response, in particular increased cell ability to repair DNA damage or tolerate stress conditions, and defects in apoptotic pathways. However, the tumor microenvironment, especially the unique stromal niches in the organ sites of metastasis, may also have a major influence on the development of chemoresistance. In our current study, we uncovered a tumor-osteoblast interaction that promotes chemoresistance of bone metastasis. Here we demonstrate that various chemotherapy agents, including paclitaxel and cisplatin, induced Jagged1 expression in osteoblasts and MSCs, which feeds back to tumor cells to activate Notch signaling and promote chemoresistance. Administration of 15D11 into our in vitro 3-D co-culture system or in various mouse models of bone metastasis significantly increased the sensitivity of tumor cells and bone metastasis to chemotherapy. Most strikingly, when chemotherapy was combined with 15D11, a nearly 100-fold reduction of bone metastasis burden was observed in our mouse model of bone metastasis. Thus, 15D11 represents a unique therapeutic agent capable of targeting both tumor-derived Jagged1 and chemotherapy-induced Jagged1 in osteoblasts, thus inhibiting multiple downstream Notch signaling events that are important for both the expansion of osteolytic lesions and chemoresistance of cancer cells in bone (Figure 8G).
Jagged1 is overexpressed in a proportion of primary breast tumors and these tumors are prone to develop bone metastasis (Li et al., 2014; Sethi et al., 2011). However, Jagged1 expression in tumor cells is not able to induce their own Notch signaling activation (Sethi et al., 2011). In our current study, Notch signaling is activated in tumor cells only when they are interacting with osteoblast Jagged1 during chemotherapy. This observation is consistent with the known Notch trans-activation and cis-inhibition mechanism. For example, during the development of Drosophila eyes, although adjacent cells express both Notch ligands and receptors, the Notch signaling activation only occurs in one direction, but not in both cells, setting up the developmental pattern within the tissue (Miller et al., 2009). More importantly, Notch ligands also generate a cis-inhibitory signals on the same cell (Sprinzak et al., 2010). Future studies should explore the exact reason why tumor-derived Jagged1 is not able to induce its own Notch activation, and how chemotherapy and oxidative stress specifically induce Jagged1 in osteoblast lineage cells but not in tumor cells and other stromal cells. It is also possible that additional stromal cell types, including the vascular endothelial cells, osteoclast cells, neurons, and bone marrow cells may also contribute to therapy resistance through different molecular mechanisms (Duan et al., 2014; Hanoun et al., 2014; Pitt et al., 2015), which would be an interesting direction for further investigations.
After resection of the primary tumor, many breast cancer patients are treated with adjuvant chemotherapy to reduce the risk of future relapse. Despite proven therapeutic benefit of adjuvant chemotherapy in reducing relapse, a substantial portion of breast cancer patients eventually still develop metastatic relapse in bone and other organs (Anampa et al., 2015). Indeed, disseminated tumor cells (DTCs) are frequently observed in breast cancer patients long after the surgical removal of the primary tumors and adjuvant chemotherapy, and the presence of these DTCs correlates with risk of metastatic relapse (Braun et al., 2005). These findings underscore the importance of improving the efficacy of adjuvant chemotherapy. Our current study indicates that chemotherapy-induced Jagged1 in osteoblasts may provide a pro-survival niche for DTCs, and targeting a Jagged1-mediated niche may increase the elimination of DTCs by chemotherapy and reduce bone metastasis. As a proof-of-concept of such combined treatment strategy, spontaneous bone metastasis from the murine 4T1.2 mammary tumors were drastically reduced after combined chemotherapy and 15D11 treatment. Given the excellent safety profile of 15D11, it represents an ideal agent for further clinical development both for the treatment of established bone metastasis and for preventing relapse in early stage breast and other cancers that frequently metastasize to bone.
STAR METHODS
CONTACT FOR REAGENT AND RESOURCE SHARING
Further information and requests for resources and reagents should be directed to the Lead Contact Yibin Kang at ykang@princeton.edu.
15D11 antibody is the property of Amgen Inc. and utilized for this study under an MTA. A request for 15D11 antibody needs to be negotiated with Amgen directly.
EXPERIMENTAL MODEL AND SUBJECT DETAILS
Animal Models
All procedures involving mice and experimental protocols were approved by the Institutional Animal Care and Use Committees (IACUC) of Princeton University and Amgen Inc. Mice were purchased from Jackson laboratory with detailed information listed in Key Resources Table. For orthotopic primary tumor formation and spontaneous bone metastasis assay, female BALB/c mice (4–6 weeks old) were anaesthetized and a small incision was made to reveal the mammary gland. 105 GFP labeled 4T1.2 tumor cells suspended in 10 μl PBS were injected directly into the mammary fat pad. Spontaneous bone metastasis was monitored by X-ray imaging. Mice were euthanized when the primary tumor reaches 20×20 mm. For experimental bone metastasis, three models were used using intra-cardiac (IC), intra-iliac artery (IIA) and intra-tibia (IT) injection methods. For all these injections, tumor cells were harvested from subconfluent cell culture, washed with PBS, and suspended at 106 cells/ml in PBS for IC and IIA, and at 2.5×10⁷ cells/ml in PBS for IT injection. Mice were anesthetized with ketamine (100 mg/kg body weight) and xylazine (10 mg/kg body weight) before injection. For IC injection, 0.1ml cells were injected into the left cardiac ventricle of 4–6 week-old, female athymic nude mice using 26G needles. Successful injection was confirmed by BLI imaging confirming evenly distributed bioluminescent signal in the whole body. For IIA injection, a small incision of about 1.5 cm was made on the skin in the middle line between femoral and ilium bones. Muscles were dissected to reveal iliac artery. Cancer cells in 0.1 ml PBS were injected by 31G superfine insulin needles under the dissecting microscope. The wounded area was then pressed for 10 minutes to stop the bleeding and closed with wound clips before BLI imaging. For IT injection, 4–6 week-old female FVB mice were used. Mouse leg was bended and the skin area was visualized with 70% ethanol wiping. Insert a 28G needle under patella and penetrate the tibial growth plate, slowly press the plunger to inject 10 μl of cell solution. Bone metastasis burden was monitored by weekly BLI and X-ray imaging. At the experimental endpoint, mice were euthanized for bone histology analysis and half of the bone samples were used for μCT imaging and bone density quantification.
The human Jagged1 cDNA was PCR amplified and cloned into the retroviral expression vector pMSCVpuro using XhoI and EcoRI restriction sites. To generate the Col1a1-Jag1 mouse strain, we used a backbone vector of pTyr-Co1a1. Mouse cDNA library was generated using a mouse mammary gland mRNA from FVB background mice and reverse transcribed to cDNA by using SuperScript III First Strand Synthesis System for RT-PCR (118080-051 Life Technologies CA). Jagged1 cDNA was PCR amplified using this library by a pair of primers both with SwaI restriction enzyme overhangs (CATT ATTTAAATgccaccatgcggtccccacgga and CATT ATTTAAAT ctgctatacgatgtattccatccgg) and inserted into SwaI site of pTyr-Col1a1 plasmid with sequencing confirmation. The genotyping was performed using primer pairs of CAACACCACGGAATTGTCAGT and GATGATGGGAACCCTGTCAA with final PCR product of 1012 bps.
Clinical Bone Marrow Cytospin Analysis
14 pairs of bone marrow cytospin samples (without any DTCs) from cancer patients before and after Carboplatinum and paclitaxel were acquired from the University Hospital Essen, Essen, Germany. Patients were de-identified and were considered exempt by the Institutional Review Boards of Princeton University. Cytospin slides were dried on room temperature for 1 hr before staining. Slides were thawed for 3 min and fixed for 10 min with 4% PFA in PBS before permeabilized in 0.2% Triton X-100 in PBS for 10 min and blocked in 10% goat serum for 20 min. Samples were then incubated with Jagged1 primary antibody for 1 hr and in secondary antibody for 45 min. Samples were blocked for 20 min before incubation with the next set of primary (Alkinine Phosphatase antibody) and secondary antibodies. All antibodies were diluted in 10% goat serum. Slides were stained with Hoechst and mounted with coverslips using Prolong gold antifade reagent.
Cell Lines
293T, 4T1.2, SCP28, SCP28-Vector and -Jagged1 cells, SCP28, RAW264.7, were cultured in DMEM supplemented with 10% FBS, 1% penicillin-streptomycin, and 0.2% Amphotericin B. MCF7 cells were culture in DMEM supplemented with 10% FBS, 1% penicillin-streptomycin, and 0.01 mg/ml Insulin. SUM1315-M1B1 was cultured in F12 medium with 5% FBS, 1% penicillin-streptomycin, 0.2% Amphotericin B, 5 μg/ml insulin, and 10 ng/ml EGF. H29-Clone#7 was cultured in DMEM supplemented with 10% FBS, 1% penicillin-streptomycin, 0.2% Amphotericin B, 0.5 μg/ml doxycycline, 2 μg/ml puromycin, and 300 μg/ml G418. H29-Clone#7 was cultured without all antibiotics when used for retrovirus production. MC3T3-E1 Clone #4 (denoted as MC3T3 for abbreviation thereafter) was cultured in α-MEM with 10% FBS, 1% penicillin-streptomycin, and 0.2% Amphotericin B. Mouse mesenchymal stromal cell (MSC, isolated from Balb/c) was cultured in DMEM supplemented with 10% FBS, 1% penicillin-streptomycin, 0.2% Amphotericin B, and 20 ng/ml FGF. All plasmids were transfected into different cell lines using Lipofectamine 2000 following the manufacturer’s manual (Life technologies, CA, USA). To generate stable cell lines, a pLEX-MCS based lentivirus vector or a pMSCV-hygro based retrovirus vector was used in our study. Lentiviruses were packaged in HEK293T cells while retroviruses were packaged by using H29 cell line. Conditioned media from these packaging cells containing viruses were collected 2 days and 3 days after transfection. Recipient cell lines were exposed to conditioned media containing viruses supplemented with 2 μg/mL Polybrene for 48 hr. Infected cells were selected with puromycin or hygromycin to generate stable expressing cell lines. 293T and H29clone#7 are cell lines from female humans. All other cancer cell lines are breast cancer cell lines from either female human or mouse.
METHOD DETAILS
Osteoclast Differentiation Assay
For osteoclast differentiation assays, RAW264.7 cells were seeded onto Fc- or recombinant Jagged1 protein plates, or co-cultured with indicated cell lines at the concentration of 0.2 million cells/well in 12 well plate. Cells were then treated with 5 ng/ml RANKL in DMEM plus 10% FBS, with media changed every 2 days and twice a day from Day 5 and on. Primary pre-osteoclasts were isolated from bone marrow cells flushed from the tibia of 6-week-old WT Balb/c mice and filtered through a 70 μm cell-strainer before overnight culture in α-MEM with 10% FBS. The following day non-adherent cells were plated and supplemented with 50 ng/mL M-CSF for 2 days. Cells were then re-plated onto Fc- or recombinant Jagged1 protein plates, or co-cultured with indicated cell lines in 12 well plate at the presence of 5ng/ml RANKL in DMEM plus 10% FBS, with media changed every 2 days (media was changed twice a day from Day 5 and on). Mature osteoclasts were TRAP stained using a leukocyte acid phosphatase kit (387A-1KT Sigma) and TRAP positive and multinucleated cells were quantified as mature osteoclasts.
2-D and 3-D Tumor-stromal Co-culture
For 2-D tumor osteoblast co-culture, SCP28-vector or SCP28-Jagged1 tumor cells were cultured with MC3T3 cells in 10 cm plate in DMEM with 10% FBS. One day after co-culture, media was changed to serum free DMEM for another 24 hr before the conditioned media collection. The collected conditioned media were concentrated by centrifuging at room temperature at 4000 rpm using Amicon Ultra-15 (3K) centrifuge filter (UFC900324, EMD Millipore, MA, USA) for further usage. For tumor-stroma cell 3-D co-culture assay, 1:1 ratio, a total of 10000 tumor cells and MC3T3 cells (or MSCs) were cultured in a serum free mammosphere formation media in low attachment plates (Corning, Corning NY, USA). The media is freshly prepared with 1 ml B27 (Life Technologies, CA, USA), 20 ng/ml bFGF (Novoprotein, NJ, USA), 20 ng/ml EGF (Novoprotein, NJ, USA), 100 μg/ml Gentamycin (Life Technologies, CA, USA), and 0.25 ml non-essential amino acid solution (Life Technologies, CA, USA) in a total of 50 ml DMEM/F12 media. Cells were cultured to form 3-D spheres before treating with respective chemotherapeutic agent.
Labeling of MC3T3 and MSC cells
To generate labeled MSC and MC3T3 cells for co-culture study, we infected these two cell lines with pLEX-mCherry lentivirus for two days and let the cells expand for anther 5 days. Cultured cells were then trypsin digested and re-suspended in FACS buffer (PBS supplemented with 5% newborn calf serum) and filtered through 70 mm nylon cell strainers before flow cytometric analysis on a FACS sort instrument (BD Biosciences). Non-labeled parental cells were used as negative control. DAPI was used for nuclear counter staining to eliminate dead cells.
Generation and Characterization of 15D11 Antibody
Immunization
Fully human antibodies to Jagged1 were generated using XenoMouse technology, transgenic mice engineered to express diverse repertoires of fully human IgGκ and IgGλ antibodies of the corresponding isotypes (Kellermann and Green, 2002; Mendez et al., 1997). XMG2-KL and XMG4-KL strains of mice were immunized with CHO transfectants expressing full length human Jagged1. Cellular immunogens were dosed at 4.0×10⁶ Jagged1 transfected cells/mouse and subsequent boosts were of 2.0×10⁶ Jagged1 transfected cells/mouse. Injection sites used were combinations of subcutaneous base-of-tail and intraperitoneal. Adjuvant used was Alum (E.M. Sergent Pulp and Chemical Co., Clifton, NJ, cat. # 1452-250). Mice were immunized over a period of 8 weeks to 12 weeks.
Antibody Specificity Determination
After 14 days of culture, hybridoma supernatants were screened for human Jagged1 specific monoclonal antibodies by Fluorometric Microvolume Assay Technology (FMAT) (Applied Biosystems, Foster City, CA). The supernatants were screened against 293T cells transiently transfected with human Jagged1 and counter screened against 293T cells transiently transfected with the same expression plasmid that did not contain the JAG1 gene.
Ligand Binding Affinity Test
A ligand binding competition method was developed to identify antibodies (in the hybridoma supernatants) that bind Jagged1 ligand and block binding of three receptors: Notch-3, Notch 2 and Notch-1. FACS assays were performed by incubating 20 μl of hybridoma supernatants with 50000 cells transiently expressing at 4°C for 1 hr followed by two washes with PBS/BSA. Cells were then treated with 5μg/ml florochrome-labeled Notch-3 (#1559-NT, R&D Systems) at 4°C followed by two washes. The cells were re-suspended in 1ml PBS/BSA and antibody binding was analyzed using a FACS Calibur™ instrument. Similar assays were performed using Notch-2 (#3735-NT, R&D Systems) and Notch-1 (#3647-TK, R&D Systems).
The experiments included negative control hybridoma supernatants. The average signal observed in these negative control experiments was adopted as the maximum possible signal for the assay. Experimental supernatants were compared to this maximum signal and a percent inhibition was calculated for each well (% Inhibition = (1-(FL1 of the anti-BCMA hybridoma supernatant/Maximum FL1 signal))).
Additional Binding Characterization
FACS binding assays were performed to evaluate the binding of the anti-Jagged1 specific antibodies to the murine Jagged1 as well as related Notch ligands, human Jagged2 and human Dll4. FACS assays were performed by incubating hybridoma supernatants with 50000 cells at 4°C for 1 hr followed by two washes with PBS/BSA. Cells were then treated with florochrome-labeled secondary antibodies at 4°C followed by two washes. The cells were re-suspended in 1 ml PBS/BSA and antibody binding was analyzed using a FACSCalibur™ instrument.
Kd Estimation by KinExA
Binding of anti-Jagged1 antibody 15D11 with 293T/muJagged1 clone1 cells were tested on KinExA. Briefly, UltraLink Biosupport (Pierce cat# 53110) was pre-coated with goat-anti-huFc (Jackson Immuno Research cat# 109-005-098) and blocked with BSA. 10 pM and 100 pM of Ab 15D11 was incubated with various density (1.5×10² - 9.0×10⁶ cell / ml) of 293T cells expressing muJagged1 in 1% FBS, 0.05% sodium azide, DMEM. Samples containing 15D11 antibody and whole cells were rocked for 4 hr at room temperature. The whole cells and antibody-cell complexes were separated from unbound free antibody using Beckman GS-6R centrifuge at approximately 220 g for 5 min. The supernatant was filtered through 0.22 μm-filter before passing the goat-anti-huFc-coated beads. The amount of the bead-bound Ab 15D11 was quantified by fluorescent (Cy5) labeled goat anti-humanIgG (H+L) antibody (Jackson Immuno Research cat# 109-175-088). The binding signal is proportional to the concentration of free Ab 15D11 in solution at each cell density. Equilibrium dissociation constant (Kd) was estimated using model of unknown ligand for n-curve analysis in KinExA™ Pro software.
In Vivo Treatment Schedule and Dosing
The initial treatment is either one day before tumor cell injection or one week after tumor cell injection as described in each experiment. For IgG or 15D11 antibody treatment, mice were intraperitoneal (i.p.) injected at the dosing of 10 mg/kg, twice a week. For OPG-Fc treatment, mice were i.p. injected at the dosing of 3 mg/kg, twice a week. For paclitaxel treatment, paclitaxol powder was first dissolved in 95% ethanol, sonicated and shaked overnight, before mixed 1:1 with cremophor (Sigma Catalog#: 769193-1KG) to reach the final concentration of 20 mg/ml. Paclitacel was diluted 5 times in PBS right before usage. Mice were i.v. injected at 25 mg/kg for the first time, and then 20 mg/kg each time, twice a week for up to total of 6 times. Cisplatin was used at the dosing of 2 mg/kg in experiment in Figure 5D. For treatment using GSI inhibitor (MRK003), mice were administered either the vehicle control (0.5% methylcellulose) or GSI (freshly dissolved in 0.5% methycellulose before each use) by oral gavage twice a week at a 100 mg/kg dosage. The dosing schedule was 2-days ON, 5-days OFF.
Effect of 15D11 Antibody on Angiogenesis
The angiogenesis effect of 15D11 antibody is determined by two methods: 1) Mouse neonatal retina study. Mouse retinas were harvested, stained and fixed as described similarly in a previous study (Ridgway et al., 2006); and 2) Tumor angiogenesis model. 2×10⁶ Colo 205 cells were implanted into female athymic nude mice subcutaneously. Mice were randomized at Day 11 before treated with IgG or 15D11 antibody at the dosage of 300μg/mouse for twice a week. Tumor volume was monitored by palpation. To determine tumor angiogenesis effect, Colo205 tumors from mice treated for 96 hr with 500 μg of IgG, or 15D11 antibody were collected. Intra-tumor blood vessels were visualized by CD31 staining and counterstained with hematoxylin. (n = 3 per group). No vascular differences between groups were observed.
Bone Histology Analysis
Hindlimb bones were excised from mice at the end point of each experiment, immediately after the last BLI time point. Following this, the tumor-bearing hind limb bones were fixed in 10% neutral-buffered formalin, decalcified in 10% EDTA for 2 weeks, and embedded in paraffin for hematoxylin and eosin (H&E), tartrate-resistant acid phosphatase (TRAP) (Kos et al., 2003), or immunohistochemical staining. Histomorphometric analysis was performed on H&E stained bone metastasis samples using the Zeiss Axiovert 200 microscope and the AxioVision software version 4.6.3 SP1. For quantitative analysis of lesion area, a 10x objective was used to focus on the tumor region of interest and images were acquired using the AxioCamICc3 camera set to an exposure of around 100 ms. Osteoclast number was assessed as multinucleated TRAP+ cells and reported as number/field. For immunofluorescence staining of the bone samples, Hind limb bones were excised from mice at the end point of each experiment immediately followed by PBS and 4% freshly prepared paraformaldehyde. Non-decalcified bone samples were then frozen in embedding media and sectioned with Leica CM3050S Research Cryostat at 20 μM with Cryofilm type IIIC (Section-Lab, Japan) and stained with respective primary antibodies and fluorophore labeled secondary antibodies. GFP antibody: Cat# ab13970 (Abcam). Jagged1 antibody: Cat# AP09127PU-N (Acris Antibodies). ALP antibody: Cat# MAB29091 (R&D Systems). Cleaved Caspase-3 antibody: Cat# 9661S (Cell Signaling). Ki67 antibody: Cat# ab15580 (Abcam). Images were taken using Nikon A1 confocal microscope at Princeton University Molecular Biology Confocal microscope core facility.
μCT Analysis
Femurs and tibias were scanned using the INVEON PET/CT (Siemens Healthcare) at the Preclinical Imaging Shared Resource of Cancer Institute of New Jersey. The X-Ray tube settings were 80 kV and 500 μA and images were acquired at the highest resolution without CCD binning, resulting in a voxel size of 9.44 μm. A 0.66° rotation step through a 195° angular range with 6500 ms expo sure was used. The images were reconstructed with Beam Hardening Correction and Hounsfield calibration before being analyzed using the INVEON Research Workplace software (Siemens Healthcare). After processing with a 3-D Gaussian filter to reduce noise, ROI’s were manually segmented that corresponded to the cortical and trabecular bone regions.
X-ray Imaging and Osteolytic Lesion Quantification
Osteolytic bone lesions in mice were assessed by X-ray radiography. Anesthetized mice were placed on individually wrapped films (BIOMAX XAR Film, Cat#: F5763-50EA, Sigma-Aldrich) and exposed to X-ray radiography at 35 kV for 15 seconds using a MX-20 Faxitron instrument. Films were developed using a Konica SRX-101A processor. Changes in bone remodeling and osteolytic lesions (radiolucent lesions) in the hind limbs of mice were identified and quantified using the Adobe Photoshop software (Adobe Systems Inc.)
Western Blot Analyses
SDS lysis buffer (0.05 mM Tris-HCl, 50 mM BME, 2% SDS, 0.1% Bromophenol blue, 10% glycerol) was used to collect protein from cells. Samples were heat denatured and equally loaded, separated on a 10% SDS-page gel, transferred onto a PVDF membrane (Millipore), and blocked with 5% milk. Primary antibodies for immunoblotting included: anti-β-actin (1:10,000 dilution, Abcam, cat#ab6276, clone AC-15), anti-Cleaved Caspase 3 (1:1000 dilution, Cell Signaling, Cat# 9661S), anti- IL6 (1:1000 dilution, MLB International Cooperation, cat#JM-5144-100), anti-PARP (1:1000 dilution, Cell Signaling, Cat#9532S), anti-Jagged1 (1:1,000 dilution, Santa Cruz Biotechnology, Cat#SC8303). Membranes were incubated with horseradish peroxidase (HRP)-conjugated anti-mouse, rabbit or rat secondary antibody (1:2,000 dilution, GE Healthcare) for 1 hr and chemiluminescence signals were detected by ECL substrate (GE Healthcare).
RNA isolation and qRT-PCR Analysis
Total RNAs were isolated from cells using RNeasy kit (Qiagen) following manufacturer’s instructions. RNAs were reverse transcribed into cDNAs by using Superscript III reverse transcription kit (Invitrogen). Real-time RT-PCR was performed on ABI 7900 96 HT series PCR machine (Applied Biosystem) using SYBR Green Supermix (Bio-Rad Laboratories). The gene-specific primer sets were used at a final concentration of 0.5 μM. All real-time RT-PCR assays were performed in duplicate in at least two independent experiments. Relative expression values of each target gene were normalized to GAPDH/Gapdh mRNA level. The primers used are listed in the Supplemental Table S1.
Microarray and Heatmap Generation
SUM1315-M1B1 breast cancer cells (GFP labeled) were cultured alone or co-cultured with MC3T3-E1 clone #4 bone osteoblast cells, and treated with control PBS or 10 μM cisplatin for 48 hr. Tumor cells were sorted using FACS based on GFP labeling.
RNA was collected from these samples using the RNAeasy Mini Kit (Qiagen, Valencia VA) according to manufacturer’s instructions. The gene expression profiles were determined using Agilent whole human genome microarray 4×44K G4112F, following the manufacturer’s instructions. Briefly, the RNA samples and universal human reference RNA (Agilent 740000) were labeled with CTP-cy5 and CTP-cy3, respectively, using the Agilent Quick Amp Labeling Kit. Labeled testing and reference RNA samples were mixed in equal proportions, and hybridized to the human GE 4×44K array. The arrays were scanned with an Agilent G2505C scanner and raw data was extracted using Agilent Feature Extraction software (v11.0). Data was analyzed using the GeneSpring 13 software (Agilent). The expression value of individual probes refers to the Log2(Cy5/Cy3) ratio. The microarray dataset is deposited in GEO database with accession number GSE97997.
Heat map representation of microarray data displays the selected pro- and anti-apoptosis genes from Hallmark-apoptosis signature in MsigDB (http://software.broadinstitute.org/gsea/msigdb/cards/HALLMARK_APOPTOSIS.html ). The gene expression values of these genes are further transformed based on median of samples from paired culture conditions (alone vs co-culture) in both saline and cisplatin treatments.
QUANTIFICATION AND STATISTICAL ANALYSIS
Results were reported as mean ± SD (standard deviation) or mean ± SE (standard error of the mean), as indicated in the figure legend. Statistical comparisons were performed using unpaired two-sided Student’s t-test with unequal variance assumption and by Mann-Whitney U test . All in vitro experiments were repeated three times and animal experiments were repeated once. All the experiments with representative images (including western blot and immunofluorescence) have been repeated at least twice and representative images were shown (except for bone marrow samples). The IF images in Figure 8 are representative of bone marrow cytospin specimens of the same category (pre-treatment vs post-treatment). Quantification of these IF images was performed using ImageJ software.
DATA AND SOFTWARE AVAILABILITY
All microarray data generated in this study have been deposited as a superseries at the NCBI Gene Expression Omnibus with the accession code GSE97997, and can be accessed at https://www.ncbi.nlm.nih.gov/geo/query/acc.cgi?token=cpancgoafjcnxyv&acc=GSE97997.
ADDITIONAL RESOURCES (None)
KEY RESOURCES TABLE
The table highlights the genetically modified organisms and strains, cell lines, reagents, software, and source data essential to reproduce results presented in the manuscript. Depending on the nature of the study, this may include standard laboratory materials (i.e., food chow for metabolism studies), but the Table is not meant to be comprehensive list of all materials and resources used (e.g., essential chemicals such as SDS, sucrose, or standard culture media don’t need to be listed in the Table). Items in the Table must also be reported in the Method Details section within the context of their use. The number of primers and RNA sequences that may be listed in the Table is restricted to no more than ten each. If there are more than ten primers or RNA sequences to report, please provide this information as a supplementary document and reference this file (e.g., See Table S1 for XX) in the Key Resources Table.
Please note that ALL references cited in the Key Resources Table must be included in the References list. Please report the information as follows:
REAGENT or RESOURCE: Provide full descriptive name of the item so that it can be identified and linked with its description in the manuscript (e.g., provide version number for software, host source for antibody, strain name). In the Experimental Models section, please include all models used in the paper and describe each line/strain as: model organism: name used for strain/line in paper: genotype. (i.e., Mouse: OXTRfl/fl: B6.129(SJL)-Oxtrtm1.1Wsy/J). In the Biological Samples section, please list all samples obtained from commercial sources or biological repositories. Please note that software mentioned in the Methods Details or Data and Software Availability section needs to be also included in the table. See the sample Table at the end of this document for examples of how to report reagents.
SOURCE: Report the company, manufacturer, or individual that provided the item or where the item can obtained (e.g., stock center or repository). For materials distributed by Addgene, please cite the article describing the plasmid and include “Addgene” as part of the identifier. If an item is from another lab, please include the name of the principal investigator and a citation if it has been previously published. If the material is being reported for the first time in the current paper, please indicate as “this paper.” For software, please provide the company name if it is commercially available or cite the paper in which it has been initially described.
-
IDENTIFIER: Include catalog numbers (entered in the column as “Cat#” followed by the number, e.g., Cat#3879S). Where available, please include unique entities such as RRIDs, Model Organism Database numbers, accession numbers, and PDB or CAS IDs. For antibodies, if applicable and available, please also include the lot number or clone identity. For software or data resources, please include the URL where the resource can be downloaded. Please ensure accuracy of the identifiers, as they are essential for generation of hyperlinks to external sources when available. Please see the Elsevier list of Data Repositories with automated bidirectional linking for details. When listing more than one identifier for the same item, use semicolons to separate them (e.g. Cat#3879S; RRID: AB_2255011). If an identifier is not available, please enter “N/A” in the column.
A NOTE ABOUT RRIDs: We highly recommend using RRIDs as the identifier (in particular for antibodies and organisms, but also for software tools and databases). For more details on how to obtain or generate an RRID for existing or newly generated resources, please visit the RII or search for RRIDs.
Please use the empty table that follows to organize the information in the sections defined by the subheading, skipping sections not relevant to your study. Please do not add subheadings. To add a row, place the cursor at the end of the row above where you would like to add the row, just outside the right border of the table. Then press the ENTER key to add the row. You do not need to delete empty rows. Each entry must be on a separate row; do not list multiple items in a single table cell. Please see the sample table at the end of this document for examples of how reagents should be cited.
KEY RESOURCES TABLE.
| REAGENT or RESOURCE | SOURCE | IDENTIFIER |
|---|---|---|
| Antibodies | ||
| Alkaline Phosphatase/ALPL in 1:100, Rat | R & D Systems | Cat# MAB29091 RRID:AB_11129451 |
| beta Actin [AC-15] in 1:10,000, Mouse | Abcam | Cat# ab6276 RRID:AB_2223210 |
| Cleaved Caspase-3 (Asp175) | Cell Signaling Technology | Cat# 9661 RRID:AB_2341188 |
| GFP in 1:1,000, Chicken | Abcam | Cat# ab13970 RRID:AB_300798 |
| Jagged1(H114) in 1:1,000, Rabbit | Santa Cruz Biotechnology | Cat# sc-8303 RRID:AB_649685 |
| Jagged1 in 1:100 (IF), Rabbit | Acris Antibodies | Cat# AP09127PU-N RRID:AB_2035312 |
| Ki67 in 1:100, Rabbit | Abcam | Cat# ab15580 RRID:AB_443209 |
| IL6 in 1:1,000, Rabbit | MBL International | Cat# JM-5144-100 RRID:AB_592035 |
| PARP in 1:1,000, Rabbit | Cell Signaling Technology | Cat# 9542 RRID:AB_2160739 |
| 15D11 fully human anti-human Jagged1 antibody | Amgen Inc. | N/A |
| Anti-Rabbit IgG - Horseradish Peroxidase in 1:5,000, Goat | GE Healthcare | Cat# RPN4301 RRID:AB_2650489 |
| Anti-Mouse IgG - Horseradish Peroxidase in 1:5,000, Sheep | GE Healthcare | Cat# NA931-1ml, RRID:AB_772210 |
| Bacterial and Virus Strains | ||
| pMSCV-Puro | Seth N., et al. 2011 | NA |
| pMSCV-Jagged1 | Seth N., et al. 2011 | NA |
| pTyr-Co1a1-mJagged1 | This paper | NA |
| Biological Samples | ||
| 14 pairs of bone marrow cytospin samples before and after Carboplatinum and paclitaxel treatment | University Hospital Essen, Essen, Germany | NA |
| Chemicals, Peptides, and Recombinant Proteins | ||
| OPG-Fc | Amgen Inc. | NA |
| Brefeldin A | Sigma-Aldrich | Cat# B6542-5MG |
| CCl4 (Carbon tetrachloride) | Sigma-Aldrich | Cat# 319961 |
| Cisplatin | Sigma-Aldrich | Cat# 134357-100MG |
| Docetaxel | Sigma-Aldrich | Cat# 1224551-200MG |
| Hydrogen peroxide solution | Sigma-Aldrich | Cat# 216763 |
| MRK003 | Merck | NA |
| N-Acetyl-L-cysteine | Sigma-Aldrich | Cat# A7250-5G |
| Paclitaxel | Sigma-Aldrich | Cat# T7191-25MG |
| (+)-Sodium L-ascorbate | Sigma-Aldrich | Cat# A4034 |
| Tunicamycin | Sigma-Aldrich | Cat# T7765 |
| Recombinant Mouse IL6 Protein | R&D Biosystems | Cat# 406-ML-005 |
| Recombinant Mouse RANKL Protein | R&D Biosystems | Cat# 462-TEC-010 |
| Critical Commercial Assays | ||
| Acid Phosphatase, Leukocyte (TRAP) Kit | Sigma-Aldrich | 387A-1KT |
| ALT Activity Assay | Sigma-Aldrich | MAK052 |
| AST Activity Assay | Sigma-Aldrich | MAK055 |
| Deposited Data | ||
| Gene expression microarray data | GSE97997 | https://www.ncbi.nlm.nih.gov/geo/query/acc.cgi?token=cpancgoafjcnxyv&acc=GSE97997 |
| Experimental Models: Cell Lines | ||
| Chinese hamster CHO | ATCC | Cat# CCL-61 |
| Human embryonic kidney H29-Clone#7 | Seth N., et al. 2011 | NA |
| Mouse osteoblast MC3T3-E1 Clone #4 | ATCC | Cat# CRL-2393 |
| Mouse mesenchymal stromal cell (MSC) | Ren G., et al. 2008 | NA |
| Mouse PyMT-A-FIG | Wan., et al., 2014 | NA |
| Human breast cancer MCF7 | ATCC | Cat# HTB-22 |
| Human breast cancer SCP28 | Kang Y., et al. 2003 | NA |
| Human breast cancer SCP2 | Kang Y., et al. 2003 | NA |
| Human breast cancer SCP28-Vector | Seth N., et al. 2011 | NA |
| Human breast cancer SCP28-Jagged1 | Seth N., et al. 2011 | NA |
| Human breast cancer SUM1315-M1B1 | another manuscript in preparation, derivative from SUM1315 | NA |
| Human embryonic kidney 293T | ATCC | Cat# CRL-3216 |
| Mouse breast cancer 4T1.2 | Eckhardt B.L., et al. 2005 | RRID:CVCL_GR32 |
| Experimental Models: Organisms/Strains | ||
| Mouse Bal/cJ | Jackson Laboratory | Cat# 000651 |
| Mouse FVB/NJ | Jackson Laboratory | Cat# 001800 |
| Mouse nu/nu | Jackson Laboratory | Cat#: 002019 |
| Mouse Col1a1-Jag1 (FVB) | This paper | NA |
| XenoMouse XMG2KL | Kellermann S., et al. 2002 | NA |
| XenoMouse XMG4KL | Kellermann S., et al. 2002 | NA |
| Oligonucleotides | ||
| See Table S1 for real-time PCR primers | IDT | NA |
| Col1a1-Jag1-GT-F | IDT | CAACACCACGGAATTGTCAGT |
| Col1a1-Jag1-GT-R | IDT | GATGATGGGAACCCTGTCAA |
| Software and Algorithms | ||
| AxioVision software version 4.6.3 | Zeiss | NA |
| GeneSpring 13 software | Agilent | NA |
| ImageJ | National Institute of Health | NA |
| INVEON Research Workplace software | Siemens Healthcare | NA |
| NIS-Elements Confocal | Nikon | NA |
SIGNIFICANCE.
Current treatments for bone metastasis often reduce skeletal-related events without significant reduction of tumor burden or survival benefit for patients. Furthermore, bone metastasis is particularly refractory to chemotherapy. While γ-secretase inhibitors have therapeutic efficacy against bone metastasis in preclinical models, the high gastrointestinal tract toxicity of these agents prevented their further clinical development. 15D11 is a fully human monoclonal antibody against Jagged1 with minimal toxicity and excellent therapeutic efficacy against bone metastasis. Importantly, by targeting tumor-protective osteoblastic Jagged1 induced by chemotherapy, 15D11 synergizes with chemotherapy to reduce bone metastasis burden by more than 100-fold and dramatically reduces metastatic relapse to bone from primary tumors. These results indicate broad potential applications of 15D11 for bone metastasis prevention or treatment.
Highlights.
Jagged1 antibody 15D11 reduces bone metastasis without significant side effects
Chemotherapy induces tumor-protecting Jagged1 in osteoblasts
Transgenic expression of Jagged1 in osteoblasts promotes bone metastasis
15D11 sensitizes bone metastasis to chemotherapy
Supplementary Material
Representative μCT 3D construction of hind limb bone from SCP28-Vector cell injected mice. Provided as a mpg file.
Representative μCT 3D construction of hind limb bone from SCP28-Jagged1 cell injected, IgG antibody treated mice. Provided as a mpg file.
Representative μCT 3D construction of hind limb bone from SCP28-Jagged1 cell injected, 15D11 antibody treated m ice. Provided as a mpg file.
Representative micro-CT 3D construction of hind limb bone from SCP28-Jagged1 cell injected, OPG treated mice. Provided as a mpg file.
3D construction of confocal images from PBS pre-treated, SCP28 injected mice (4Days post IIA injection). Provided as a mpg file.
3D construction of confocal images from cisplatin pre-treated, SCP28 injected mice (4Days post IIA injection). Provided as a mpg file.
Acknowledgments
We thank N. Sethi, B. Ell, R. Chakrabarti, T. Celia-Terrassa, L. Wan, H.A. Smith, Z. Li, W. Lu and other lab members for technical supports and helpful discussions, and J.J. Grady and C. DeCoste for assistance with flow cytometry, and T. Campbell at Rutgers Cancer Institute of New Jersey (RCINJ) Preclinical Imaging Facility for μCT imaging. We thank M. Alpern and V. Buynevich of the University Medical Center of Princeton at Plainsboro for assistance in blood sample analysis. We thank those key scientists, particularly L. Perkins and J. Ho, at Amgen Discovery Research that contributed to the development of the 15D11 antibody. This research was supported by a RCINJ Research Development Award, the Brewster Foundation, and grants from METAvivor Research and Support (AWD1004691), the U. S. Department of Defense (BC123187), the National Institute of Health (R01CA134519 and R01CA141062) and Amgen to Y.K., Cancer and Prevention Research Institute of Texas (CPRIT) grant RP170488 to B. L., and postdoctoral fellowships from Susan G. Komen to H.Z. and M.S., from DOD to G.R., and from NJCCR to M.S. This research was also supported by the Preclinical Imaging Facility and Pre-clinical Imaging and Flow Cytometry Shared Resources of the RCINJ (P30CA072720).
Footnotes
Supplemental information, including seven Supplemental Figures, one Supplemental Table, and six Supplemental Movies, can be found with this article online.
CONFLICT OF INTEREST
Chadwick King, Jan Sun, Jodi Moriguchi, Helen Toni Jun, and Angela Coxon are either previous or current employees of Amgen Inc. This research was in part funded by Amgen.
Publisher's Disclaimer: This is a PDF file of an unedited manuscript that has been accepted for publication. As a service to our customers we are providing this early version of the manuscript. The manuscript will undergo copyediting, typesetting, and review of the resulting proof before it is published in its final citable form. Please note that during the production process errors may be discovered which could affect the content, and all legal disclaimers that apply to the journal pertain.
References
- Anampa J, Makower D, Sparano JA. Progress in adjuvant chemotherapy for breast cancer: an overview. BMC Med. 2015;13:195. doi: 10.1186/s12916-015-0439-8. [DOI] [PMC free article] [PubMed] [Google Scholar]
- Benedito R, Roca C, Sorensen I, Adams S, Gossler A, Fruttiger M, Adams RH. The notch ligands Dll4 and Jagged1 have opposing effects on angiogenesis. Cell. 2009;137:1124–1135. doi: 10.1016/j.cell.2009.03.025. [DOI] [PubMed] [Google Scholar]
- Braun S, Vogl FD, Naume B, Janni W, Osborne MP, Coombes RC, Schlimok G, Diel IJ, Gerber B, Gebauer G, et al. A pooled analysis of bone marrow micrometastasis in breast cancer. The New England journal of medicine. 2005;353:793–802. doi: 10.1056/NEJMoa050434. [DOI] [PubMed] [Google Scholar]
- Cao Z, Ding BS, Guo P, Lee SB, Butler JM, Casey SC, Simons M, Tam W, Felsher DW, Shido K, et al. Angiocrine factors deployed by tumor vascular niche induce B cell lymphoma invasiveness and chemoresistance. Cancer cell. 2014;25:350–365. doi: 10.1016/j.ccr.2014.02.005. [DOI] [PMC free article] [PubMed] [Google Scholar]
- Dotto GP. Crosstalk of Notch with p53 and p63 in cancer growth control. Nat Rev Cancer. 2009;9:587–595. doi: 10.1038/nrc2675. [DOI] [PMC free article] [PubMed] [Google Scholar]
- Duan CW, Shi J, Chen J, Wang B, Yu YH, Qin X, Zhou XC, Cai YJ, Li ZQ, Zhang F, et al. Leukemia propagating cells rebuild an evolving niche in response to therapy. Cancer cell. 2014;25:778–793. doi: 10.1016/j.ccr.2014.04.015. [DOI] [PubMed] [Google Scholar]
- Eckhardt BL, Parker BS, van Laar RK, Restall CM, Natoli AL, Tavaria MD, Stanley KL, Sloan EK, Moseley JM, Anderson RL. Genomic analysis of a spontaneous model of breast cancer metastasis to bone reveals a role for the extracellular matrix. Molecular cancer research : MCR. 2005;3:1–13. [PubMed] [Google Scholar]
- Ell B, Mercatali L, Ibrahim T, Campbell N, Schwarzenbach H, Pantel K, Amadori D, Kang Y. Tumor-induced osteoclast miRNA changes as regulators and biomarkers of osteolytic bone metastasis. Cancer cell. 2013;24:542–556. doi: 10.1016/j.ccr.2013.09.008. [DOI] [PMC free article] [PubMed] [Google Scholar]
- Forozan F, Veldman R, Ammerman CA, Parsa NZ, Kallioniemi A, Kallioniemi OP, Ethier SP. Molecular cytogenetic analysis of 11 new breast cancer cell lines. Br J Cancer. 1999;81:1328–1334. doi: 10.1038/sj.bjc.6695007. [DOI] [PMC free article] [PubMed] [Google Scholar]
- Gu B, Espana L, Mendez O, Torregrosa A, Sierra A. Organ-selective chemoresistance in metastasis from human breast cancer cells: inhibition of apoptosis, genetic variability and microenvironment at the metastatic focus. Carcinogenesis. 2004;25:2293–2301. doi: 10.1093/carcin/bgh272. [DOI] [PubMed] [Google Scholar]
- Hanoun M, Zhang D, Mizoguchi T, Pinho S, Pierce H, Kunisaki Y, Lacombe J, Armstrong SA, Duhrsen U, Frenette PS. Acute myelogenous leukemia-induced sympathetic neuropathy promotes malignancy in an altered hematopoietic stem cell niche. Cell Stem Cell. 2014;15:365–375. doi: 10.1016/j.stem.2014.06.020. [DOI] [PMC free article] [PubMed] [Google Scholar]
- Imbimbo BP. Therapeutic potential of gamma-secretase inhibitors and modulators. Current topics in medicinal chemistry. 2008;8:54–61. doi: 10.2174/156802608783334015. [DOI] [PubMed] [Google Scholar]
- Kang Y, Siegel PM, Shu W, Drobnjak M, Kakonen SM, Cordon-Cardo C, Guise TA, Massague J. A multigenic program mediating breast cancer metastasis to bone. Cancer cell. 2003;3:537–549. doi: 10.1016/s1535-6108(03)00132-6. [DOI] [PubMed] [Google Scholar]
- Kellermann SA, Green LL. Antibody discovery: the use of transgenic mice to generate human monoclonal antibodies for therapeutics. Current opinion in biotechnology. 2002;13:593–597. doi: 10.1016/s0958-1669(02)00354-3. [DOI] [PubMed] [Google Scholar]
- Kos CH, Karaplis AC, Peng JB, Hediger MA, Goltzman D, Mohammad KS, Guise TA, Pollak MR. The calcium-sensing receptor is required for normal calcium homeostasis independent of parathyroid hormone. The Journal of clinical investigation. 2003;111:1021–1028. doi: 10.1172/JCI17416. [DOI] [PMC free article] [PubMed] [Google Scholar]
- Li D, Masiero M, Banham AH, Harris AL. The notch ligand JAGGED1 as a target for anti-tumor therapy. Frontiers in oncology. 2014;4:254. doi: 10.3389/fonc.2014.00254. [DOI] [PMC free article] [PubMed] [Google Scholar]
- Lu J, Ye X, Fan F, Xia L, Bhattacharya R, Bellister S, Tozzi F, Sceusi E, Zhou Y, Tachibana I, et al. Endothelial cells promote the colorectal cancer stem cell phenotype through a soluble form of Jagged-1. Cancer cell. 2013;23:171–185. doi: 10.1016/j.ccr.2012.12.021. [DOI] [PMC free article] [PubMed] [Google Scholar]
- Mendez MJ, Green LL, Corvalan JR, Jia XC, Maynard-Currie CE, Yang XD, Gallo ML, Louie DM, Lee DV, Erickson KL, et al. Functional transplant of megabase human immunoglobulin loci recapitulates human antibody response in mice. Nature genetics. 1997;15:146–156. doi: 10.1038/ng0297-146. [DOI] [PubMed] [Google Scholar]
- Miller AC, Lyons EL, Herman TG. cis-Inhibition of Notch by endogenous Delta biases the outcome of lateral inhibition. Curr Biol. 2009;19:1378–1383. doi: 10.1016/j.cub.2009.06.042. [DOI] [PMC free article] [PubMed] [Google Scholar]
- Paul MK, Bisht B, Darmawan DO, Chiou R, Ha VL, Wallace WD, Chon AT, Hegab AE, Grogan T, Elashoff DA, et al. Dynamic changes in intracellular ROS levels regulate airway basal stem cell homeostasis through Nrf2-dependent Notch signaling. Cell Stem Cell. 2014;15:199–214. doi: 10.1016/j.stem.2014.05.009. [DOI] [PMC free article] [PubMed] [Google Scholar]
- Pitt LA, Tikhonova AN, Hu H, Trimarchi T, King B, Gong Y, Sanchez-Martin M, Tsirigos A, Littman DR, Ferrando AA, et al. CXCL12-Producing Vascular Endothelial Niches Control Acute T Cell Leukemia Maintenance. Cancer cell. 2015;27:755–768. doi: 10.1016/j.ccell.2015.05.002. [DOI] [PMC free article] [PubMed] [Google Scholar]
- Polverino A, Coxon A, Starnes C, Diaz Z, DeMelfi T, Wang L, Bready J, Estrada J, Cattley R, Kaufman S, et al. AMG 706, an oral, multikinase inhibitor that selectively targets vascular endothelial growth factor, platelet-derived growth factor, and kit receptors, potently inhibits angiogenesis and induces regression in tumor xenografts. Cancer Res. 2006;66:8715–8721. doi: 10.1158/0008-5472.CAN-05-4665. [DOI] [PubMed] [Google Scholar]
- Reedijk M, Odorcic S, Chang L, Zhang H, Miller N, McCready DR, Lockwood G, Egan SE. High-level coexpression of JAG1 and NOTCH1 is observed in human breast cancer and is associated with poor overall survival. Cancer Res. 2005;65:8530–8537. doi: 10.1158/0008-5472.CAN-05-1069. [DOI] [PubMed] [Google Scholar]
- Ren G, Zhang L, Zhao X, Xu G, Zhang Y, Roberts AI, Zhao RC, Shi Y. Mesenchymal stem cell-mediated immunosuppression occurs via concerted action of chemokines and nitric oxide. Cell Stem Cell. 2008;2:141–150. doi: 10.1016/j.stem.2007.11.014. [DOI] [PubMed] [Google Scholar]
- Ridgway J, Zhang G, Wu Y, Stawicki S, Liang WC, Chanthery Y, Kowalski J, Watts RJ, Callahan C, Kasman I, et al. Inhibition of Dll4 signalling inhibits tumour growth by deregulating angiogenesis. Nature. 2006;444:1083–1087. doi: 10.1038/nature05313. [DOI] [PubMed] [Google Scholar]
- Rizzo P, Osipo C, Foreman K, Golde T, Osborne B, Miele L. Rational targeting of Notch signaling in cancer. Oncogene. 2008;27:5124–5131. doi: 10.1038/onc.2008.226. [DOI] [PubMed] [Google Scholar]
- Sethi N, Dai X, Winter CG, Kang Y. Tumor-derived JAGGED1 promotes osteolytic bone metastasis of breast cancer by engaging notch signaling in bone cells. Cancer cell. 2011;19:192–205. doi: 10.1016/j.ccr.2010.12.022. [DOI] [PMC free article] [PubMed] [Google Scholar]
- Shiozawa Y, Pedersen EA, Havens AM, Jung Y, Mishra A, Joseph J, Kim JK, Patel LR, Ying C, Ziegler AM, et al. Human prostate cancer metastases target the hematopoietic stem cell niche to establish footholds in mouse bone marrow. The Journal of clinical investigation. 2011;121:1298–1312. doi: 10.1172/JCI43414. [DOI] [PMC free article] [PubMed] [Google Scholar]
- Sprinzak D, Lakhanpal A, Lebon L, Santat LA, Fontes ME, Anderson GA, Garcia-Ojalvo J, Elowitz MB. Cis-interactions between Notch and Delta generate mutually exclusive signalling states. Nature. 2010;465:86–90. doi: 10.1038/nature08959. [DOI] [PMC free article] [PubMed] [Google Scholar]
- Wan L, Lu X, Yuan S, Wei Y, Guo F, Shen M, Yuan M, Chakrabarti R, Hua Y, Smith HA, et al. MTDH-SND1 interaction is crucial for expansion and activity of tumor-initiating cells in diverse oncogene- and carcinogen-induced mammary tumors. Cancer cell. 2014;26:92–105. doi: 10.1016/j.ccr.2014.04.027. [DOI] [PMC free article] [PubMed] [Google Scholar]
- Wang H, Yu C, Gao X, Welte T, Muscarella AM, Tian L, Zhao H, Zhao Z, Du S, Tao J, et al. The Osteogenic Niche Promotes Early-Stage Bone Colonization of Disseminated Breast Cancer Cells. Cancer cell. 2015 doi: 10.1016/j.ccell.2014.11.017. [DOI] [PMC free article] [PubMed] [Google Scholar]
- Weilbaecher KN, Guise TA, McCauley LK. Cancer to bone: a fatal attraction. Nat Rev Cancer. 2011;11:411–425. doi: 10.1038/nrc3055. [DOI] [PMC free article] [PubMed] [Google Scholar]
Associated Data
This section collects any data citations, data availability statements, or supplementary materials included in this article.
Supplementary Materials
Representative μCT 3D construction of hind limb bone from SCP28-Vector cell injected mice. Provided as a mpg file.
Representative μCT 3D construction of hind limb bone from SCP28-Jagged1 cell injected, IgG antibody treated mice. Provided as a mpg file.
Representative μCT 3D construction of hind limb bone from SCP28-Jagged1 cell injected, 15D11 antibody treated m ice. Provided as a mpg file.
Representative micro-CT 3D construction of hind limb bone from SCP28-Jagged1 cell injected, OPG treated mice. Provided as a mpg file.
3D construction of confocal images from PBS pre-treated, SCP28 injected mice (4Days post IIA injection). Provided as a mpg file.
3D construction of confocal images from cisplatin pre-treated, SCP28 injected mice (4Days post IIA injection). Provided as a mpg file.