

Abstract
Ambient air pollution from ground-level ozone and fine particulate matter (PM2.5) is associated with premature mortality. Future concentrations of these air pollutants will be driven by natural and anthropogenic emissions and by climate change. Using anthropogenic and biomass burning emissions projected in the four Representative Concentration Pathway scenarios (RCPs), the ACCMIP ensemble of chemistry-climate models simulated future concentrations of ozone and PM2.5 at selected decades between 2000 and 2100. We use output from the ACCMIP ensemble, together with projections of future population and baseline mortality rates, to quantify the human premature mortality impacts of future ambient air pollution. Future air pollution-related premature mortality in 2030, 2050 and 2100 is estimated for each scenario and for each model using a health impact function based on changes in concentrations of ozone and PM2.5 relative to 2000 and projected future population and baseline mortality rates. Additionally, the global mortality burden of ozone and PM2.5 in 2000 and each future period is estimated relative to 1850 concentrations, using present-day and future population and baseline mortality rates. The change in future ozone concentrations relative to 2000 is associated with excess global premature mortality in some scenarios/periods, particularly in RCP8.5 in 2100 (316 thousand deaths/year), likely driven by the large increase in methane emissions and by the net effect of climate change projected in this scenario, but it leads to considerable avoided premature mortality for the three other RCPs. However, the global mortality burden of ozone markedly increases from 382,000 (121,000 to 728,000) deaths/year in 2000 to between 1.09 and 2.36 million deaths/year in 2100, across RCPs, mostly due to the effect of increases in population and baseline mortality rates. PM2.5 concentrations decrease relative to 2000 in all scenarios, due to projected reductions in emissions, and are associated with avoided premature mortality, particularly in 2100: between −2.39 and −1.31 million deaths/year for the four RCPs. The global mortality burden of PM2.5 is estimated to decrease from 1.70 (1.30 to 2.10) million deaths/year in 2000 to between 0.95 and 1.55 million deaths/year in 2100 for the four RCPs, due to the combined effect of decreases in PM2.5 concentrations and changes in population and baseline mortality rates. Trends in future air pollution-related mortality vary regionally across scenarios, reflecting assumptions for economic growth and air pollution control specific to each RCP and region. Mortality estimates differ among chemistry-climate models due to differences in simulated pollutant concentrations, which is the greatest contributor to overall mortality uncertainty for most cases assessed here, supporting the use of model ensembles to characterize uncertainty. Increases in exposed population and baseline mortality rates of respiratory diseases magnify the impact on premature mortality of changes in future air pollutant concentrations and explain why the future global mortality burden of air pollution can exceed the current burden, even where air pollutant concentrations decrease.
1 Introduction
Ambient air pollution has adverse effects on human health, including premature mortality. Exposure to ground-level ozone is associated with respiratory mortality (e.g. Bell et al., 2005; Gryparis et al., 2004; Jerrett et al., 2009; Levy et al., 2005). Exposure to fine particulate matter with aerodynamic diameter less than 2.5 μm (PM2.5) is associated with mortality due to cardiopulmonary diseases and lung cancer (e.g. Brook et al., 2010; Burnett et al., 2014; Hamra et al., 2014; Krewski et al., 2009; Lepeule et al., 2012). Previous studies have estimated the present-day global burden of disease due to exposure to ambient ozone and/or PM2.5 (e.g., Apte et al., 2015; Evans et al., 2013; Forouzanfar et al., 2015), with several studies estimating this burden using only output of global atmospheric models (Anenberg et al., 2010; Fang et al., 2013a; Lelieveld et al., 2013; Rao et al., 2012; Silva et al., 2013). However, few studies have evaluated how the global burden might change in future scenarios (Lelieveld et al., 2015; Likhvar et al., 2015; West et al., 2007). Other global studies have estimated future air pollution-related mortality as a by-product of analyses of other future changes, such as the effects of climate change or of climate change mitigation (e.g., Fang et al., 2013b; Selin et al., 2009; West et al., 2013), but do not focus on the range of plausible future mortality as their main purpose. Similarly, studies at local and regional scales have evaluated the mortality impact of changes in air quality due to future climate change (Bell et al., 2007; Chang et al., 2010; Fann et al., 2015; Heal et al., 2012; Jackson et al., 2010; Knowlton et al., 2004, 2008; Orru et al., 2013; Post et al., 2012; Sheffield et al., 2011; Tagaris et al., 2009) but few such studies have evaluated changes beyond 2050.
Future ambient air quality will be influenced by changes in emissions of air pollutants and by climate change. Changes in anthropogenic emissions will likely dominate in the near-term (Kirtman et al., 2013 and references therein), and depend on several socio-economic factors including economic growth, energy demand, technological choices and developments, demographic trends and land use change, as well as air quality and climate policies. Climate change will affect the ventilation, dilution, and removal of air pollutants, the frequency of stagnation, photochemical reaction rates, stratosphere−troposphere exchange of ozone, and natural emissions (Fiore et al., 2012, 2015; Jacob and Winner, 2009; von Schneidemesser et al., 2015; Weaver et al., 2009). Climate change is likely to increase ozone in polluted regions during the warm season, particularly in urban areas and during pollution episodes. In remote regions, however, ozone is likely to decrease due to greater water vapor concentrations, which increase the loss of ozone by photolysis and subsequent formation of hydroxyl radicals (Doherty et al, 2013). The effects of climate change on PM2.5 concentrations are generally uncertain as changes in temperature affect both reaction rates and gas to particle partitioning as well as wildfires and biogenic emissions, and vary regionally primarily due to differing projections of changes in precipitation (Fiore et al., 2012, 2015; Fuzzi et al., 2015; Jacob and Winner, 2009; von Schneidemesser et al., 2015; Weaver et al., 2009).
The Atmospheric Chemistry and Climate Model Intercomparison Project (ACCMIP) simulated preindustrial (1850), present-day (2000) and future (2030, 2050 and 2100) concentrations of ozone and PM2.5 with an ensemble of 14 state-of-the-art chemistry climate models (Table S1) (Lamarque et al., 2013, Stevenson et al., 2013) to support the IPCC’s Fifth Assessment Report. Using modeled 1850 and 2000 concentrations from this ensemble, we showed previously that exposure to present-day anthropogenic ambient air pollution is associated with 470 (95% Confidence Interval (CI): 140, 900) thousand deaths/year from ozone-related respiratory diseases, and 2.1 (1.3, 3.0) million deaths/year from PM2.5-related cardiopulmonary diseases and lung cancer (Silva et al., 2013). These results were obtained for a wider range of cardiopulmonary diseases and using a different exposure-response model for PM2.5 mortality than the present study, as discussed later.
The ACCMIP models simulated future air quality for specific periods through 2100, for four global greenhouse gas (GHG) and air pollutant emission scenarios projected in the Representative Concentration Pathways (RCPs) (Van Vuuren et al., 2011a and references therein). The four RCPs were developed by different research groups with different assumptions regarding the pathways of population growth, economic and technological development, and air quality and climate policies. Anthropogenic radiative forcing in 2100 ranges from a very low level in the mitigation scenario RCP2.6 (Van Vuuren et al., 2011b), to medium levels in the two stabilization scenarios, RCP4.5 (Thomson et al., 2011) and RCP 6.0 (Masui et al., 2011), to a high level in the very high baseline emissions scenario RCP8.5 (Riahi et al., 2011). All RCPs assume increasingly stringent air pollution controls as countries develop economically, leading to decreases in air pollutant emissions that reflect the different methods of the different RCP groups (e.g., Smith et al., 2011). But as assumptions are similar among the RCPs, the four scenarios do not span the range of possible futures published in the literature for short-term species. For example, other studies have simulated scenarios in which air pollution controls are kept at current levels while underlying trends (e.g., energy use) increase overall emissions (Lelieveld et al., 2015; Likhvar et al., 2015). While most air pollutants are projected to decrease, ammonia increases in all RCPs due to the projected increase in population and food demand, and methane increases in RCP8.5 because of its projected rise in livestock and rice production. However, these scenarios follow different pathways in different regions. In some regions, emissions increase to mid-century before decreasing, while in other regions emissions are already decreasing at present and continue decreasing to 2100. Models in the ACCMIP ensemble incorporate chemistry-climate interactions, including mechanisms by which climate change affects ozone and PM2.5, although models do not all include the same mechanisms of interactions and do not always agree on the net effect of these interactions (von Schneidemesser et al., 2015).
Using modeled ozone and PM2.5 concentrations from the ACCMIP ensemble, we estimate the future premature human mortality associated with exposure to ambient air pollution. Our premature mortality estimates are obtained using a health impact function, combining the relative risk of exposure to changes in air pollution with future exposed population and cause-specific baseline mortality rates. We estimate overall future premature mortality considering the difference in air pollution associated with 2030, 2050 and 2100 emissions and climate relative to that resulting from 2000 emissions and climate. Mortality estimates are obtained at a sufficiently fine horizontal resolution (0.5°×0.5°) to capture both global and regional effects and inform regional and national air quality and climate change policy, but are not expected to capture local scale (e.g., urban) air pollution effects.
2 Methods
2.1 Ambient ozone and PM2.5 concentrations
Concentrations of ozone and PM2.5 in surface air are calculated for the present day (2000) and for the 2030, 2050 and 2100 decades for the four RCPs using the output of simulations by the ACCMIP ensemble of chemistry-climate models. As described by Lamarque et al. (2013) not all models are truly coupled chemistry climate models. OsloCTM2 and MOCAGE are chemical transport models driven by offline meteorological fields, and UM-CAM and STOC-HadAM3 do not model the feedback of chemistry on climate.
All ACCMIP models used nearly identical anthropogenic and biomass burning emissions for the present day and future, but they used different natural emissions (e.g. biogenic volatile organic compounds, ocean emissions, soil and lightning NOx), which mostly impacted emissions of ozone precursors (Lamarque et al., 2013; Young et al., 2013) and natural aerosols (i.e., dust and sea salt). Model output shows good agreement with recent observations, both for ozone (Young et al., 2013) and for PM2.5 (Shindell et al., 2013), although models tend to overestimate ozone in the Northern Hemisphere and underestimate it in the Southern Hemisphere, and to underestimate PM2.5, particularly in East Asia. Future surface concentrations of air pollutants vary across scenarios and models, but ozone is projected to decrease except in RCP8.5, mostly associated with the large increase in methane concentrations specific to this scenario and the effect of climate change in remote regions (von Schneidemesser et al., 2015; Young et al., 2013).
We obtained hourly and monthly output from the ACCMIP ensemble simulations for a base year (2000) and for future projections under the four RCPs (2030, 2050 and 2100), with each time period corresponding to simulations of up to 10 years, depending on the model. Only two models reported results for all four RCP scenarios and the three future time periods – GFDL-AM3 and GISS-E2-R. PM2.5 is calculated as a sum of aerosol species reported by six models (see Supplemental Material), and four of these models also reported their own estimate of total PM2.5 (Table S1). Our PM2.5 formula includes nitrate; since this species was reported by three models only, we calculate the average nitrate concentrations in each cell reported by these models and add this average to PM2.5 for the other models, following Silva et al. (2013). We use our PM2.5 estimates to obtain all mortality results, and perform a sensitivity analysis using the PM2.5 concentrations reported by four models using their own PM2.5 formulas, which differed among models, as done by Silva et al. (2013). The native grid resolutions of the 14 models varied from 1.9°×1.2° to 5°×5°; we regrid ozone and PM2.5 species surface concentrations from each model to a common 0.5°×0.5° horizontal grid to take maximum advantage of how the grids of different models overlap, following Anenberg et al. (2009, 2014) and Silva et al. (2013).
Ozone and PM2.5 concentrations are calculated in each grid cell for each model separately. For both pollutants, we use identical metrics to those reported in the epidemiological studies we considered for the health impact assessment (next section):
-
▪
Seasonal average of daily 1-hr maximum ozone concentration, for the six consecutive months with highest concentrations in each grid cell;
-
▪
Annual average PM2.5 concentration.
Among the 14 models, five models reported only monthly ozone concentrations, while the remaining models reported both hourly and monthly values. We calculate the ratio of the seasonal average of daily 1-hr maximum to the annual average of monthly concentrations, for each scenario/year, for those that reported both hourly and monthly concentrations. Then we apply that ratio to the annual average of monthly ozone concentrations for the former five models, as previously done by Silva et al. (2013). The differences in ozone and PM2.5 concentrations between future year (2030, 2050 and 2100) and 2000 are shown in Tables S2 and S3, for each model. For ten world regions (Figure S1), we also estimate regional multi-model averages for each scenario/year (Figures S2 and S3).
2.2 Health impact assessment
We estimate future air pollution-related cause-specific premature mortality using generally the same methods as those used by Silva et al. (2013) to obtain present-day estimates, but with two important differences: (1) we use the recently published Integrated Exposure-Response (IER) model for PM2.5 (Burnett et al., 2014) instead of a log-linear model (Krewski et al., 2009), and (2) we use projections of population and baseline mortality rates from the International Futures (IFs) integrated modeling system (Hughes et al., 2011).
We apply a health impact function to estimate premature mortality associated with exposure to ozone and PM2.5 ambient air pollution (ΔMort) in each grid cell: ΔMort = y0 * AF *Pop, where y0 is the baseline mortality rate (for the exposed population), AF = 1 – 1/RR is the attributable fraction, RR is the relative risk of death attributable to a change in pollutant concentrations, (RR=1 if there is no increased risk of death associated with a change in pollutant concentrations), and Pop is the exposed population (adults aged 25 and older). We calculate changes in premature mortality by applying the change in pollutant concentrations in each future year (2030, 2050 and 2100) relative to year 2000 concentrations - the present-day state of air pollution - to the future population. To estimate ozone mortality, we apply the exposure-response function to the difference in ozone concentrations, while for PM2.5 mortality we apply the exposure-response function to concentrations in each year (future years and 2000) and then subtract the mortality estimates. We therefore estimate ‘avoided’ / ‘excess’ premature mortality due to decreases / increases in air pollutant concentrations in the future years relative to 2000 concentrations. This approach differs from a calculation of the global burden of air pollution-related mortality since we use 2000 rather than 1850 concentrations as baseline. We estimate mortality changes due to future concentration changes, relative to the present, to avoid applying the health impact function at very low concentrations where there is less confidence in the exposure-response relationship. For example, the simulated 1850 air pollutant concentrations are often below the lowest measured value of the American Cancer Society study (Jerrett et al., 2009; Krewski et al., 2009). For illustration, we also estimate mortality relative to 1850 concentrations, which could be regarded as global burden of disease calculations, following Silva et al. (2013).
For each model, we estimate ozone-related mortality due to chronic respiratory diseases (RESP), using RR from Jerrett et al. (2009). We also estimate PM2.5-related mortality due to ischemic heart disease (IHD), cerebrovascular disease (STROKE), chronic obstructive pulmonary disease (COPD) and lung cancer (LC), using RRs from the IER model (Burnett et al., 2014). We use RR per age group for IHD and STROKE and RR for all-ages for COPD and LC. We apply the IER model instead of RRs from Krewski et al. (2009), used by Silva et al. (2013), as the newer model should better represent the risk of exposure to PM2.5, particularly at locations with high ambient concentrations. In the IER model, the concentration-response function flattens off at higher PM2.5 concentrations yielding different estimates of excess mortality for identical changes in air pollutant concentrations in less-polluted vs. highly-polluted locations. Specifically, a one unit reduction of air pollution may have a stronger effect on avoided mortality per million people in regions where pollution levels are lower (e.g. Europe, North America, etc.) compared with highly-polluted areas (e.g. East Asia, India, etc.), which would not be the case for a log-linear function (Jerrett et al. 2009; Krewski et al. 2009). Therefore, using the IER model may result in smaller changes in avoided mortality in highly-polluted areas than using the log-linear model.
Each RCP includes its own projection of total population, but not population health characteristics. For all scenarios, we choose to use a common projection of population and baseline mortality rates per age group from the IFs (Figures S6 and S7). IFs projects population and mortality based on UN and WHO projections from 2010 through 2100, per age group and country, mostly based on three drivers – income, education, and technology (Hughes et al., 2011). Population projections from IFs differ from those underlying each RCP, but lie within the range of the RCPs (Figure S6). In 2030, global total population in IFs is within 0.08% of that reported for RCP2.6, RCP4.5 and RCP6.0 and 5% lower than for RCP8.5; however, in 2100 IFs projects larger global populations than RCP2.6 (+7%), RCP4.5 (+13%) and RCP6.0 (+2%) and considerably lower than RCP8.5 (−27%). IFs projects rising baseline mortality rates for cardiovascular diseases (CVD) and RESP, globally and in most regions (particularly in East Asia and India), reflecting an aging population. By using projections from IFs, we have a single source of population and baseline mortality rates, assuring their consistency and enabling us to isolate the effect of changes in air pollutant concentrations across the RCPs. Had we used the population projections from each scenario, the magnitude of the changes (increases or decreases in premature mortality relative to 2000) would likely increase in RCP8.5, but decrease in RCP2.6, RCP4.5 and RCP6.0. With the exception of Europe, Former Soviet Union (FSU) and East Asia, where population is projected to decrease in 2100 relative to 2000, had we used present-day population and baseline mortality we would have obtained lower estimates for excess or avoided mortality in each scenario/year, as projected increases in population and baseline mortality magnify the impact of changes in air pollutant concentrations. Therefore, we estimate the overall effect of future air pollution (due to changes in emissions and climate change) considering the population that will potentially be exposed to those effects. We also obtain different estimates of changes in future mortality than if we had calculated the global burden in each year, using air pollutant concentrations, population and baseline mortality rates in that year, and subtracted the present-day burden. Our results do not reflect the potential synergistic effect of a warmer climate on air pollution-related mortality, i.e. we do not account for potential changes in the exposure-response relationships at higher temperatures (Pattenden et al. 2010; Wilson et al., 2014 and references therein).
Country-level population projections for 2030, 2050 and 2100 are gridded to 0.5°×0.5° using ArcGIS 10.2 geoprocessing tools, assuming that the spatial distribution of total population within each country is unchanged from the 2011 LandScan Global Population Dataset at approximately 1 km resolution (Bright et al., 2012), and that the exposed population is distributed in the same way as the total population within each country. IFs projections of mortality rates for CVD are used to estimate baseline mortality rates for IHD and STROKE considering their present-day proportion in CVD (using GBD 2010 baseline mortality rates), as are RESP projections for COPD and malignant neoplasms for LC. IFs projections for 2010 are comparable to GBD 2010 (Lozano et al., 2012) estimates for CVD (+0.04%), RESP (+2.5%) and neoplasms (−12%). We estimate the number of deaths per 5-year age group per country using the country level population. The resulting population and baseline mortality per age group at 30″×30″ are regridded to the same 0.5°×0.5° grid as the concentrations of air pollutants.
Uncertainty from the RRs is propagated separately for each model-scenario-year to mortality estimates in each grid cell, through 1000 Monte Carlo (MC) simulations, i.e. we repeat the calculations in each grid cell 1000 times using random sampling of the RR variable. For ozone, we use the reported 95% Confidence Intervals (CIs) for RR (Jerrett et al., 2009) and assume a normal distribution, while for PM2.5 we use the values for the parameters alpha, gamma, delta and zcf (counterfactual) reported by Burnett et al. (2014) for 1000 MC simulations (GHDx 2013). Then for each of the 1000 simulations, we add mortality over many grid cells to obtain regional and global mortality and estimate the empirical mean and 95% CI of the regional and global mortality results. We assume no correlation between the RRs for the four causes of death; thus we may underestimate the overall uncertainty for PM2.5 mortality estimates. Uncertainty in air pollutant concentrations is based on the spread of model results by calculating the average and 95% CI for the pooled results of the 1000 MC simulations for each model. This estimate of uncertainty in concentrations does not account for uncertainty in emissions inventories (as the ensemble used identical emissions) or for potential bias in modelled air pollutant concentrations. We also estimate the contribution of uncertainties in RR and in air pollutant concentrations to the overall uncertainty in mortality estimates using a tornado analysis; we obtained global mortality estimates treating each variable as uncertain individually (year 2000 concentrations, future year concentrations, RR for ozone and the four parameters in the IER model for PM2.5) and used central estimates for all other variables, and then calculated the contribution of each variable to the overall uncertainty (when all variables are treated as uncertain simultaneously). Uncertainties associated with population and baseline mortality rates are not reported by IFs, and are not considered in the uncertainty analysis.
3 Results
First, we present our estimates of ozone and PM2.5-related excess/avoided premature mortality in 2030, 2050 and 2100 for changes in pollutant concentrations between 2000 and each future period, for the four RCPs (sections 3.1 and 3.2, Figures 1 to 7). Figures 1 and 4 show global mortality for the different ACCMIP models. The multi-model average mortality results are shown for individual grid cells (Figures 2 and 5) and for regional totals (Figures 3 and 6). Finally, we include our estimates of the global mortality burden of both air pollutants for future concentrations relative to 1850 concentrations (section 3.3, Figures 8 and 9). In some cases, the changes in future mortality due to changes in future concentrations relative to 2000 show a different trend than the global mortality burden; this difference reflects the combined effects of future changes in concentrations relative to 1850, exposed population and baseline mortality rates.
Figure 1.
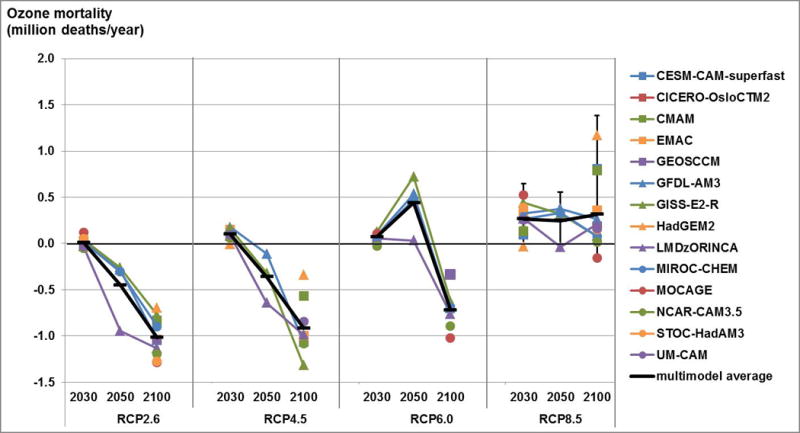
Estimates of future ozone respiratory mortality for all RCP scenarios in 2030, 2050 and 2100, showing global mortality for 13 models and the multi-model average (million deaths/year), for future air pollutant concentrations relative to 2000 concentrations. Uncertainty for the multi-model average shown for RCP8.5 is the 95% CI including uncertainty in RR and across models. Only models with results for the three years have lines connecting the markers.
Figure 7.
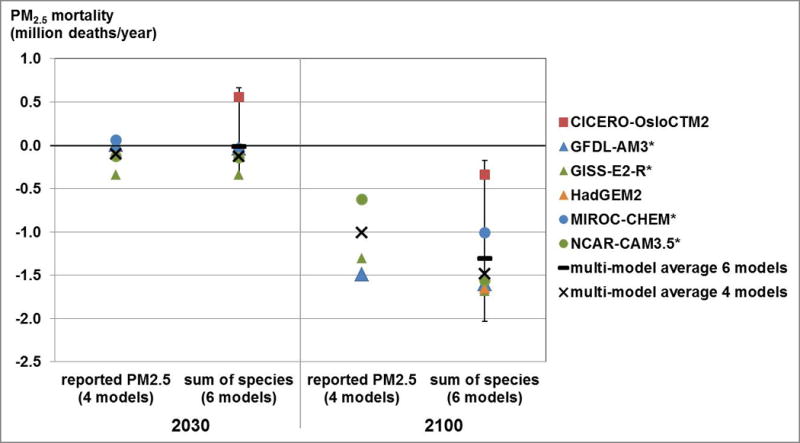
Estimates of global future premature mortality (IHD+STROKE+COPD+LC) for RCP8.5 in 2030 and 2100, for PM2.5 reported by four models and PM2.5 estimated as a sum of species for six models, showing global mortality for each model and the multi-model average (million deaths/year), for future air pollutant concentrations relative to 2000 concentrations. Models signaled with * reported their own estimate of PM2.5. Uncertainty shown for six models for sum of species is the 95% CI including uncertainty in RR and across models.
Figure 4.
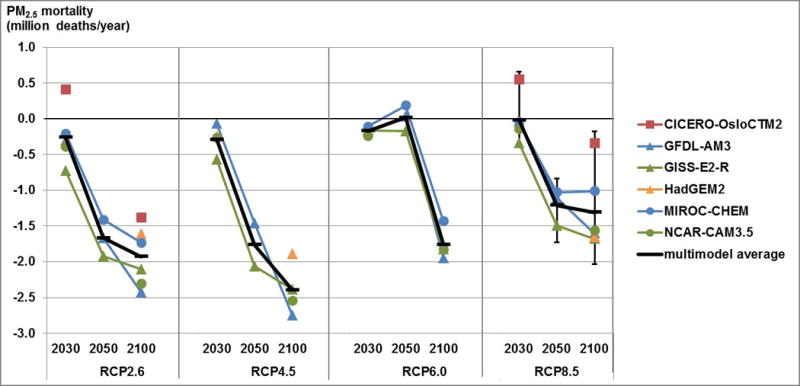
Estimates of future premature mortality (IHD+STROKE+COPD+LC) for PM2.5 calculated as a sum of species, for all RCP scenarios in 2030, 2050 and 2100, showing global mortality for six models and the multi-model average (million deaths/year), for future air pollutant concentrations relative to 2000 concentrations. Uncertainty shown for the RCP8.5 multi-model average is the 95% CI including uncertainty in RR and across models.
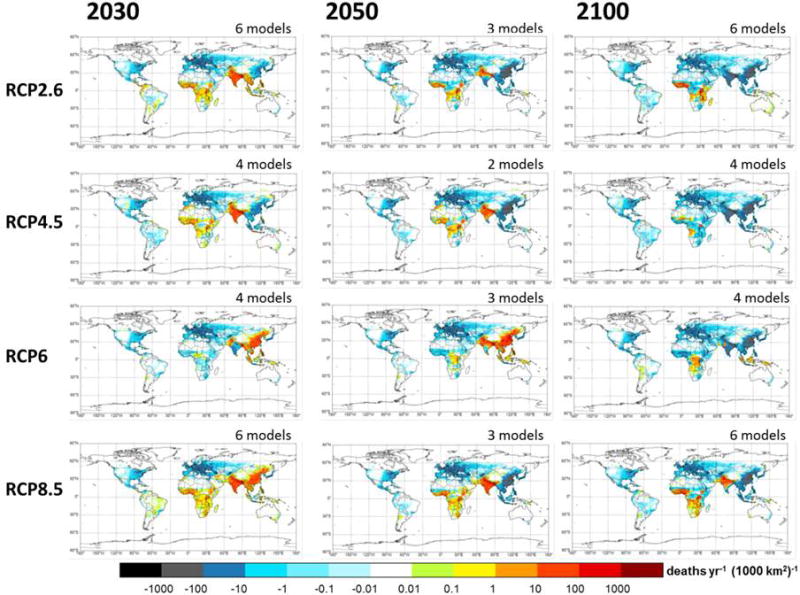
Figure 2.
Future ozone respiratory mortality for all RCP scenarios in 2030, 2050 and 2100, showing the multi-model average in each grid cell, for future air pollutant concentrations relative to 2000 concentrations.
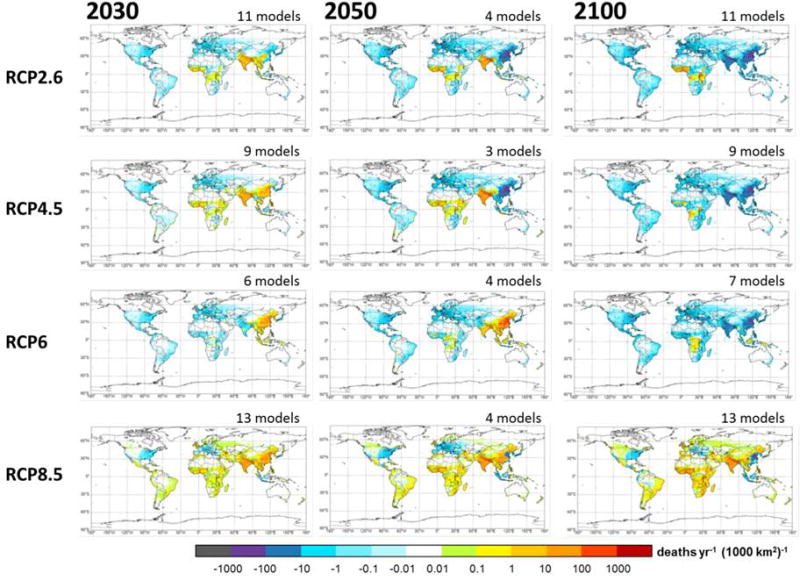
Figure 5.
Future premature mortality (IHD+STROKE+COPD+LC) for PM2.5 calculated as a sum of species, for all RCP scenarios in 2030, 2050 and 2100, showing the multi-model average in each grid cell, for future air pollutant concentrations relative to 2000 concentrations.
Figure 3.
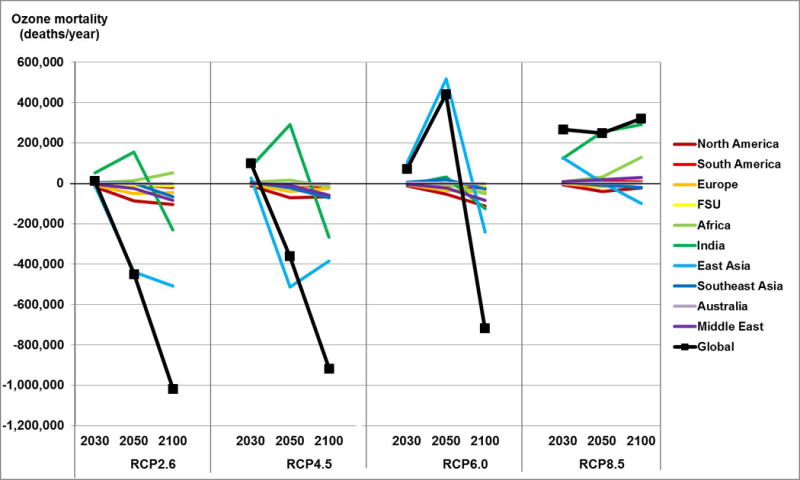
Future ozone respiratory mortality for all RCP scenarios in 2030, 2050 and 2100, showing the multi-model regional average (deaths/year) in ten world regions (Figure S1) and globally, for future air pollutant concentrations relative to 2000 concentrations.
Figure 6.
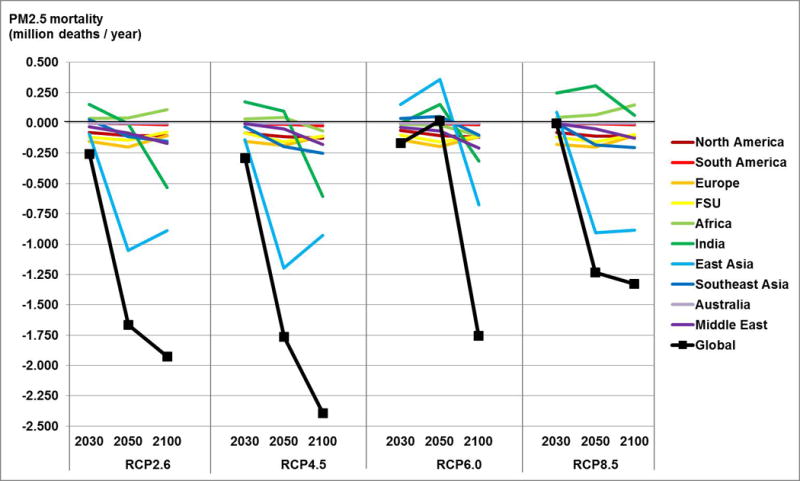
Future premature mortality (IHD+STROKE+COPD+LC) for PM2.5 calculated as a sum of species, for all RCP scenarios in 2030, 2050 and 2100, showing the multi-model regional average (deaths/year) in ten world regions (Figure S1) and globally, for future air pollutant concentrations relative to 2000 concentrations.
Figure 8.
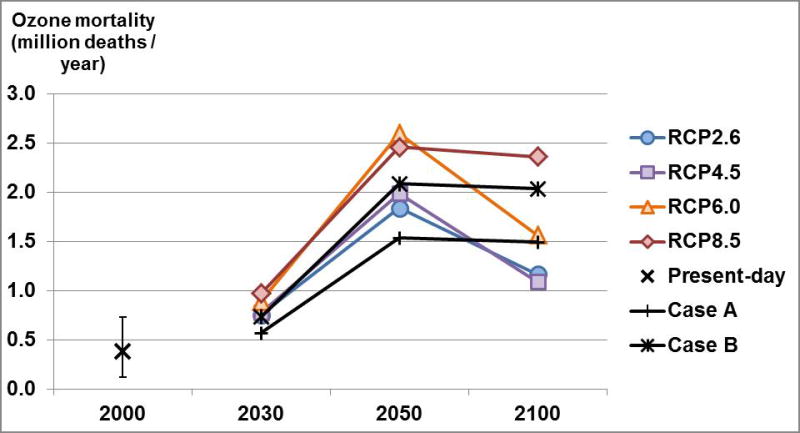
Global burden on mortality of ozone concentrations relative to 1850, in the present day for 2000 concentrations, showing multi-model average and 95% CI including uncertainty in RR and across models (deaths/year), and in 2030, 2050 and 2100 for all RCPs, showing multi-model averages (deaths/year) given by the deterministic values. Also shown are future burdens using (Case A) 2000 concentrations relative to 1850 and present-day population but future baseline mortality rates and (Case B) 2000 concentrations relative to 1850 but future population and baseline mortality rates.
Figure 9.
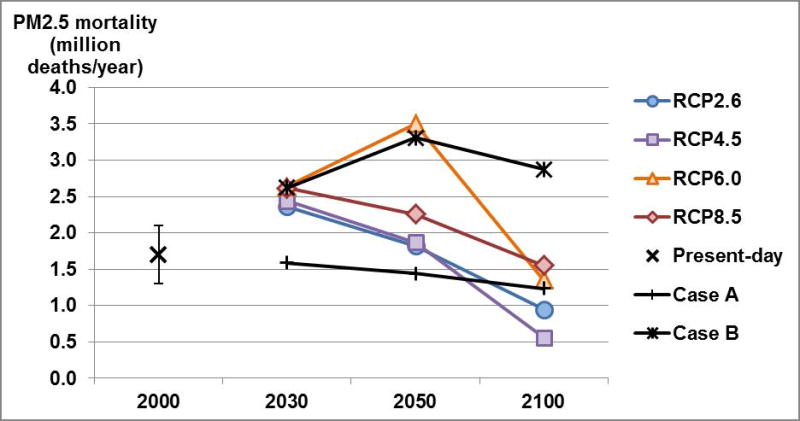
Global burden on mortality of PM2.5 concentrations relative to 1850, in the present day for 2000 concentrations, showing multi-model average and 95% CI including uncertainty in RR and across models (deaths/year), and in 2030, 2050 and 2100 for all RCPs, showing multi-model averages (deaths/year) given by the deterministic values. Also shown are future burdens using (Case A) 2000 concentrations relative to 1850 and present-day population but future baseline mortality rates and (Case B) 2000 concentrations relative to 1850 but future population and baseline mortality rates.
3.1 Ozone-related future premature mortality
We find that future changes in ozone concentrations are associated with excess global premature mortality due to respiratory diseases in 2030, but avoided mortality by 2100 for all scenarios but RCP8.5 (Figure 1, Table S5). In 2030, all RCPs show excess multi-model average ozone mortality, ranging from 11,900 (RCP2.6)to 264,000 (RCP8.5) deaths/year. For each RCP, however, some models yield avoided mortality in 2030. In 2050, multi-model averages are obtained from only 3 or 4 models, depending on the scenario, which makes it difficult to compare with the other two periods. In 2100, we estimate excess ozone mortality in RCP8.5 (316,000 deaths/year), but avoided ozone mortality for the other three RCPs from −1.02 million (RCP2.6) to −718,000 (RCP6.0) deaths/year with all models agreeing in sign of the change.
Excess ozone-related future premature mortality (Figures 2 and 3, Table S6) is noticeable in some regions in 2030 for all RCPs, particularly in India and East Asia for RCP8.5 (over 95% of global excess mortality), but all scenarios except RCP8.5 show avoided global ozone-related mortality in 2100. Under this scenario in 2100, there are increases in ozone concentrations in all regions except North America, East Asia and Southeast Asia (Figure S2), likely driven by the projected large increase in methane emissions as well as by climate change. Avoided mortality in those three regions is outweighed by excess mortality in India, Africa and the Middle East. Also, some regions show different trends in future mortality relative to 2000 depending on the RCP, reflecting the effects of distinct assumptions in each RCP about economic growth and air pollution control with different trends in regional ozone precursor emissions. For example, North America and Europe show decreases in mortality through 2100 in all scenarios, except a slight increase in Europe for RCP8.5 in 2100. In East Asia, mortality peaks in 2050 for RCP6.0, driven by peak precursor emissions in 2050 in this scenario, but it peaks in 2030 for the other three RCPs. India shows peaks in mortality in 2050 followed by decreases for all RCPs but RCP8.5, in which mortality increases through 2100. Africa shows increases in mortality through 2100 for RCP2.6 and RCP8.5, while it peaks in 2050 for RCP4.5 and decreases through 2100 for RCP6.0. Also, the effect of changes in population and baseline mortality rates is noticeable in some regions when comparing the trends in total ozone-related mortality and mortality per million people in each region (Figure S10). For example, decreases in population projected for 2100 in Europe, FSU and East Asia, are reflected in greater changes in mortality per million people than in total mortality, while the threefold increase in population in Africa amplifies the changes in total mortality.
For RCP8.5, we propagate input uncertainty to the mortality estimates (Figure 1, Table S5). Global future premature mortality changes from 264,000 (−39,300 to 648,000) deaths in 2030 to 316,000 (−187,000 to 1.38 million) deaths in 2100. Uncertainty in RR leads to coefficients of variation (CV) ranging from 31 to 37% (2030), 31 to 40% (2050) and 16 to 47% (2100) for the different models. Considering the spread of model results, overall CV for the multi-model average mortality increases to 66% (2030), 78% (2050) and 125% (2100). While uncertainty in RR and in modeled ozone concentrations have similar contributions to overall uncertainty in mortality results in 2050 (51% and 49%, respectively), in 2030 modeled ozone concentrations are the greatest contributor (81%), and in 2100 uncertainty in RR contributes the most to overall uncertainty (88%). For 2030, HadGEM2 differs in sign from the other 13 models with (avoided) global mortality totalling −33,900 deaths/year. For 2050, LMDzORINCA differs substantially from the other 3 models with −38,900 deaths/year. For 2100, HadGEM2 is a noticeable outlier with 1.2 million excess deaths/year and MOCAGE differs in sign from the other 12 models with −159,000 deaths/year.
3.2 PM2.5-related future premature mortality
Global PM2.5-related premature mortality, considering the difference in future concentrations and 2000 concentrations, decreases substantially in most scenarios, particularly in 2100 (Figure 4, Table S7). In 2030, the multi-model average varies from −289,000 (RCP4.5) to 17,200 (RCP8.5) deaths/year, although one model (CICERO-OsloCTM2) shows excess mortality for RCP2.6 and RCP8.5. In 2050, substantial avoided mortality is estimated for all scenarios except RCP6.0 which shows a small increase in mortality (16,700 deaths/year), but this is the average of only three models that do not agree on the sign of the change. In 2100, all scenarios show considerable avoided mortality, ranging from −1.31 million (RCP8.5) to −2.39 million (RCP4.5) deaths/year, reflecting the substantial decrease in emissions of primary PM2.5 and precursors.
In several regions (North America, South America, Europe, FSU and Australia), PM2.5 future premature mortality decreases through 2100 for all RCPs (Figures 5 and 6, Table S7). However, in East Asia, Southeast Asia, India, Africa, and the Middle East, for some scenarios, PM2.5 mortality increases through 2030 or 2050 before decreasing. The changes in future mortality reflect changes in future PM2.5 concentrations relative to 2000 (Figure S3), and a substantial increase in exposed population through the 21st century, particularly in Africa, India and the Middle East (Figure S6). That is, any reduction/increase in mortality due to the decrease/increase in pollutant concentrations was amplified by the increases in exposed population. The decreases in population in Europe, FSU and East Asia have similar effects as those mentioned above for ozone-related mortality. For example, while total avoided mortality in 2100 in East Asia decreases compared to 2050, for RCP2.6, RCP4.5 and RCP8.5, total avoided mortality per million people increases in the same scenarios (Figure S11). East and South Asia are the regions with the greatest projected mortality burdens, and the variability in PM2.5 among models is typically less in these regions than in several other regions globally, depending upon the scenario and year (Figure S9).
Future PM2.5-related mortality estimates are influenced by the nonlinearity of the IER function. For example, in RCP8.5 in 2030, all models project an increase in global population-weighted concentration (Table S3) but all models except one show decreases in global PM2.5-related mortality (Figure 4). This outcome results in part because PM2.5 increases are projected in regions with high concentrations (particularly East Asia) that are on the flatter part of the IER curve, whereas PM2.5 decreases in regions with low concentrations (North America and Europe) have a steeper slope and therefore a greater influence on global mortality.
Considering the results of the MC simulations for RCP8.5, premature mortality changes from −17,200 (−386,000 to 661,000) deaths in 2030 to −1.31 (−2.04 to −0.17) million deaths in 2100 (Figure 4, Table S7). Uncertainty in RR leads to a CV of 11 to 191% for the different models in the three future years. The spread of model results increases overall CV to 1644% (2030), 20% (2050) and 41% (2100). Uncertainty in modeled PM2.5 concentrations in 2000 is the greatest contributor to overall uncertainty (59% in 2030, 45% in 2050, and 49% in 2100), followed by uncertainty in modeled PM2.5 in future years (40% in 2030, 26% in 2050 and 32% in 2100). Uncertainty in RR has a negligible contribution to overall uncertainty in 2030 (<1%), as the multi-model mean mortality change happens to be near zero (one model projects a large increase while the other five models project decreases), but contributes 29% in 2050 and 20% in 2100.
We compared mortality results using our estimates of PM2.5 from the sum of reported species with results using PM2.5 reported by four models applying their own formula to estimate PM2.5 (Figure 7). The multi-model average future avoided mortality for the four models which reported PM2.5 is comparable although lower than the average for our PM2.5 estimates for the same models. Individual models do not show the same differences in mortality using their own vs. our PM2.5 estimates. Also, for two models (GFDL-AM3 and MIROC-CHEM) the two sources of PM2.5 estimates yield mortality changes of different sign in 2030. These results reflect the different aerosol species included by each model to estimate PM2.5 (e.g. nitrate is not included by all models).
3.3 Global burden on mortality of ozone and PM2.5
Here we present estimates of the global burden on mortality of ozone and PM2.5 concentrations in the future, considering the four RCPs relative to preindustrial concentrations (1850) and future exposed population and baseline mortality rates (Figures 8 and 9, Tables S8 and S9). For context, we estimate the present-day global burden, using 2000 concentrations, population from Landscan 2011 Population Dataset, and baseline mortality rates from GBD2010, to be: 382,000 (121,000 to 728,000) ozone deaths/year and 1.70 (1.30 to 2.10) million PM2.5 deaths/year. These estimates are 18.7% lower for ozone-related mortality and 19.1% lower for PM2.5-related mortality than those obtained in our previous study (Silva et al., 2013), reflecting; a) more restrictive mortality outcomes (chronic respiratory diseases rather than all respiratory diseases, and IHD+STROKE+COPD rather than all cardiopulmonary diseases); b) updated population and baseline mortality rates; c) the use of the recent IER model (Burnett et al., 2014) for PM2.5 (instead of Krewski et al., 2009). Compared with the GBD 2013 (Forouzanfar et al. 2015), our estimates are 76% higher for ozone-related mortality and 42% lower for PM2.5-related mortality, likely due to the fact that we estimate the global mortality burden using 1850 concentrations as baseline, while Forouzanfar et al. (2015) consider counterfactual concentrations (theoretical minimum-risk exposure) that are mostly higher for ozone (uniform distribution between 33.3 and 41.9 ppb) and lower for PM2.5 (uniform distribution between 5.9 and 8.7 μg/m3) than 1850 concentrations. In addition, we consider ozone mortality from all chronic respiratory diseases while Forouzanfar et al. (2015) only account for COPD, and we restrict our mortality estimates to adult population while Forouzanfar et al. (2015) include PM2.5 mortality from lower respiratory tract infections in children under 5 years old. As a sensitivity analysis, when we apply a counterfactual of 33.3ppb (instead of using 1850 concentrations), our ozone-related mortality estimates are 23% higher for the multi-model mean, varying between +10% and +52% among models. Similarly, using the IER model counterfactual, our PM2.5-related mortality estimates are 22% lower for the multi-model mean, varying between −8% and −44% among models.
For ozone, the global mortality burden increases in all RCPs through 2050 to between 1.84 and 2.60 million deaths/year, and then it decreases slightly for RCP8.5 and substantially for the other RCPs, ranging between 1.09 and 2.36 million deaths/year in 2100. The increase can be explained by the rise in the baseline mortality rates for chronic respiratory diseases magnified by the increase in exposed population, while the decline is likely mostly related to the decrease in concentrations, slightly countered by further population growth (Figure 8). The global burden of mortality from PM2.5 shows a declining trend for all RCPs from 2030 to 2100, peaking between 2.4 and 2.6 million deaths/year in 2030 then declining to between 0.56 and 1.55 million deaths/year in 2100, except for RCP6.0 which peaks in 2050 (3.50 million deaths/year) before declining considerably. For PM2.5, the increase in exposed population and the decline in concentrations have a much greater effect than changes in baseline mortality rates (Figure 9). These results are similar to those of Apte et al. (2015) who report a stronger effect of projected demographic trends in India and China in 2030 than of changes in baseline mortality rates. Our estimates for the global burden of PM2.5 mortality in 2050 (between 1.82 and 3.50 million deaths/year for the four RCPs) are considerably lower than those of Lelieveld et al. (2015) (5.87 million deaths / year for IHD+STROKE+COPD+LC), likely due to the assumption in the RCP scenarios of further regulations on air pollutants, while the Business-As-Usual scenario of Lelieveld et al. (2015) does not assume regulations beyond those currently defined.
To help explain differences between the trends in future global burden (Figures 8 and 9) and in future mortality relative to 2000 (Figures 1 and 4), we estimate the future global burden for two cases: Case A - using 2000 concentrations relative to 1850 and present-day population but future baseline mortality rates; and Case B – using 2000 concentrations relative to 1850 but future population and baseline mortality rates. Case A reflects the effect of future baseline mortality rates on the global burden, if concentrations in future years were maintained at 2000 levels, while Case B reflects the combined effect of population and baseline mortality rates, i.e. it is identical to Case A except that population changes. The difference between the global burden for each RCP and Case B reflects the effects of changes in future air pollutant concentrations, and nearly equals future mortality relative to 2000 concentrations in Figures 1 and 4. However, Cases A and B are calculated for all 14 models for ozone and 6 models for PM2.5 (since all models reported air pollutant concentrations in 2000), while future mortality relative to 2000 is calculated for the models that report each scenario/year.
4 Discussion
In all RCP scenarios but RCP8.5, stringent air pollution controls lead to substantial decreases in ozone concentrations through the 21st century, relative to 2000. For RCP8.5, the higher baseline GHG (including methane) and air pollutant emissions lead to increases in future ozone concentrations. In contrast, global PM2.5 concentrations show a decreasing trend across all RCP scenarios. These changes in air pollutant concentrations, combined with projected increases in baseline mortality rates for chronic respiratory diseases, drive ozone mortality to become more important relative to PM2.5 mortality over the next century.
The importance of conducting health impact assessments with air pollutant concentrations from model ensembles, instead of from single models, is highlighted by the differences in sign of the change in mortality among models, and by the marked impact of the spread of model results on overall uncertainty in our mortality estimates. In most cases assessed here (ozone mortality in 2030 relative to 2000, PM2.5 mortality in 2030, PM2.5 mortality in 2050 and 2100 relative to 2000), uncertainty in modeled air pollutant concentrations is the greatest contributor to uncertainty in mortality estimates. The differences in air pollutant concentrations reported by the ACCMIP models reflect different treatment of atmospheric dynamics and chemistry, chemistry-climate interactions, and natural emissions in each model (Young et al., 2013). Although there is likely a bias in estimating health effects using air pollutant concentrations from coarse resolution models (Li et al., 2015; Punger and West, 2013), particularly for PM2.5, we do not expect resolution to be an important factor for the differences in simulated concentrations across coarse resolution models. There are several uncertainties and assumptions that affect our results. We applied the same RR worldwide and into the future, despite differences in vulnerability of the exposed population, in composition of PM2.5, and in other factors that may support the use of different risk estimates or different concentration-response relationships. These uncertainties can be addressed through additional long-term epidemiological studies, particularly for large cohorts in developing countries, to improve RR estimates globally. These studies should be representative of wider ranges of exposure and air pollutant mixtures than existing studies in the US and Europe, and they should control for confounding factors such as other environmental exposures, use of air conditioning, socio-economic factors, etc. Also, we estimate mortality for adults aged 25 and older, and do not quantify air pollutant effects on morbidity, so we underestimate the overall impact of changes in pollutant concentrations on human health. Uncertainty is evaluated for a single future population projection, not accounting for the wide range of projections in the literature, and does not reflect uncertainty in baseline mortality rates, as these are not reported; uncertainties in both population and baseline mortality rates would be expected to increase with time into the future. The spread of model results does not account for uncertainty in emissions inventories, as all ACCMIP models used the same projections of anthropogenic emissions. Moreover, climate and air quality interactions and feedbacks are not sufficiently understood to be fully reflected in modeled air pollutant concentrations, and global models simplify atmospheric physics and chemical processes. This is particularly important when modeling air quality given scenarios of future emissions and climate change. For example, most global models do not fully address climate sensitivity to biogenic emissions (e.g. isoprene, soil NOx and methane) and stratosphere-troposphere interactions (e.g. stratospheric influx of ozone). A better understanding of aerosol-cloud interactions, of the impact of climate change on wildfires, and of the impact of land use changes on regional climate and air pollution is also crucial.
Our results are limited by the range of air pollutant emissions projected by the RCPs, which assume that economic growth strengthens efforts to reduce air pollution emissions. All RCPs project reductions in anthropogenic precursor emissions associated with more extensive air quality legislation as incomes rise, except for methane in RCP8.5 and for ammonia in all scenarios. These scenarios together do not encompass the range of plausible air pollution futures for the 21st century, as the RCPs were not designed for this purpose (van Vuuren et al., 2011a). Other plausible scenarios have been considered, such as the Current Legislation Emissions and Maximum Feasible Reductions scenarios used by Likhvar et al. (2015) and the Business-As-Usual scenario of Lelieveld et al (2015). As noted above, our global burden estimates for 2050 are considerably lower than the Business-As-Usual scenario of Lelieveld et al. (2015). If economic growth does not lead to stricter air pollution control, emissions and health effects may rise considerably, particularly for scenarios of high population growth in developing countries (Amman et al., 2013).
5 Conclusions
Under the RCP scenarios, future PM2.5 concentrations lead to decreased global premature mortality versus what would occur with fixed year-2000 concentrations, but ozone-related mortality increases in some scenarios/periods. In 2100, excess ozone-related premature mortality for RCP8.5 is estimated to be 316 thousand (−187 thousand to 1.38 million) deaths/year (likely due to an increase in methane emissions and to the net effect of climate change), while for the three other RCPs avoided ozone mortality is between −718 thousand and −1.02 million deaths/year. For PM2.5, avoided future premature mortality is estimated to be between −1.33 and −2.39 million deaths/year in 2100. These reductions in ambient air pollution-related mortality reflect the decline in pollutant emissions projected in the RCPs, but the large range of results from the four RCPs highlights the importance of future air pollutant emissions for ambient air quality and global health. Mortality estimates differ among models and we find that, for most cases, the contribution to overall uncertainty from uncertainty associated with modeled air pollutant concentrations exceeds that from the RRs. Increases in exposed population and in baseline mortality rates of respiratory diseases magnify the impact on mortality of the changes in air pollutant concentrations.
Estimating future mortality relative to 2000 concentrations allows us to emphasize the effects of changes in air pollution in these results. However, increases in exposed population and in baseline mortality rates may drive an increase in the future burden of air pollution on mortality. Even in the most optimistic scenarios, the global mortality burden of ozone (relative to 1850 concentrations) is estimated to be over 1 million deaths/year in 2100, compared to less than 0.4 million in 2000. For PM2.5, the global burdens in 2030 and 2050 for the four RCPs are greater than the global burden in 2000 but decrease to between 0.56 and 1.55 million deaths/year in 2100, compared to 1.7 million deaths/year in 2000. A strong decline in PM2.5 concentrations for all RCPs together with demographic trends in the 21st century (with a projected substantial increase in exposed population) lead to a rising importance of ozone relative to PM2.5 for the global burden of ambient air pollution-related mortality.
The RCPs are based on the premise that economic development drives better air pollution control, leading to improved air quality. This trend is apparent in some developing countries now (Klimont et al., 2013), but it is yet to be determined how aggressive many developing nations will be in addressing air pollution. The assumed link between economic development and air pollution control in the RCPs requires new and stronger regulations around the world, as well as new control technologies, for the air pollution decreases in the RCPs to be realized. The projected reductions in mortality estimated here will be compromised if more stringent policies are delayed (e.g., Lelieveld et al., 2015).
Supplementary Material
Acknowledgments
The research here described was funded by a fellowship from the Portuguese Foundation for Science and Technology, by a Dissertation Completion Fellowship from The Graduate School (UNC – Chapel Hill), and by NIEHS grant #1 R21 ES022600-01. We thank Karin Yeatts (Department of Epidemiology, UNC – Chapel Hill) for her help in researching projections of future population and baseline mortality rates, Colin Mathers (WHO) for advising us on the IFs, Peter Speyer (IHME, University of Washington) for providing us access to GBD2010 cause-specific mortality data at the country-level, and Amanda Henley (Davis Library Research & Instructional Services, UNC – Chapel Hill) for facilitating our access to Landscan 2011 Global Population Dataset. The work of DB and PC was funded by the U.S. Dept. of Energy (BER), performed under the auspices of LLNL under Contract DE-AC52-07NA27344, and used the supercomputing resources of NERSC under contract No. DE-AC02-05CH11231. Ruth Doherty, Ian MacKenzie and David Stevenson acknowledge ARCHER supercomputing resouces and funding under the UK Natural Environment Research Council grant: NE/I008063/1. GZ acknowledges the NZ eScience Infrastructure which is funded jointly by NeSI’s collaborator institutions and through the MBIE’s Research Infrastructure programme.
References
- Amann M, Klimont Z, Wagner F. Regional and Global Emissions of Air Pollutants: Recent Trends and Future Scenarios. Annu Rev Environ Resour. 2013;38:31–55. doi: 10.1146/annurev-environ-052912-173303. [DOI] [Google Scholar]
- Anenberg SC, West JJ, Fiore AM, Jaffe DA, Prather MJ, Bergmann D, Cuvelier K, Dentener FJ, Duncan BN, Gauss M, Hess P, Jonson JE, Lupu A, MacKenzie IA, Marmer E, Park RJ, Sanderson MG, Schultz M, Shindell DT, Szopa S, Vivanco MG, Wild O, Zeng G. Intercontinental Impacts of Ozone Pollution on Human Mortality. Environ Sci Technol. 2009;43:6482–6487. doi: 10.1021/es900518z. [DOI] [PubMed] [Google Scholar]
- Anenberg SC, Horowitz LW, Tong DQ, West JJ. An estimate of the global burden of anthropogenic ozone and fine particulate matter on premature human mortality using atmospheric modeling. Environ Health Perspect. 2010 Apr;118:1189–1195. doi: 10.1289/ehp.0901220. [DOI] [PMC free article] [PubMed] [Google Scholar]
- Anenberg SC, West JJ, Yu H, Chin M, Schultz M, Bergmann D, Bey I, Bian H, Diehl T, Fiore A, Hess P, Marmer E, Montanaro V, Park R, Shindell D, Takemura T, Dentener F. Impacts of intercontinental transport of anthropogenic fine particulate matter on human mortality. Air Qual Atmos Health. 2014 doi: 10.1007/s11869-014-0248-9. [DOI] [Google Scholar]
- Apte JS, Marshall JD, Cohen AJ, Brauer M. Addressing Global Mortality from Ambient PM2.5. Environ Sci Technol. 2015;49:8057–8066. doi: 10.1021/acs.est.5b01236. [DOI] [PubMed] [Google Scholar]
- Bell ML, Dominici F, Samet JM. A Meta-Analysis of Time-Series Studies of Ozone and Mortality With Comparison to the National Morbidity, Mortality, and Air Pollution Study. Epidemiology. 2005;16(4):436–445. doi: 10.1097/01.ede.0000165817.40152.85. [DOI] [PMC free article] [PubMed] [Google Scholar]
- Bell ML, Goldberg R, Hogrefe C, Kinney PL, Knowlton K, Lynn B, Rosenthal J, Rosenzweig C, Patz JA. Climate change, ambient ozone, and health in 50 US cities. Clim Change. 2007;82(1–2):61–76. doi: 10.1007/s10584-006-9166-7. [DOI] [Google Scholar]
- Bright EA, Coleman PR, Rose AN, Urban ML. LandScan 2011. Oak Ridge National Laboratory; SE, Oak Ridge, TN: 2012. [Google Scholar]
- Brook RD, Rajagopalan S, Pope CA, Brook JR, Bhatnagar A, Diez-Roux AV, Holguin F, Hong Y, Luepker RV, Mittleman MA, Peters A, Siscovick D, Smith SC, Whitsel L, Kaufman JD. Particulate matter air pollution and cardiovascular disease: An update to the scientific statement from the American Heart Association. Circulation. 2010;121(21):2331–2378. doi: 10.1161/CIR.0b013e3181dbece1. [DOI] [PubMed] [Google Scholar]
- Burnett RT, Arden Pope C, Ezzati M, Olives C, Lim SS, Mehta S, Shin HH, Singh G, Hubbell B, Brauer M, Ross Anderson H, Smith KR, Balmes JR, Bruce NG, Kan H, Laden F, Prüss-Ustün A, Turner MC, Gapstur SM, Diver WR, Cohen A. An integrated risk function for estimating the global burden of disease attributable to ambient fine particulate matter exposure. Environ Health Perspect. 2014;122(4):397–403. doi: 10.1289/ehp.1307049. [DOI] [PMC free article] [PubMed] [Google Scholar]
- Chang HH, Zhou J, Fuentes M. Impact of Climate Change on Ambient Ozone Level and Mortality in Southeastern United States. Int J Environ Res Public Health. 2010;7(7):2866–2880. doi: 10.3390/ijerph7072866. [DOI] [PMC free article] [PubMed] [Google Scholar]
- Doherty RM, Wild O, Shindell DT, Zeng G, MacKenzie IA, Collins WJ, Fiore AM, Stevenson DS, Dentener FJ, Schultz MG, Hess P, Derwent RG, Keating TJ. Impacts of climate change on surface ozone and intercontinental ozone pollution: A multi-model study. J Geophys Res Atmos. 2013;118(9):3744–3763. doi: 10.1002/jgrd.50266. [DOI] [Google Scholar]
- Evans J, van Donkelaar A, Martin RV, Burnett R, Rainham DG, Birkett NJ, Krewski D. Estimates of global mortality attributable to particulate air pollution using satellite imagery. Environ Res. 2013;120:33–42. doi: 10.1016/j.envres.2012.08.005. [DOI] [PubMed] [Google Scholar]
- Fang Y, Naik V, Horowitz LW, Mauzerall DL. Air pollution and associated human mortality: The role of air pollutant emissions, climate change and methane concentration increases from the preindustrial period to present. Atmos Chem Phys. 2013a;13:1377–1394. doi: 10.5194/acp-13-1377-2013. [DOI] [Google Scholar]
- Fang Y, Mauzerall DL, Liu J, Fiore AM, Horowitz LW. Impacts of 21st century climate change on global air pollution-related premature mortality. Climatic Change. 2013b doi: 10.1007/s10584-013-0847-8. [DOI] [Google Scholar]
- Fann N, Nolte CG, Dolwick P, Spero TL, Brown AC, Phillips S, Anenberg S. The geographic distribution and economic value of climate change-related ozone health impacts in the United States in 2030. Journal of the Air & Waste Management Association. 2015;65(5):570–580. doi: 10.1080/10962247.2014.996270. [DOI] [PubMed] [Google Scholar]
- Fiore AM, Naik V, Spracklen DV, Steiner A, Unger N, Prather M, Bergmann D, Cameron-Smith PJ, Cionni I, Collins WJ, Dalsøren S, Eyring V, Folberth Ga, Ginoux P, Horowitz LW, Josse B, Lamarque JF, MacKenzie Ia, Nagashima T, O’Connor FM, Righi M, Rumbold ST, Shindell DT, Skeie RB, Sudo K, Szopa S, Takemura T, Zeng G. Global air quality and climate. Chem Soc Rev. 2012;41(19):6663–6683. doi: 10.1039/c2cs35095e. [DOI] [PubMed] [Google Scholar]
- Fiore AM, Naik V, Leibensperger EM. Air Quality and Climate Connections. J Air Waste Manage Assoc. 2015;65(6):645–685. doi: 10.1080/10962247.2015.1040526. [DOI] [PubMed] [Google Scholar]
- Forouzanfar MH, et al. Global, regional, and national comparative risk assessment of 79 behavioural, environmental and occupational, and metabolic risks or clusters of risks in 188 countries, 1990–2013 a systematic analysis for the Global Burden of Disease Study 2013. The Lancet. 2015;386(10010):2287–2323. doi: 10.1016/S0140-6736(15)00128-2. [DOI] [PMC free article] [PubMed] [Google Scholar]
- Fuzzi S, Baltensperger U, Carslaw K, Decesari S, Denier van der Gon H, Facchini MC, Fowler D, Koren I, Langford B, Lohmann U, Nemitz E, Pandis S, Riipinen I, Rudich Y, Schaap M, Slowik JG, Spracklen DV, Vignati E, Wild M, Williams M, Gilardoni S. Particulate matter, air quality and climate: lessons learned and future needs. Atmos Chem Phys. 2015;15:8217–8299. doi: 10.5194/acp-15-8217-2015. [DOI] [Google Scholar]
- Global Health Data Exchange (GHDx) Global Burden of Disease Study 2010 - Ambient Air Pollution Risk Model 1990–2010. 2013 Available: http://ghdx.healthmetricsandevaluation.org/record/global-burden-disease-study-2010-gbd-2010-ambient-air-pollution-risk-model-1990–2010 [accessed 8 November 2013]
- Gryparis A, Forsberg B, Katsouyanni K, Analitis A, Touloumi G, Schwartz J, Samoli E, Medina S, Anderson HR, Niciu EM, Wichmann HE, Kriz B, Kosnik M, Skorkovsky J, Vonk JM, Dörtbudak Z. Acute effects of ozone on mortality from the Air Pollution and Health: A European Approach project. Am J Respir Crit Care Med. 2004;170(30):1080–1087. doi: 10.1164/rccm.200403-333OC. [DOI] [PubMed] [Google Scholar]
- Hamra GB, Guha N, Cohen A, Laden F, Raaschou-Nielsen O, Samet JM, Vineis P, Forastiere F, Saldiva P, Yorifuji T, Loomis D. Environ Health Perspect. Jan, 2014. Outdoor Particulate Matter Exposure and Lung Cancer: A Systematic Review and Meta-Analysis. [DOI] [PMC free article] [PubMed] [Google Scholar]
- Heal M, Doherty R, Heaviside C, Vieno M, Stevenson D, Vardoulakis S. Health Effects due to Changes in Air Pollution under Future Scenarios, Health effects of climate change in the UK 2012, Chapter 3. 2012:55–82. [Google Scholar]
- Hughes BB, Kuhn R, Peterson CM, Rothman DS, Solórzano JR, Mathers CD, Dickson JR. Projections De Résultats En Matière De Santé Mondiale De 2005 À 2060 En Utilisant Le Modèle Prévisionnel Intégré International Futures. Bull World Health Organ. 2011;89(7):478–486. doi: 10.2471/BLT.10.083766. [DOI] [PMC free article] [PubMed] [Google Scholar]
- Jackson JE, Yost MG, Karr C, Fitzpatrick C, Lamb BK, Chung SH, Chen J, Avise J, Rosenblatt RA, Fenske RA. Public health impacts of climate change in Washington State: projected mortality risks due to heat :159–186. 2010 doi: 10.1007/s10584-010-9852-3. [DOI] [Google Scholar]
- Jacob DJ, Winner DA. Effect of climate change on air quality. Atmos Environ. 2009;43(1):51–63. doi: 10.1016/j.atmosenv.2008.09.051. [DOI] [Google Scholar]
- Jerrett M, Burnett RT, Pope CA, Ito K, Thurston G, Krewski D, Shi Y, Calle E, Thun M. Long-Term Ozone Exposure and Mortality. N Engl J Med. 2009;360(11):1085–1095. doi: 10.1056/NEJMoa0803894. [DOI] [PMC free article] [PubMed] [Google Scholar]
- Kirtman B, Power SB, Adedoyin JA, Boer GJ, Bojariu R, Camilloni I, Doblas-Reyes FJ, Fiore AM, Kimoto M, Meehl GA, Prather M, Sarr A, Schär C, Sutton R, van Oldenborgh GJ, Vecchi G, Wang HJ. Near-term Climate Change: Projections and Predictability. In: Stocker TF, Qin D, Plattner G-K, Tignor M, Allen SK, Boschung J, Nauels A, Xia Y, Bex V, Midgley PM, editors. Climate Change 2013: The Physical Science Basis (Chapter 11). Contribution of Working Group I to the Fifth Assessment Report of the Intergovernmental Panel on Climate Change. Cambridge University Press; Cambridge, United Kingdom and New York, NY, USA: 2013. [Google Scholar]
- Klimont Z, Smith SJ, Cofala J. The last decade of global anthropogenic sulfur dioxide: 2000–2011 emissions. Environ Res Lett. 2013;8(1):014003. doi: 10.1088/1748-9326/8/1/014003. [DOI] [Google Scholar]
- Knowlton K, Rosenthal JE, Hogrefe C, Lynn B, Gaffin S, Goldberg R, Rosenzweig C, Civerolo K, Ku JY, Kinney PL. Assessing ozone-related health impacts under a changing climate. Environ Health Perspect. 2004;112(15):1557–1563. doi: 10.1289/ehp.7163. [DOI] [PMC free article] [PubMed] [Google Scholar]
- Knowlton K, Hogrefe C, Lynn B, Rosenzweig C, Rosenthal J, Kinney PL. Impacts of heat and ozone on mortality risk in the New York City metropolitan region under a changing climate. Advances in Global Change Research. 2008;30:143–160. [Google Scholar]
- Krewski D, Jerrett M, Burnett RT, Ma R, Hughes E, Shi Y, Turner MC, Pope CA, III, Thurston G, Calle EE, Thun MJ. Extended Follow-Up and Spatial Analysis of the American Cancer Society Study Linking Particulate Air Pollution and Mortality. Respir Rep Heal Eff Inst. 2009;140(140):5–114. [PubMed] [Google Scholar]
- Lamarque JF, Shindell DT, Josse B, Young PJ, Cionni I, Eyring V, Bergmann D, Cameron-Smith P, Collins WJ, Doherty R, Dalsoren S, Faluvegi G, Folberth G, Ghan SJ, Horowitz LW, Lee YH, MacKenzie IA, Nagashima T, Naik V, Plummer D, Righi M, Rumbold ST, Schulz M, Skeie RB, Stevenson DS, Strode S, Sudo K, Szopa S, Voulgarakis A, Zeng G. The atmospheric chemistry and climate model intercomparison Project (ACCMIP): Overview and description of models, simulations and climate diagnostics. Geosci Model Dev. 2013;6(1):179–206. doi: 10.5194/gmd-6-179-2013. [DOI] [Google Scholar]
- Lelieveld J, Barlas C, Giannadaki D, Pozzer A. Model calculated global, regional and megacity premature mortality due to air pollution. Atmos Chem Phys. 2013;13(14):7023–7037. doi: 10.5194/acp-13-7023-2013. [DOI] [Google Scholar]
- Lelieveld J, Evans JS, Fnais M, Giannadaki D, Pozzer a. The contribution of outdoor air pollution sources to premature mortality on a global scale. Nature. 2015;525(7569):367–371. doi: 10.1038/nature15371. [DOI] [PubMed] [Google Scholar]
- Lepeule J, Laden F, Dockery D, Schwartz J. Chronic exposure to fine particles and mortality: An extended follow-up of the Harvard six cities study from 1974 to 2009. Environ Health Perspect. 2012;120(7):965–970. doi: 10.1289/ehp.1104660. [DOI] [PMC free article] [PubMed] [Google Scholar]
- Levy JI, Chemerynski SM, Sarnat JA. Ozone exposure and mortality: an empiric bayes metaregression analysis. Epidemiology. 2005;16(4):458–468. doi: 10.1097/01.ede.0000165820.08301.b3. [DOI] [PubMed] [Google Scholar]
- Likhvar VN, Pascal M, Markakis K, Colette A, Hauglustaine D, Valari M, Klimont Z, Medina S, Kinney P. A multi-scale health impact assessment of air pollution over the 21st century. Sci Total Environ. 2015;514:439–449. doi: 10.1016/j.scitotenv.2015.02.002. [DOI] [PubMed] [Google Scholar]
- Lozano Rafael, et al. Global and regional mortality from 235 causes of death for 20 age groups in 1990 and 2010: a systematic analysis for the Global Burden of Disease Study 2010. The Lancet. 2012;380(9859):2095–2128. doi: 10.1016/S0140-6736(12)61728-0. [DOI] [PMC free article] [PubMed] [Google Scholar]
- Masui T, Matsumoto K, Hijioka Y, Kinoshita T, Nozawa T, Ishiwatari S, Kato E, Shukla PR, Yamagata Y, Kainuma M. An emission pathway for stabilization at 6 Wm-2 radiative forcing. Clim Change. 2011;109(1):59–76. doi: 10.1007/s10584-011-0150-5. [DOI] [Google Scholar]
- Orru H, Andersson C, Ebi KL, Langner J, Åström C, Forsberg B. Impact of climate change on ozone-related mortality and morbidity in Europe. Eur Respir J. 2013;41(2):285–294. doi: 10.1183/09031936.00210411. [DOI] [PubMed] [Google Scholar]
- Pattenden S, Armstrong B, Milojevic A, Barratt B, Chalabi Z, Doherty RM, Heal MR, Kovats S, Wilkinson P. Ozone, heat and mortality in fifteen British conurbations. Occup Environ Med. 2010;67:699–707. doi: 10.1136/oem.2009.051714. [DOI] [PubMed] [Google Scholar]
- Post ES, Grambsch A, Weaver C, Morefield P, Huang J, Leung LY, Nolte CG, Adams P, Liang XZ, Zhu JH, Mahoney H. Variation in estimated ozone-related health impacts of climate change due to modeling choices and assumptions. Environ Health Perspect. 2012;120(11):1559–1564. doi: 10.1289/ehp.1104271. [DOI] [PMC free article] [PubMed] [Google Scholar]
- Rao S, Chirkov V, Dentener F, Dingenen R, Pachauri S, Purohit P, Amann M, Heyes C, Kinney P, Kolp P, Klimont Z, Riahi K, Schoepp W. Environmental Modeling and Methods for Estimation of the Global Health Impacts of Air Pollution. Environ Model Assess. 2012:613–622. doi: 10.1007/s10666-012-9317-3. [DOI] [Google Scholar]
- Riahi K, Rao S, Krey V, Cho C, Chirkov V, Fischer G, Kindermann G, Nakicenovic N, Rafaj P. RCP 8.5-A scenario of comparatively high greenhouse gas emissions. Clim Change. 2011;109(1):33–57. doi: 10.1007/s10584-011-0149-y. [DOI] [Google Scholar]
- Roberts S. Interactions between particulate air pollution and temperature in air pollution mortality time series studies. Environ Res. 2004;96(3):328–337. doi: 10.1016/j.envres.2004.01.015. [DOI] [PubMed] [Google Scholar]
- von Schneidemesser E, Monks PS, Allan JD, Bruhwiler L, Forster P, Fowler D, Lauer A, Morgan WT, Paasonen P, Righi M, Sindelarova K, Sutton MA. Chemistry and the Linkages between Air Quality and Climate Change. Chem Rev. 2015;1:150430065937004. doi: 10.1021/acs.chemrev.5b00089. [DOI] [PubMed] [Google Scholar]
- Selin NE, Wu S, Nam KM, Reilly JM, Paltsev S, Prinn RG, Webster MD. Global health and economic impacts of future ozone pollution. Environ Res Lett. 2009;4(4):044014. doi: 10.1088/1748-9326/4/4/044014. [DOI] [Google Scholar]
- Sheffield PE, Knowlton K, Carr JL, Kinney PL. Modeling of Regional Climate Change Effects on Ground-Level Ozone and Childhood Asthma. Am J Prev Med. 2011;41(3):251–257. doi: 10.1016/j.amepre.2011.04.017.. [DOI] [PMC free article] [PubMed] [Google Scholar]
- Shindell DT, Lamarque JF, Schulz M, Flanner M, Jiao C, Chin M, Young PJ, Lee YH, Rotstayn L, Mahowald N, Milly G, Faluvegi G, Balkanski Y, Collins WJ, Conley aJ, Dalsoren S, Easter R, Ghan S, Horowitz L, Liu X, Myhre G, Nagashima T, Naik V, Rumbold ST, Skeie R, Sudo K, Szopa S, Takemura T, Voulgarakis a, Yoon JH, Lo F. Radiative forcing in the ACCMIP historical and future climate simulations. Atmos Chem Phys. 2013;13(6):2939–2974. doi: 10.5194/acp-13-2939-2013. [DOI] [Google Scholar]
- Silva RA, West JJ, Zhang Y, Anenberg SC, Lamarque JF, Shindell DT, Collins WJ, Dalsoren S, Faluvegi G, Folberth G, Horowitz LW, Nagashima T, Naik V, Rumbold S, Skeie R, Sudo K, Takemura T, Bergmann D, Cameron-Smith P, Cionni I, Doherty RM, Eyring V, Josse B, MacKenzie IA, Plummer D, Righi M, Stevenson DS, Strode S, Szopa S, Zeng G. Global premature mortality due to anthropogenic outdoor air pollution and the contribution of past climate change. Environ Res Lett. 2013;8:034005. doi: 10.1088/1748-9326/8/3/034005. [DOI] [Google Scholar]
- Smith SJ, West JJ, Kyle P. Economically consistent long-term scenarios for air pollutant and greenhouse gas emissions. Clim Change. 2011;108:619–627. [Google Scholar]
- Stevenson DS, Young PJ, Naik V, Lamarque JF, Shindell DT, Voulgarakis A, Skeie RB, Dalsoren SB, Myhre G, Berntsen TK, Folberth GA, Rumbold ST, Collins WJ, MacKenzie IA, Doherty RM, Zeng G, Van Noije TPC, Strunk A, Bergmann D, Cameron-Smith P, Plummer DA, Strode SA, Horowitz L, Lee YH, Szopa S, Sudo K, Nagashima T, Josse B, Cionni I, Righi M, Eyring V, Conley A, Bowman KW, Wild O, Archibald A. Tropospheric ozone changes, radiative forcing and attribution to emissions in the Atmospheric Chemistry and Climate Model Intercomparison Project (ACCMIP) Atmos Chem Phys. 2012 Oct;13:3063–3085. doi: 10.5194/acp-13-3063-2013. 2013. [DOI] [Google Scholar]
- Tagaris E, Liao KJ, Delucia AJ, Deck L, Amar P, Russell AG. Potential impact of climate change on air pollution-related human health effects. Environ Sci Technol. 2009;43(13):4979–4988. doi: 10.1021/es803650w. [DOI] [PubMed] [Google Scholar]
- Thomson AM, Calvin KV, Smith SJ, Kyle GP, Volke A, Patel P, Delgado-Arias S, Bond-Lamberty B, Wise MA, Clarke LE, Edmonds JA. RCP4.5: A pathway for stabilization of radiative forcing by 2100. Clim Change. 2011;109(1):77–94. doi: 10.1007/s10584-011-0151-4. [DOI] [Google Scholar]
- Van Vuuren DP, Edmonds J, Kainuma M, Riahi K, Thomson A, Hibbard K, Hurtt GC, Kram T, Krey V, Lamarque JF, Masui T, Meinshausen M, Nakicenovic N, Smith SJ, Rose SK. The representative concentration pathways: An overview. Clim Change. 2011a;109:5–31. doi: 10.1007/s10584-011-0148-z. [DOI] [Google Scholar]
- Van Vuuren DP, Stehfest E, den Elzen MGJ, Kram T, van Vliet J, Deetman S, Isaac M, Goldewijk KK, Hof A, Beltran AM, Oostenrijk R, van Ruijven B. RCP2.6: Exploring the possibility to keep global mean temperature increase below 2°C. Clim Change. 2011b;109(1):95–116. doi: 10.1007/s10584-011-0152-3. [DOI] [Google Scholar]
- Weaver CP, Liang XZ, Zhu J, Adams PJ, Amar P, Avise J, Caughey M, Chen J, Cohen RC, Cooter E, Dawson JP, Gilliam R, Gilliland A, Goldstein AH, Grambsch A, Grano D, Guenther A, Gustafson WI, Harley RA, He S, Hemming B, Hogrefe C, Huang HC, Hunt SW, Jacob DJ, Kinney PL, Kunkel K, Lamarque JF, Lamb B, Larkin NK, Leung LR, Liao KJ, Lin JT, Lynn BH, Manomaiphiboon K, Mass C, Mckenzie D, Mickley LJ, O’Neill SM, Nolte C, Pandis SN, Racherla PN, Rosenzweig C, Russell AG, Salathé E, Steiner AL, Tagaris E, Tao Z, Tonse S, Wiedinmyer C, Williams A, Winner DA, Woo JH, Wu S, Wuebbles DJ. A preliminary synthesis of modeled climate change impacts on U.S. regional ozone concentrations. Bull Am Meteorol Soc. 2009;90(12):1843–1863. doi: 10.1175/2009BAMS2568.1. [DOI] [Google Scholar]
- West JJ, Szopa S, Hauglustaine DA. Human mortality effects of future concentrations of tropospheric ozone. C R Geosci. 2007;339:775–83. [Google Scholar]
- West JJ, Smith SJ, Silva RA, Naik V, Zhang Y, Adelman Z, Fry MM, Anenberg S, Horowitz LW, Lamarque JF. Co-benefits of global greenhouse gas mitigation for future air quality and human health. Nat Clim Chang. 2013;3(10):885–889. doi: 10.1038/NCLIMATE2009. [DOI] [PMC free article] [PubMed] [Google Scholar]
- Wilson A, Rappold AG, Neas LM, Reich BJ. Modeling the effect of temperature on ozone-related mortality. Ann Appl Stat. 2014;8(3):1728–1749. doi: 10.1214/14-AOAS754. [DOI] [Google Scholar]
- Young PJ, Archibald AT, Bowman KW, Lamarque JF, Naik V, Stevenson DS, Tilmes S, Voulgarakis A, Wild O, Bergmann D, Cameron-Smith P, Cionni I, Collins WJ, Dalsøren SB, Doherty RM, Eyring V, Faluvegi G, Horowitz LW, Josse B, Lee YH, MacKenzie IA, Nagashima T, Plummer DA, Righi M, Rumbold ST, Skeie RB, Shindell DT, Strode SA, Sudo K, Szopa S, Zeng G. Pre-industrial to end 21st century projections of tropospheric ozone from the Atmospheric Chemistry and Climate Model Intercomparison Project (ACCMIP) Atmos Chem Phys. 2013;13(10):2063–2090. doi: 10.5194/acp-13-2063-2013. [DOI] [Google Scholar]
Associated Data
This section collects any data citations, data availability statements, or supplementary materials included in this article.