

Abstract
Osteocalcin (OC) and osteopontin (OPN) are major non-collagenous proteins (NCPs) involved in bone matrix organization and deposition. In spite of this, it is currently unknown whether OC and OPN alter bone morphology and consequently affect bone fracture resistance. The goal of this study is to establish the role of OC and OPN in the determination of cortical bone size, shape, and mechanical properties. Our results show that Oc−/− and Opn−/− mice were no different from each other or wild type (WT) with respect to bone morphology (P > 0.1). Bones from mice lacking both NCPs (Oc−/− Opn−/−) were shorter with thicker cortices and larger cortical areas compared to the WT, Oc−/−, and Opn−/− groups (P < 0.05), suggesting a synergistic role for NCPs in the determination of bone morphology. Maximum bending load was significantly different among the groups (P = 0.024), while tissue mineral density (TMD) or measures of stiffness and strength were not different (P > 0.1). We conclude that the removal of both OC and OPN from bone matrix induces morphological adaptation at the structural level to maintain bone strength.
Keywords: bone morphology, osteocalcin, osteopontin, skeletal adaptation, bone strength
Introduction
An increase in fracture risk is generally attributed to a reduced load-bearing capacity of bones.1,2 Bone apposition and resorption influence bone quantity and consequently morphology (traits specifying size and shape). It has been shown that slender bones (narrow relative to length) contain a greater amount of interstitial bone tissue compared with robust bones.3 However, a large interstitial bone area will cause the bone to be more susceptible to damage accumulation and to have lower flexibility and reduced material level toughness.4 Therefore, functional adaptation, the interaction between bone morphology and bone tissue quality (traits specifying tissue-level material properties) exist to reduce catastrophic failure. Functional adaptation is successful when variation in one trait is compensated by changes in other traits.5
The interaction between bone morphology and tissue quality is influenced by biological processes, such as modeling and remodeling. Thus, the mechanical function of bone can be achieved by acquiring a different combination of structural traits. However, identifying traits that are functionally related and determining how they define whole-bone stiffness and strength is complex and challenging. Genetically engineered mouse models offer an opportunity to see the variation of traits in bone when genes encoding for key proteins involved in bone development and homeostasis are removed.6
Non-collagenous proteins (NCPs) are integral components of bone extracellular matrix (ECM) and exhibit multifunctional roles. While several NCPs act as structural elements of the ECM,7 their contribution to the determination of bone morphology and strength remains largely unknown. Osteocalcin (OC) and osteopontin (OPN) are major NCPs8 that play key roles in both the biological and mechanical functions of bone. OC and OPN are produced during bone formation, late in the mineralization process, and they control––directly and/or indirectly–one mass, mineral size, and orientation.9–11 They are also involved in organizing the ECM, coordinating cell–matrix and mineral–matrix interactions. Both proteins also play structural roles in bone and determine bone’s propensity to fracture.12 Consequently, these proteins may regulate whole-bone structure and morphology, affecting bone mechanical properties.
The objective of this study is to establish whether OC and OPN play a role in the determination of bone size, shape, and strength. The ability of these proteins to act as structural molecules at the nanoscale (due to their involvement in bone matrix organization) may be translated to the macroscale (affecting bone morphology). This work will improve our current understanding of the contribution of NCPs to bone mechanical properties.
Methods
Specimen preparation
Forty-eight 6-month-old male Oc−/− Opn−/−, Oc−/− Opn−/−, and C57BL/6J wild-type littermates (WT) mice were used in this study. Animals were fed a normal standard diet and maintained in accordance with Yale animal care guidelines. Fresh frozen forearms were randomly harvested from each animal (n = 12 animals per group), and all soft tissue was removed. The radii were then separated from the respective ulnae and rinsed with 10× phosphate-buffered saline (PBS) and stored in saline-soaked gauze at −20 °C until testing.
Bone geometry
All radii were kept in Eppendorf tubes with saline during scanning. Images were acquired by microcomputed tomography (μCT) at 70 kVp, 114 mA, and 200 ms integration time and at a high-resolution 10.5 μm voxel size (vivaCT 40, Scanco Medical AG, Bassersdorf, Switzerland).13 Size and shape of cortical bone were determined by a mid-diaphysis evaluation script, which requires a defined volume of interest (VOI). The VOI for each radius consisted of approximately 40 slices (0.40 mm) of the mid-shaft (beginning at 50% of the bone length, extending 400 μm distally).13,14 The parameters measured were cortical thickness (Ct.Th, mm), cortical area (Ct.Ar, mm2), marrow area (Ma.Ar, mm2), moment of inertia (Imax and Imin, mm4), and tissue mineral density (TMD, mgHA/cm3). TMD was derived from mean gray values of bone within the VOI using hydroxyapatite calibration constants. Gaussian filtration (σ = 0.8, support = 1) was applied to the slices and the segmented cortical bone using a global threshold of 656 mgHA/cm3. Total bone length (Le, mm) was calculated by determining the number of slices of bone per specimen and the thickness of each slice. Slenderness (Tt.Ar/le, mm) defined as the ratio of the total cross-sectional area (cortical and marrow area of VOI) and the total length of each radius, was also calculated.
Mechanical testing
The radii were loaded until fracture in 3-point bending at a displacement-controlled loading rate of 0.001 mm/s (Elf 3200; Enduratec). The distance between the lower supports was 8 mm. The resulting load-displacement curve was used to calculate the structural properties: stiffness (S; N/mm), yield force (FY; N), and ultimate force (FU; N). The yield point was calculated using the 5% secant construction15 and the ultimate bending strength (σU; MPa) of each sample calculated by engineering formulae.16
Statistical analysis
Bone traits for each group were adjusted for body size using the linear regression method described by Jepsen et al.17 This takes into account the unique relationship between each trait and body mass. Subsequently, Kruskal-Wallis one-way analysis of variance on ranks was used to determine differences between the groups for the non-normally distributed data followed by Mann-Whitney rank sum tests. Multiple linear regression analysis was used to determine the dependence of mechanical properties on morphological and compositional traits. To identify relationships among morphological traits and whole-bone properties, a correlation matrix was established. Spearman’s ρ correlation coefficients were determined for all combinations of morphological traits and mechanical properties. The analyses were carried out using SPSS 21 (IBM SPSS Statistics) with significance level at P < 0.05.
Results
Kruskal-Wallis analysis revealed that Oc−/− Opn−/− bones were more robust (larger total cross-sectional area relative to total length) than those of all three groups (P < 0.01) (Table 1). Additional pairwise comparison test showed that Oc−/− Opn−/− mice had a significantly larger cortical area and minimum bending moment of inertia than WTs. There were no differences between Oc−/− and Opn−/− mice or between Oc−/− Opn−/− and WTs in any other traits (Table 1). The maximum bending load was different between the groups (P = 0.024), with the mutant mice withstanding higher loads than the WTs. A trend of increasing yield load among the mutant mice was also observed (P = 0.055). The multiple-comparisons test confirmed that the yield load was significantly different between WT and Oc−/− mice (P = 0.013), and between WT and Oc−/− Opn−/− mice (P = 0.010). There were no differences in stiffness or ultimate strength among the groups (Fig. 1).
Table 1.
Summary of variables measured from the mid-shaft of each radius after adjustment of body weight.
| Le (mm) | Ct.Th (mm) | Ct.Ar (mm2) | Tt.Ar (mm2) | Ma.Ar (mm2) | Tt.Ar/Le (mm) | Imax (mm4) | Imin (mm4) | TMD (mgHA/ccm) | |
|---|---|---|---|---|---|---|---|---|---|
| WT | 10.563 ± 1.54 | 0.155 ± 0.01 | 0.242 ± 0.02 | 0.343 ± 0.04 | 0.101 ±0.02 | 0.0326 ± 0.003 | 0.0093 ± 0.002 | 0.0067 ± 0.001 | 1195.11 ± 46.38 |
| Oc−/− | 10.417 ± 0.23 | 0.156 ± 0.01 | 0.251 ± 0.02 | 0.354 ± 0.02 | 0.102 ± 0.01 | 0.0342 ± 0.002b | 0.0097 ± 0.001 | 0.0072 ± 0.001 | 1194.96 ± 44.80 |
| Opn−/− | 10.414 ± 0.25 | 0.150 ± 0.01 | 0.243 ± 0.02 | 0.348 ± 0.03 | 0.105 ± 0.01 | 0.0334 ± 0.003c | 0.0091 ± 0.003 | 0.0067 ± 0.001 | 1181.87 ± 31.48 |
| Oc−/−Opn−/− | 10.191 ± 0.31 | 0.156 ± 0.01 | 0.258 ± 0.02a | 0.371 ± 0.03 | 0.113 ± 0.02 | 0.0366 ± 0.003a | 0.0104 ± 0.001 | 0.0077 ± 0.001a | 1191.71 ± 45.32 |
Difference between wild type and Oc−/− Opn−/− groups.
Difference between Oc−/− Opn−/− and Oc−/− groups.
Difference between Oc−/− Opn−/− and Opn−/− groups.
Figure 1.
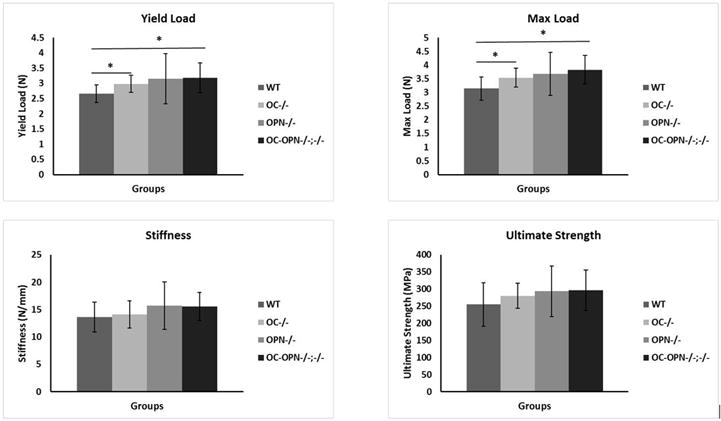
Summary of mechanical properties among the four groups. * indicates significance at P < 0.05.
Correlations were observed between morphological traits and tissue composition (Table 2). Cortical thickness increased linearly with cortical area, slenderness, and TMD (P < 0.01). A negative correlation between length, cortical area, and cortical thickness was only observed for Oc−/− Opn−/− mice, indicating that these shorter bones are thicker, with larger cross-sectional size and higher tissue mineral density. Several morphological traits (i.e., cortical area, slenderness, Imin) correlated positively with stiffness, while cortical area and TMD correlated negatively with ultimate strength (σU). There were no significant correlations between other structural properties (yield load or ultimate) and bone morphology and TMD.
Table 2.
Combined Spearman ρcorrelation matrix of morphological traits and mechanical properties for all samples.
| Length | Ct.Ar | Ct.Th | TMD | Tt.Ar | Tt.Ar/Le | Ma.Ar | Yield.Load | Max.Load | Stiffness | UltStrength | Imax | Imin | |
|---|---|---|---|---|---|---|---|---|---|---|---|---|---|
| Length | 1.000 | –0.128 | –.0276 | –0.252 | 0.001 | –0.171 | 0.061 | –0.018 | –0.028 | –0.137 | –0.019 | –0.005 | 0.061 |
| Ct.Ar | 1.000 | 0.736** | 0.389** | 0.868** | 0.896** | 0.551** | 0.203 | 0.160 | 0.305* | –0.34* | 0.639** | 0.844** | |
| Ct.Th | 1.000 | 0.610** | 0.434** | 0.556** | 0.075 | 0.169 | 0.125 | 0.186 | –0.189 | 0.268 | 0.398** | ||
| TMD | 1.000 | 0.181 | 0.297* | 0.004 | –0.079 | –0.180 | 0.117 | –0.367* | 0.057 | 0.140 | |||
| Tt.Ar | 1.000 | 0.942** | 0.867** | 0.164 | 0.139 | 0.371** | –0.273 | 0.659** | 0.933** | ||||
| Tt.Ar/Le | 1.000 | 0.749** | 0.155 | 0.157 | 0.357* | –0.271 | 0.643** | 0.867** | |||||
| Ma.Ar | 1.000 | 0.168 | 0.127 | 0.452** | –0.096 | 0.498** | 0.787** | ||||||
| Yield.Load | 1.000 | 0.864** | 0.659** | 0.545** | 0.026 | 0.297* | |||||||
| Max.Load | 1.000 | 0.581** | 0.701** | 0.018 | 0.258 | ||||||||
| Stiffness | 1.000 | 0.349* | 0.172 | 0.395** | |||||||||
| UltStrength | 1.000 | –0.260 | –0.223 | ||||||||||
| Imax | 1.000 | 0.593** | |||||||||||
| Imin | 1.000 |
Note:
correlation is significant at the 0.05 level;
significant at the 0.01 level.
Multiple linear regression analysis was conducted to determine the dependence of bone mechanical properties on bone morphology and tissue quality. There was an overall dependency of tissue mineral density on strength (P = 0.004); however, tissue mineral density, cortical thickness, and slenderness were the only strong predictors of ultimate strength for the WT and Oc−/− Opn−/− groups (Table 3). These traits also predicted ultimate load significantly for Oc−/− Opn−/− mice. There were no combination of morphological traits and TMD that predicted mechanical properties for the other groups.
Table 3.
Multiple linear regression analysis of ultimate bending strength (Ult. strength) prediction for each genotype.
| Equation | R2 |
|---|---|
| Ult. strength WT = 1276.25 − 810.70 Ct.Th − 0.52 TMD − 8239.72 slenderness | 0.63 |
| Ult. strength Opn−/− = 846.95 + 7711.25 Ct.Th − 0.757 TMD − 33742.68 Ct.Ar | 0.46 |
| Ult. strength Oc−/− = 918.13 − 2363.82 Ct.Th − 0.459 TMD − 13427.07 slenderness | 0.40 |
| Ult. strength Oc−/− Opn−/− = 14.89 + 71.51 Ct.Th − 0.015 TMD − 118.54 slenderness | 0.72 |
Discussion
Bone fracture, a major consequence of skeletal fragility, occurs if an applied load exceed its structural strength.22 Whole-bone strength is determined by bone mass, geometry, and tissue material properties.23 Therefore, both quality and quantity contribute to bone fracture resistance. The goal of this study was to determine whether OC and OPN affect bone morphology and whole-bone strength. This is one of the first studies to compare changes in bone morphology and mechanical properties in the absence of both OC and OPN.
The geometry of bone, such as cortical thickness and external diameters (which incorporates cortical area), plays a major role in determining bone strength.24–26 In this study, Oc−/− and Opn−/− mice adjusted their cortical area and marrow area together such that the absence of either protein resulted in a phenotype that was similar to WT. There were no morphological differences between Oc−/− and Opn−/− mice and between Oc−/−, Opn−/−, and WT littermates. The loss of both proteins, however, in Oc−/− Opn−/− mice resulted in significant changes in morphology, primarily in cortical area and length. In this regard, OC and OPN play synergistic roles in determining bone size and shape. The increase in the cortical area of Oc−/−Opn−/− bones may be attributed to the observed increase in outer diameter, since there was no change in the inner diameter compared with the other groups.
An increase in cortical area without an accompanying increase in the inner diameter of bone is usually attributed to inhibition of resorption at the endosteal surface with enhanced bone formation at the periosteal surface.27,28 Mice lacking OPN have been shown to develop normally, and Opn−/− bone marrow cells produced a two to four-fold increase in osteoclasts relative to WT cells.29 Ducy et al. demonstrated that Oc−/− mice had increased bone formation but no impairment of bone resorption through mechanisms that have not yet been fully elucidated.30 Therefore, the net effect on bone formation and resorption due to the activity of these proteins may explain the similarity of the inner diameters among the groups. Oc−/− mice were previously reported with a significant increase in bone thickness and mineral density compared with WT littermates.30 Here, we observed that the absence of OC in the Oc−/− (and Oc−/− Opn−/−) mice resulted in a similar trend, but no statistical differences were found between the four groups. In the Opn−/− group, our data is consistent with Thurner et al., who found no differences in bone density and cortical thickness between Opn−/− and WT mice.31
The impact of bone morphology on mechanical properties varied among the groups. Lack of OC in Oc−/− (and Oc−/− Opn−/−) mice showed a significant increase in maximum load. This was also previously observed for Oc−/− mice by Ducy et al. Duvall et al. showed a significant reduction in maximum load for Opn−/−, while our results revealed higher loads.32 The discrepancy seen by Duvall et al. could be attributed to the difference in bone size and matrix maturity of the animals (10 weeks vs. 6 months in our study). In our study, the interactions between bone morphological traits in the mutants resulted in similar values for stiffness and ultimate strength such that there was no difference among the four groups.
It is noteworthy that OC and OPN affect bone material properties.10–12,35,36 In the absence of one or both proteins, Poundarik et al. demonstrated a loss of bone toughness and a co-localization of these proteins with microdamage accumulation.12 In this study, bone material properties were not assessed. Here, the goal was to determine the effect of OC and OPN on bone size and strength, which was not previously reported. As such, our investigation provides insight into the roles of OC and OPN at both the material and whole-bone levels. Our results show that, in the absence of both OC and OPN, bone geometry is altered to achieve similar strength as WTs despite poor material quality.
In conclusion, here we show that together osteocalcin and osteopontin play important roles in determining bone size, shape, and strength. Morphological adaptation of mice lacking both OC and OPN can be attributed to three underlying bone traits: cortical thickness, slenderness, and tissue mineral density. These trait combinations are also predictors of whole-bone mechanical properties (stiffness and strength) for Oc−/− Opn−/− mice and therefore contribute to functional adaption. While there are inherent differences in microstructure and turnover between mouse and human bones, this approach allows us to identify the contribution of morphological traits on mechanical properties using genetically engineered mouse models.
Acknowledgments
This work was supported by the National Institutes of Health/National Institute of Arthritis and Musculoskeletal and Skin Diseases [Grant Numbers AR49635 and AR38460].
Footnotes
Competing interests
The authors report no biomedical financial interests or potential competing interests.
References
- 1.Milgrom C, Giladi M, Simkin A, Rand N, Kedem R, Kashtan H, et al. The area moment of inertia of the tibia: a risk factor for stress fractures. J Biomech. 1989 Jan;22(11–12):1243–8. doi: 10.1016/0021-9290(89)90226-1. [DOI] [PubMed] [Google Scholar]
- 2.Beck T, Ruff CB, Mourtada F, Shaffer R, Maxwell-Williams K, Kao G, et al. Dual-energy X-ray absorptiometry derived structural geometry for stress fracture prediction in male U.S. Marine Corps recruits. J Bone Miner Res. 1996 May;11(5):645–53. doi: 10.1002/jbmr.5650110512. [DOI] [PubMed] [Google Scholar]
- 3.Ural A, Vashishth D. Interactions between Microstructural and Geometrical Adaptation in Human Cortical Bone. J Orthop Res. 2006 Jul;24(7):1489–98. doi: 10.1002/jor.20159. [DOI] [PubMed] [Google Scholar]
- 4.Seeman E. Bone quality: the material and structural basis of bone strength. J Bone Miner Metab. 2008 Jan;26(1):1–8. doi: 10.1007/s00774-007-0793-5. [DOI] [PubMed] [Google Scholar]
- 5.Jepsen KJ. Functional interactions among morphologic and tissue quality traits define bone quality. Clin Orthop Relat Res. 2011 Aug;469(8):2150–9. doi: 10.1007/s11999-010-1706-9. [DOI] [PMC free article] [PubMed] [Google Scholar]
- 6.Morgan S, Poundarik AA, Vashishth D. Do Non-collagenous Proteins Affect Skeletal Mechanical Properties? Calcif Tissue Int. 2015 Sep;97(3):281–91. doi: 10.1007/s00223-015-0016-3. [DOI] [PMC free article] [PubMed] [Google Scholar]
- 7.Sroga GE, Vashishth D. Effects of bone matrix proteins on fracture and fragility in osteoporosis. Curr Osteoporos Rep. 2012;10:141–50. doi: 10.1007/s11914-012-0103-6. [DOI] [PMC free article] [PubMed] [Google Scholar]
- 8.Olszta MJ, Cheng X, Jee SS, Kumar R, Kim Y-Y, Kaufman MJ, et al. Bone structure and formation: a new perspective. Mater Sci Eng R Reports. 2007 Nov;58(3–5):77–116. [Google Scholar]
- 9.Stein GS, Lian JB, Owen TA. Relationship of cell growth to the regulation of tissue-specific gene expression during osteoblast differentiation. FASEB J. 1990 Oct 1;4(13):3111–23. doi: 10.1096/fasebj.4.13.2210157. [DOI] [PubMed] [Google Scholar]
- 10.Boskey A, Gadaleta S, Gundberg C, Doty S, Ducy P, Karsenty G. Fourier transform infrared microspectroscopic analysis of bones of osteocalcin-deficient mice provides insight into the function of osteocalcin. Bone. 1998 Sep;23(3):187–96. doi: 10.1016/s8756-3282(98)00092-1. [DOI] [PubMed] [Google Scholar]
- 11.Thurner PJ, Chen CG, Ionova-Martin S, Sun L, Harman A, Porter A, et al. Osteopontin deficiency increases bone fragility but preserves bone mass. Bone. 2010;46(6):1564–73. doi: 10.1016/j.bone.2010.02.014. [DOI] [PMC free article] [PubMed] [Google Scholar]
- 12.Poundarik A, Diab T, Sroga G, Ural A, Boskey A, Gundberg C, et al. Dilatational band formation in bone. Proc Natl Acad Sci. 2012;109(47):19178–83. doi: 10.1073/pnas.1201513109. [DOI] [PMC free article] [PubMed] [Google Scholar]
- 13.Ellman R, Spatz J, Cloutier A, Palme R, Christiansen BA, Bouxsein ML. Partial reductions in mechanical loading yield proportional changes in bone density, bone architecture, and muscle mass. J Bone Miner Res. 2013 Apr;28(4):875–85. doi: 10.1002/jbmr.1814. [DOI] [PMC free article] [PubMed] [Google Scholar]
- 14.Willinghamm M, Brodt M. Age-related changes in bone structure and strength in female and male BALB/c mice. Calcif tissue …. 2010;86(6):470–83. doi: 10.1007/s00223-010-9359-y. [DOI] [PMC free article] [PubMed] [Google Scholar]
- 15.Ritchie R, Koester K, Ionova S, Yao W, Lane N, Ager J. Measurement of the toughness of bone: a tutorial with special reference to small animal studies. Bone. 2008 Nov;43(5):798–812. doi: 10.1016/j.bone.2008.04.027. [DOI] [PMC free article] [PubMed] [Google Scholar]
- 16.Turner C, Burr D. Basic biomechanical measurements of bone: a tutorial. Bone. 1993 Jul;14(4):595–608. doi: 10.1016/8756-3282(93)90081-k. [DOI] [PubMed] [Google Scholar]
- 17.Jepsen KJ, Silva MJ, Vashishth D, Guo XE, van der Meulen MC. Establishing biomechanical mechanisms in mouse models: practical guidelines for systematically evaluating phenotypic changes in the diaphyses of long bones. J Bone Miner Res. 2015 Jun;30(6):951–66. doi: 10.1002/jbmr.2539. [DOI] [PMC free article] [PubMed] [Google Scholar]
- 18.Jepsen KJ, Hu B, Tommasini SM, Courtland H-W, Price C, Terranova CJ, et al. Genetic randomization reveals functional relationships among morphologic and tissue-quality traits that contribute to bone strength and fragility. Mamm Genome. 2007 Jul;18(6–7):492–507. doi: 10.1007/s00335-007-9017-5. [DOI] [PMC free article] [PubMed] [Google Scholar]
- 19.Kingsolver JG, Schemske DW. Path Analyses of Selection. Trends Ecol Evol. 1991;6(9):276–80. doi: 10.1016/0169-5347(91)90004-H. [DOI] [PubMed] [Google Scholar]
- 20.Scheiner SM, Mitchell RJ, Callahan HS. Using path analysis to measure natural selection. J Evol Biol. 2000;13:423–33. [Google Scholar]
- 21.Price C, Herman BC, Lufkin T, Goldman HM, Jepsen KJ. Genetic Variation in Bone Growth Patterns Defines Adult Mouse Bone Fragility. J Bone Miner Res. 2005;20(11):1983–91. doi: 10.1359/JBMR.050707. [DOI] [PubMed] [Google Scholar]
- 22.Cole JH, van der Meulen MCH. Whole bone mechanics and bone quality. Clin Orthop Relat Res. 2011 Aug;469(8):2139–49. doi: 10.1007/s11999-011-1784-3. [DOI] [PMC free article] [PubMed] [Google Scholar]
- 23.Donnelly E. Methods for assessing bone quality: a review. Clin Orthop Relat Res. 2011 Aug;469(8):2128–38. doi: 10.1007/s11999-010-1702-0. [DOI] [PMC free article] [PubMed] [Google Scholar]
- 24.Ejersted C, Andreassen TT, Oxlund H, Jørgensen PH, Bak B, Häggblad J, et al. Human parathyroid hormone (1–34) and (1–84) increase the mechanical strength and thickness of cortical bone in rats. J Bone Miner Res. 1993 Oct;8(9):1097–101. doi: 10.1002/jbmr.5650080910. [DOI] [PubMed] [Google Scholar]
- 25.Brodt MD, Ellis CB, Silva MJ. Growing C57Bl/6 mice increase whole bone mechanical properties by increasing geometric and material properties. J Bone Miner Res. 1999 Dec;14(12):2159–66. doi: 10.1359/jbmr.1999.14.12.2159. [DOI] [PubMed] [Google Scholar]
- 26.Andreassen TT, Jørgensen PH, Flyvbjerg A, Orskov H, Oxlund H. Growth hormone stimulates bone formation and strength of cortical bone in aged rats. J Bone Miner Res. 1995 Jul;10(7):1057–67. doi: 10.1002/jbmr.5650100710. [DOI] [PubMed] [Google Scholar]
- 27.Martin B. Aging and strength of bone as a structural material. Calcif Tissue Int. 1993 Feb;53(1):34–40. doi: 10.1007/BF01673400. [DOI] [PubMed] [Google Scholar]
- 28.Clarke B. Normal bone anatomy and physiology. Clin J Am Soc Nephrol. 2008 Nov;3(Suppl 3):131–9. doi: 10.2215/CJN.04151206. [DOI] [PMC free article] [PubMed] [Google Scholar]
- 29.Rittling S, Matsumoto H, McKee M, Nanci A, An X, Novick K, et al. Mice lacking osteopontin show normal development and bone structure but display altered osteoclast formation in vitro. J bone Miner Res. 1998 Jul;13(7):1101–11. doi: 10.1359/jbmr.1998.13.7.1101. [DOI] [PubMed] [Google Scholar]
- 30.Ducy P, Desbois C, Boyce B, Pinero G. Increased bone formation in osteocalcin-deficient mice. Nature. 1996 Aug;382(Suppl 6590):448–52. doi: 10.1038/382448a0. [DOI] [PubMed] [Google Scholar]
- 31.Thurner PJ, Chen CG, Ionova-Martin S, Sun L, Harman A, Porter A, et al. Osteopontin deficiency increases bone fragility but preserves bone mass. Bone. 2010 Jun;46(6):1564–73. doi: 10.1016/j.bone.2010.02.014. [DOI] [PMC free article] [PubMed] [Google Scholar]
- 32.Duvall CL, Taylor WR, Weiss D, Wojtowicz AM, Guldberg RE. Impaired angiogenesis, early callus formation, and late stage remodeling in fracture healing of osteopontin-deficient mice. J Bone Miner Res. 2007 Feb;22(2):286–97. doi: 10.1359/jbmr.061103. [DOI] [PubMed] [Google Scholar]
- 33.Frost HM. Bone “mass” and the “mechanostat”: a proposal. Anat Rec. 1987 Sep;219(1):1–9. doi: 10.1002/ar.1092190104. [DOI] [PubMed] [Google Scholar]
- 34.Currey JD. Effects of differences in mineralization on the mechanical properties of bone. Philos Trans R Soc Lond B Biol Sci. 1984 Feb;304(1121):509–18. doi: 10.1098/rstb.1984.0042. [DOI] [PubMed] [Google Scholar]
- 35.Kavukcuoglu NB, Denhardt DT, Guzelsu NMA. Osteopontin deficiency and aging on nanomechanics of mouse bone. J Biomed Mater Res Part A. 2007 Oct;83(1):136–44. doi: 10.1002/jbm.a.31081. [DOI] [PubMed] [Google Scholar]
- 36.Kavukcuoglu N, Patterson-Buckendahl P, Mann A. Effect of osteocalcin deficiency on the nanomechanics and chemistry of mouse bones. J Mech Behav Biomed Mater. 2008 Aug;2(4):348–54. doi: 10.1016/j.jmbbm.2008.10.010. [DOI] [PubMed] [Google Scholar]