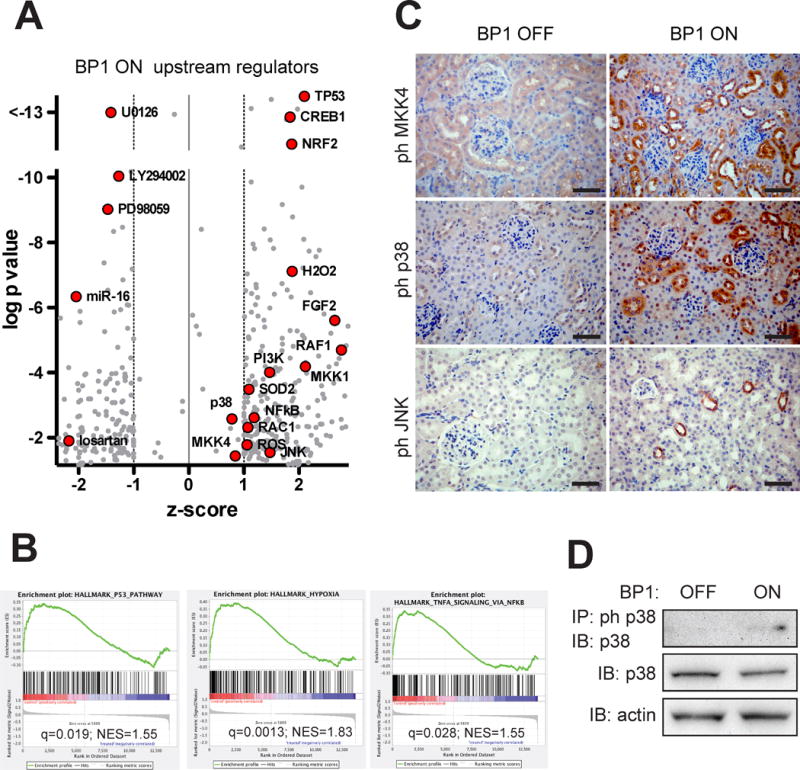
Figure 5.

Signal transduction changes in kidneys after the induction of BP1. A, Gene expression data were subjected to an analysis for Upstream Regulators using the Ingenuity platform (see Supplemental Methods). z-scores and p-values (−log) are shown. Relevant data points are labeled (red symbols). A complete list (grey symbols) is provided in Table S1. B, Hallmark pathways from a Gene Set Enrichment Analysis of the gene expression data (see Supplemental Methods). NES, normalized enrichment score; q, false discovery adjusted p-value. A complete list is provided in Table S2. C, Detection of phospho-MKK4 or phospho-p38 or phospho-JNK by immunohistochemistry of kidneys from BP1 OFF and ON mice (total n=3). Size bar: 50 μm. Note: Positive immunoreactivity results in dark brown staining. D, Phospho-p38 Western blot analysis of kidney extracts from BP1 OFF and ON animals after immunoprecipitation for phospho-p38. Total p38 protein is shown for comparison.
