Abstract
The mechanistic Target Of Rapamycin Complex 1 (mTORC1) is recruited to the lysosome by Rag GTPases and regulates anabolic pathways in response to nutrients. Here we find that MiT/TFE transcription factors, master regulators of lysosomal and melanosomal biogenesis and autophagy, control mTORC1 lysosomal recruitment and activity by directly regulating the expression of RagD. In mice this mechanism mediated adaptation to food availability after starvation and physical exercise and played an important role in cancer growth. Up-regulation of MiT/TFE genes in cells and tissues from patients and murine models of renal cell carcinoma, pancreatic ductal adenocarcinoma, and melanoma triggered RagD-mediated mTORC1 induction, resulting in cell hyper-proliferation and cancer growth. Thus, this transcriptional regulatory mechanism enables cellular adaptation to nutrient availability and supports the energy-demanding metabolism of cancer cells.
A major determinant of species evolution is the ability to switch between anabolic and catabolic pathways in response to nutrient availability. The nutrient-activated kinase complex mTORC1 promotes biosynthetic processes and inhibits catabolic pathways such as autophagy (1, 2), thus playing a crucial role in the adaptation of the organism to the environment (3, 4). The transcription factors TFEB, TFE3, TFEC and MITF belong to the MiT-TFE family and bind the same target sites in the proximal promoters of overlapping sets of genes (5, 6). TFEB and TFE3 are master transcriptional regulators of lysosomal biogenesis and autophagy (6–8), while MITF regulates melanosomal biogenesis (9). mTORC1 negatively regulates the activity of these transcription factors by phosphorylating critical serine residues, leading to their cytoplasmic retention (8, 10–12). Conversely, during starvation or physical exercise inhibition of mTORC1 and activation of the phosphatase calcineurin leads to TFEB and TFE3 de-phosphorylation and nuclear translocation (13, 14).
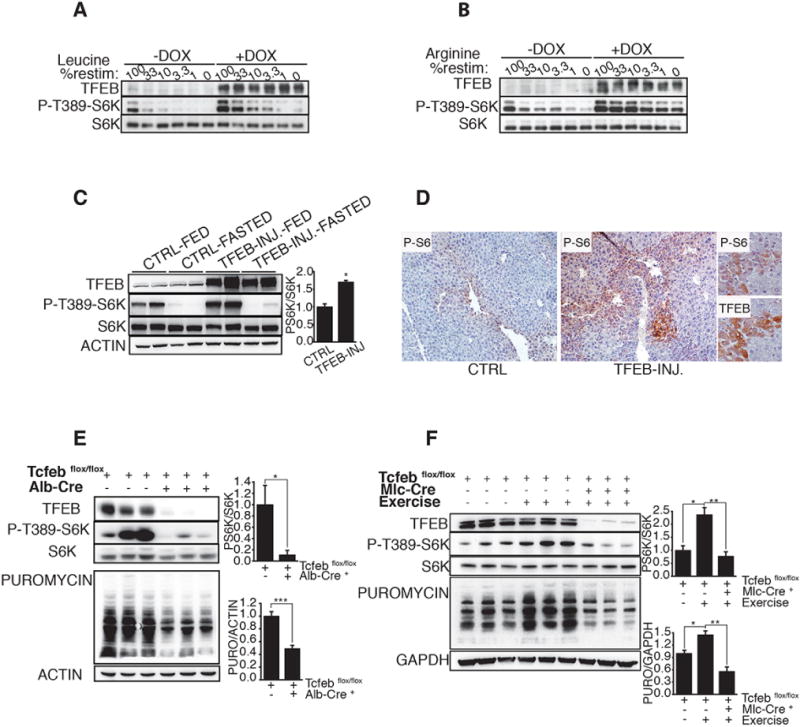
We postulated the presence of a feedback loop by which MiT-TFE transcription factors, which are substrates of mTORC1, may in turn influence mTORC1 activity. SiRNA-mediated depletion of either TFEB or TFE3 in HeLa cells significantly decreased mTORC1 activity upon amino-acid administration (Fig. S1A,B). Furthermore, mTORC1 reactivation upon prolonged starvation (15) was inhibited in TFEB-silenced cells (Fig. S1C). Overexpression of either wild type or constitutively active TFEB and TFE3 (TFEB-CA and TFE3-CA) resulted in increased mTORC1 activation upon stimulation with a either a complete set of amino acids (Fig. S1A,B; Fig. S2) or solely leucine or arginine, the key amino acids that activate mTORC1 (16) (Fig. 1A,B). Consistently, viral-mediated TFEB overexpression in the liver of wild type mice increased mTORC1 signaling (Fig. 1C,D). Conversely, a significant reduction in the rate of protein synthesis and impaired mTORC1 signaling were detected in the livers from TFEB liver-specific conditional KO mice (Tcfebflox/flox; Alb-CRE+; hereafter Tcfeb-LiKO) (Fig. 1E). In addition, exercised muscle-specific TFEB KO mice (Tcfebflox/flox; Mlc-CRE+; hereafter Tcfeb-MuKO) showed a reduced induction of mTORC1 activity and protein synthesis in response to leucine after exercise (Fig. 1F). Thus, the effect of a protein meal after exercise on muscle protein synthesis requires TFEB-induced transcriptional activation of mTORC1 signaling.
Fig 1. MiT/TFE transcription factors regulate mTORC1 activity both in vitro and in vivo.

(A,B) Representative immuno-blotting analysis of TFEB, phospho-S6K and S6K in Tet-ON TFEB-CA cell line untreated (−DOX) or treated with Doxycycline (+DOX) for 24h. Cells were starved for a.a. for 50 min (0) and stimulated with decreasing levels (expressed as % of concentration in RPMI medium) of leucine (A) or arginine (B) for 20 min. (C) C57BL6 mice injected with a Helper-Dependent adenovirus (HDad) expressing human TFEB under the control of a liver-specific promoter (TFEB-INJ.), or with PBS (CTRL) were starved for 22h (FASTED), and then reefed for 2h (FED). Liver lysates were analyzed for levels of indicated proteins. Actin was used as loading control. The plot shows ratio of phosphorylated S6K/pan-S6K (mean of three independent experiments). (D) Immunohistochemistry analysis of liver sections from mice injected with saline PBS (CTRL) or HDAd-TFEB (TFEB-INJ.). Tissues were stained for serine 240/244 phosphorylated-S6 (P-S6). Insets show overlapping P-S6 and TFEB immunostainings in two consecutive 5μm liver sections isolated from HDad-TFEB injected mice. (E) Liver samples from mice with indicated genotypes were analyzed for the levels of S6K phosphorylation and puromycin incorporation. The plots show the ratios of phosphorylated S6K/pan-S6K and puromycin/actin expressed as relative to control mice (Tcfebflox/flox). (F) Phosphorylation of S6K and levels of puromycin incorporation analysis in muscle samples from mice with indicated genotypes after oral gavage of leucine. Mice were exercised where indicated. The plots show ratios of phosphorylated S6K/pan-S6K and puromycin/GAPDH. The plots in (C), (E) represent means of triplicates +/− SEM, Student t-test. The plot in (F) represent means +/− SEM; N=3; Anova (one-way) followed by Tukey’s test. In (C), (E), (F) *p < 0.05 **=p < 0.01, ***p < 0.001.
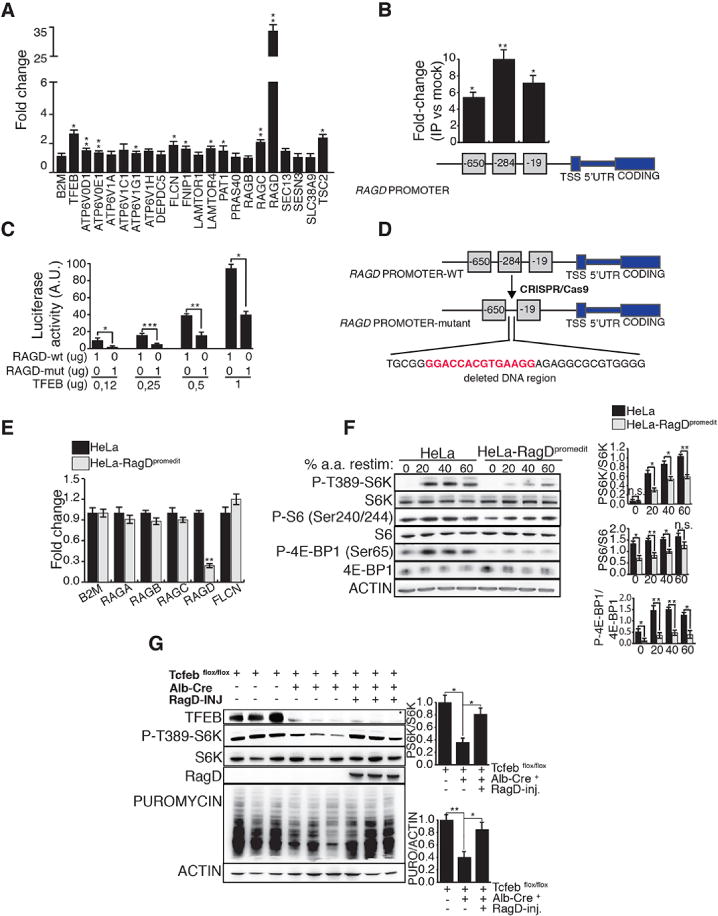
TFEB overexpression in cells lacking the essential autophagy genes Atg5 or Atg7 still resulted in enhanced mTORC1 activity, similar to wild type cells (Fig. S3). Thus, MiT-TFE transcription factors may regulate mTORC1 by a mechanism which is different from autophagy. To identify such a mechanism, we searched for TFEB DNA binding sites, defined as “CLEAR elements” (6), in the promoters of 50 human genes known to play a role in the activation of mTORC1. Among 20 TFEB/TFE3 putative target genes (Table S1,2), the transcript levels of the GTPase RagD were the most significantly decreased upon single or combined TFEB or TFE3 silencing (Fig. S4A–C). Conversely, RagD was strongly induced in TFEB-overexpressing cells both at the mRNA (Fig. 2A; Fig. S4D) and protein levels (Fig S4E,F). An induction of RagD expression was also detected in liver samples from mice injected with Helper Dependent adenovirus (HDad) containing TFEB or TFE3 (Fig S4G), while a reduction of RagD expression was observed in TFEB Li-KO and TFE3 full KO mice (Fig S4H). To exert its activity RagD and RagC need to heterodimerize with RagA or RagB and to be activated by Folliculin (FLCN), a GTPase activating protein (GAP) (17). RagC and FLCN expression levels were also influenced by MiT-TFE genes, albeit to a lesser extent compared to RagD (Fig 2A; S4A–D). RagD is expressed at very low levels, thus we postulate that RagD is a limiting factor for RagGTPase activity.
Fig 2. MiT/TFE transcription factors control mTORC1 activity through RagD.

(A) mRNA levels of mTORC1-related genes in TFEB-CA HeLa cells treated with doxycycline. Values were normalized relative to HPRT1 and expressed as fold change relative to untreated cells. (B) ChIP analysis of TFEB binding to RagD promoter in doxycycline treated HeLa TFEB-CA cells. Squares represent CLEAR sites in RagD promoter and numbers refer to their distance (bp) from the transcriptional start site (TSS). Immuno-precipitated DNA was normalized to the input and plotted as relative enrichment over a mock control. (C) Luciferase assay analysis after transfection of increasing amounts of TFEB construct was performed in HeLa cells co-transfected with a wild type (RAGD-wt) or mutated (RAGD-mut) RagD-promoter luciferase reporter plasmids. (D) Scheme of CRISPR/Cas9-mediated mutation in the endogenous RagD promoter of HeLa cells. A region of 33bp containing the CLEAR site at position −284 (in red) was ablated. (E) Transcript levels of Rags and Flcn genes were analyzed in the mutated HeLa cell line (HeLa-RagDpromedit) versus control HeLa and normalized relative to HPRT1 gene. (F) Immuno-blotting analysis of mTORC1 signaling in HeLa-RagDpromedit cells compared to control HeLa. The ratio of phosphorylated/total protein levels were shown for the indicated mTORC1 substrates. The plots in (A), (B), (C), (E), (F) represent mean ± SEM of 3 independent experiments (Student t test). (G) Mice with indicated genotypes were nutritionally synchronized and injected with puromycin 30 minutes prior sacrifice. Where indicated Tcfebflox/flox; Alb-Cre+ mice were injected with an AAV-vector carrying human RagD cDNA. Liver lysates were analyzed for phosphorylation of S6K and levels of puromycin incorporation. The plots show means of triplicates +/− SEM, Anova (one-way) expressed as ratio of phosphorylated S6K/pan-S6K and puromycin/actin. In (A), (B), (C), (E), (F), (G) *p <0.05, **p <0.01, ***p<0.001.
Chromatin Immuno-Precipitation (ChiP) and luciferase assay experiments revealed that RagD is a direct transcriptional target of TFEB (Fig 2B,C). Thus, we used a CRISPR-Cas9-mediated genome editing approach to delete the most responsive TFEB target site in the RagD proximal promoter region in HeLa cells (HeLa-RagDpromedit) (Fig 2D). This cell line showed significantly reduced transcript and protein levels of RagD, while other mTORC1-related genes were not affected (Fig 2E and S5A), as well as a significant impairment of mTORC1 activation upon amino acid stimulation (Fig 2F and S5B,C). Overexpression of exogenous RagD rescued mTORC1 signaling in the HeLa-RagDpromedit cell line (Fig S5D). Consistently, viral-mediated RagD gene delivery rescued impaired mTORC1 signaling and defective protein synthesis in the livers of Tcfeb-LiKO mice (Fig 2G). Thus, the transcriptional regulation of RagD expression by MiT-TFE transcription factors plays an important role in the control of mTORC1 activity.
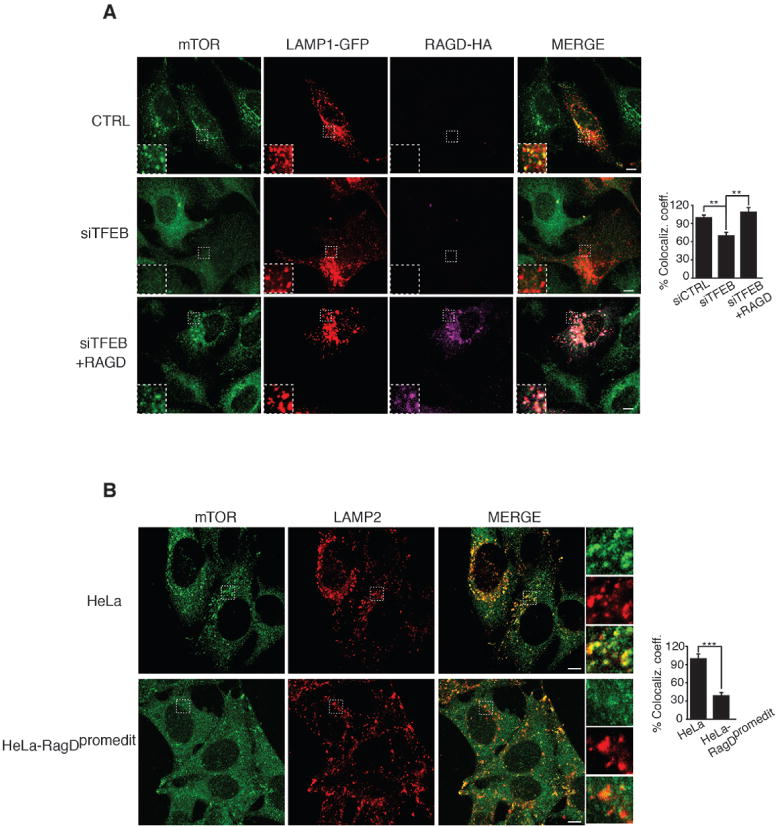
TFEB and TFE3 are activated by starvation (7, 18). Consistently, we observed an increase of RagD mRNA and protein levels during starvation, which was blunted by silencing of either TFEB or TFE3 (Fig. S6A,B). In addition, we found a significant correlation between starvation-induced TFEB nuclear localization and RagD expression levels (Fig S6C,D). Accordingly, fasting and physical exercise in mice induced RagD expression in liver and muscle, which was blunted in TFEB Li-KO and Mu-KO mice, respectively (S6 E,F). Nutrients induce mTORC1 recruitment to the lysosomal surface via the interaction of Rag GTPases with the Raptor subunit of the mTORC1 complex (19, 20). We detected an increase of amino acid-induced mTORC1 recruitment to the lysosome in TFEB-CA overexpressing cells compared with wild type cells (Fig S7A,B), while an opposite effect was observed in TFEB-depleted cells as well as in the HeLa-RagDpromedit cell line (Fig 3A,B), which was rescued by RagD overexpression (Fig 3A). Thus, TFEB-mediated control of RagD promotes the efficient recruitment of mTORC1 to the lysosome.
Fig 3. MiT/TFE transcription factors promote lysosomal recruitment of mTOR upon nutrient loading.

(A) Representative immunofluorescence images of endogenous mTOR, LAMP1-GFP (visualized as red) and RAGD-HA in HeLa cells. Cells were transfected with scramble (CTRL) or with TFEB siRNA (siTFEB) and after 48 hours with LAMP1-GFP and with RagD-HA plasmids for additional 24 hours. (B) Representative immunofluorescence images of mTOR and LAMP2 in HeLa-RagDpromedit and in control HeLa cells. (A,B) Cells were deprived of a.a. for 50 minutes and then stimulated with a.a. for 15 minutes. The plots represent quantification of the data from 15 cells per condition from three independent experiments. Results are shown as means of co-localization coefficient of mTOR and LAMP1± SEM (Anova, one-way) in (A) of mTOR and LAMP2 ± SEM (Student t test) in (B). (**p < 0.01, ***p < 0.001). Scale bars 10 μm.
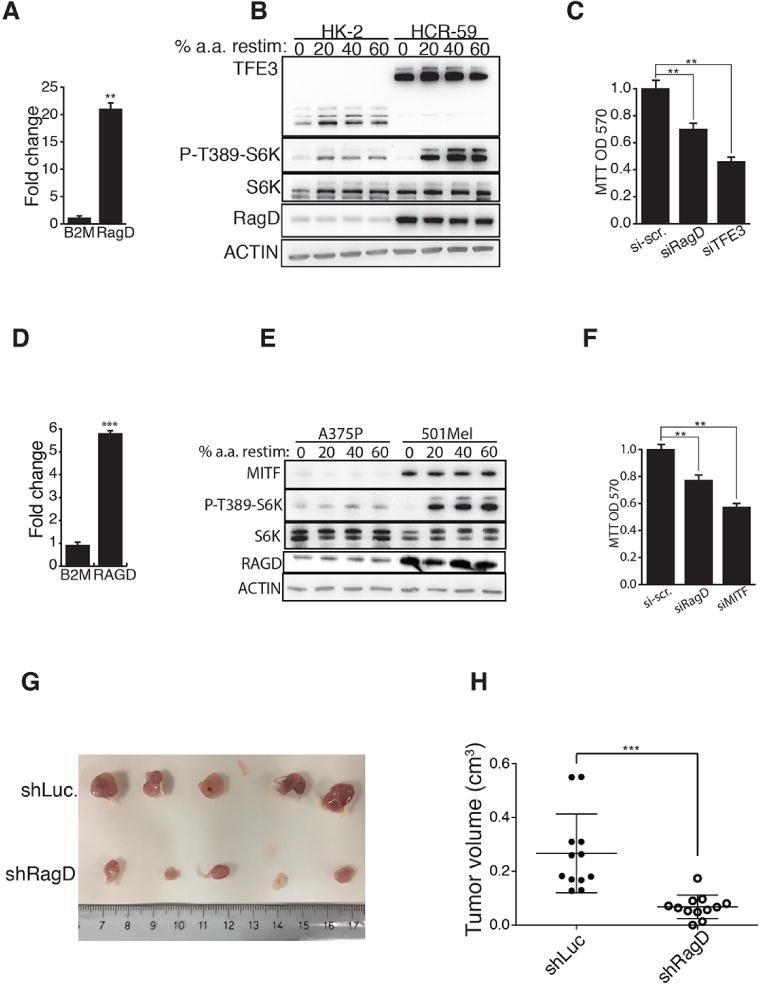
MiT-TFE are known oncogenes overexpressed in a variety of tumors such as renal cell carcinoma (RCC), melanoma, sarcoma and pancreatic ductal adenocarcinoma (21–23). TFEB kidney-specific conditional overexpressing mice display a phenotype that closely recapitulates human RCC (24). We observed hyper-activation of mTORC1 signaling and increased RagD transcript levels in both kidney tissues and primary kidney cells from these mice (Fig S8A–C). Treatment with the mTORC1 inhibitor Torin 1 fully rescued the hyper-proliferative phenotype of primary kidney cells (Fig S8D). Similarly, kidney cells derived from a patient with RCC carrying a chromosomal translocation that involves the TFE3 gene (HCR-59) showed increased RagD transcript levels and enhanced mTORC1 signaling (Fig 4A,B). Notably, silencing of either TFE3 or RagD rescued mTORC1 hyper-activation and reduced tumor cell proliferation (Fig S8E,F and 4C). Furthermore, a survey of RNA sequencing data obtained from patients with RCC carrying TFE3 chromosomal translocations revealed a consistent increase of RagD expression levels (Fig S8G) (25). We also analyzed cell lines from patients with Pancreatic Ductal Adenocarcinoma (PDA) in which several MiT/TFE genes are up-regulated (23) and found increased RagD levels (Fig S9A,B). Silencing of TFE3 in two of these cell lines decreased RagD levels and rescued mTORC1 hyper-activation (Fig S9C–F).
Fig 4. Deregulation of the MiT/TFE-RagD-mTORC1 regulatory axis supports cancer growth.

(A) mRNA levels of RagD in a cell line from a patient with RCC (HCR-59) relative to control kidney cells (HK-2). B2M expression was shown as control unrelated gene. Gene expression was normalized relative to HPRT1. The plot represents means of three independent experiments ± SEM; Student t test. (B) Analysis of S6K phosphorylation at threonine 389 in HK-2 and HCR-59 cells 50 min starved for a.a. (0) and then stimulated with increasing levels of amino acids for 20 min. (C) Proliferation levels of HCR-59 cells transfected with scramble (SCR), RagD or TFE3 siRNAs. The plot represents means of three independent experiments ± SEM; Anova (one way). (D) MITF-dependent melanoma patient-derived cells (501Mel) were analyzed for mRNA levels of RagD (B2M expression was shown as control unrelated gene). Values were expressed as relative to control melanoma cells (A375P). Gene expression was normalized relative to HPRT1. The plot represents means of three independent experiments ± SEM (Student t test). (E) Representative immunoblotting analysis for the indicated proteins in control (A375P) and MITF-dependent melanoma (501Mel) cells stimulated with increased levels of amino acids. (F) Proliferation index of 501Mel cells transfected with scramble (SCR), RagD or MITF siRNAs. The plot represents means of three independent experiments ± SEM; Anova (one way). (G,H) 501Mel cells were infected with a lentivirus expressing a short harpin RNA targeting the Luciferase (control, Sh-Luc) or RagD mRNAs and transplanted in NSG mice. (G) Representative picture of tumors isolated from both groups of mice. (H) Plot shows tumor volumes. Each dot represents a tumor. 12 tumors (n=12 mice) were analyzed per group; Student t test. In (A), (C), (D), (F), (H) **p<0.01, ***p < 0.001.
MITF, another member of the MiT/TFE family, is an established oncogene in melanoma (26). Transient overexpression of MITF in HeLa cells induced up-regulation of RagD transcript levels and increased mTORC1 activation (Fig S9G,H), indicating that also MITF is able to positively regulate RagD expression. Consistently, a cell line from a patient with melanoma, associated with high levels of MITF, 501mel, showed induction of RagD expression and increased mTORC1 activation (Fig 4D,E). Notably, silencing of RagD was sufficient to significantly revert the hyper-proliferative phenotype of this tumor cell line (Fig 4F). In addition, a survey of published microarray data available for melanoma metastatic patients (TCGA data set) and melanoma cell lines (GEO database) revealed a significant correlation between MITF and RagD gene expression levels (Fig S9I,J). Importantly, xenotransplantation experiments performed using the 501mel melanoma cell line showed strikingly reduced xenograft tumor growth upon RagD-silencing, demonstrating a key role of RagD in promoting tumor growth (Fig 4G,H). In conclusion, we identified an MiT/TFE-RagD-mTORC1-MiT/TFE feedback circuit, whose fine modulation is critical for metabolic adaptation to nutrient availability. Deregulation of this mechanism supports cancer metabolism, thus promoting tumor growth (Fig. S10).
Supplementary Material
Acknowledgments
We are grateful to Drs. Maria Antonietta De Matteis, Graciana Diez-Roux and Gennaro Napolitano for helpful suggestions. We thank Drs. AnnaChiara Salzano and Emanuela De Gennaro for technical assistance. This work was supported by grants from the Italian Telethon Foundation (TGM11CB6), the European Research Council Advanced Investigator grant no. 250154 (CLEAR) (A.B.) and no 341131 (InMec) (P.G.P.); US National Institutes of Health (R01-NS078072) (A.B.) and the Associazione Italiana per la Ricerca sul Cancro (A.I.R.C.) to A.B (IG 2015 Id 17639) and C.S. (IG 2015 Id 17717).
Footnotes
REFERENCES AND NOTES
- 1.Rabinowitz JD, White E. Science. 2010;330:1344–1348. doi: 10.1126/science.1193497. [DOI] [PMC free article] [PubMed] [Google Scholar]
- 2.Saxton RA, Sabatini DM. Cell. 2017;169:361–371. doi: 10.1016/j.cell.2017.03.035. [DOI] [PubMed] [Google Scholar]
- 3.Howell JJ, Manning BD. Trends Endocrinol Metab TEM. 2011;22:94–102. doi: 10.1016/j.tem.2010.12.003. [DOI] [PMC free article] [PubMed] [Google Scholar]
- 4.Watson K, Baar K. Semin Cell Dev Biol. 2014;36:130–139. doi: 10.1016/j.semcdb.2014.08.013. [DOI] [PubMed] [Google Scholar]
- 5.Steingrimsson E, Copeland NG, Jenkins NA. Annu Rev Genet. 2004;38:365–411. doi: 10.1146/annurev.genet.38.072902.092717. [DOI] [PubMed] [Google Scholar]
- 6.Sardiello M, et al. Science. 2009;325:473–477. doi: 10.1126/science.1174447. [DOI] [PubMed] [Google Scholar]
- 7.Settembre C, et al. Science. 2011;332:1429–1433. doi: 10.1126/science.1204592. [DOI] [PMC free article] [PubMed] [Google Scholar]
- 8.Martina JA, et al. Sci Signal. 2014;7:ra9. doi: 10.1126/scisignal.2004754. [DOI] [PMC free article] [PubMed] [Google Scholar]
- 9.Hodgkinson CA, et al. Cell. 1993;74:395–404. doi: 10.1016/0092-8674(93)90429-t. [DOI] [PubMed] [Google Scholar]
- 10.Settembre C, et al. EMBO J. 2012;31:1095–1108. doi: 10.1038/emboj.2012.32. [DOI] [PMC free article] [PubMed] [Google Scholar]
- 11.Roczniak-Ferguson A, et al. Sci Signal. 5:ra42. doi: 10.1126/scisignal.2002790. [DOI] [PMC free article] [PubMed] [Google Scholar]
- 12.Martina JA, Puertollano R. J Cell Biol. 2013;200:475–491. doi: 10.1083/jcb.201209135. [DOI] [PMC free article] [PubMed] [Google Scholar]
- 13.Settembre C, Fraldi A, Medina DL, Ballabio A. Nat Rev Mol Cell Biol. 2013;14:283–296. doi: 10.1038/nrm3565. [DOI] [PMC free article] [PubMed] [Google Scholar]
- 14.Medina DL, et al. Nat Cell Biol. 2015;17:288–299. doi: 10.1038/ncb3114. [DOI] [PMC free article] [PubMed] [Google Scholar]
- 15.Yu L, et al. Nature. 2010;465:942–946. doi: 10.1038/nature09076. [DOI] [PMC free article] [PubMed] [Google Scholar]
- 16.Ban H, et al. Int J Mol Med. 2004;13:537–543. [PubMed] [Google Scholar]
- 17.Tsun ZY, et al. Mol Cell. 2013;52:495–505. doi: 10.1016/j.molcel.2013.09.016. [DOI] [PMC free article] [PubMed] [Google Scholar]
- 18.Martina JA, et al. Sci Signal. 2014;7:ra9. doi: 10.1126/scisignal.2004754. [DOI] [PMC free article] [PubMed] [Google Scholar]
- 19.Sancak Y, et al. Science. 2008;320:1496–1501. doi: 10.1126/science.1157535. [DOI] [PMC free article] [PubMed] [Google Scholar]
- 20.Kim E, Goraksha-Hicks P, Li L, Neufeld TP, Guan KL. Nat Cell Biol. 2008;10:935–945. doi: 10.1038/ncb1753. [DOI] [PMC free article] [PubMed] [Google Scholar]
- 21.Haq R, Fisher DE. J Clin Oncol Off J Am Soc Clin Oncol. 2011;29:3474–3482. doi: 10.1200/JCO.2010.32.6223. [DOI] [PubMed] [Google Scholar]
- 22.Kauffman EC, et al. Nat Rev Urol. 2014;11:465–475. doi: 10.1038/nrurol.2014.162. [DOI] [PMC free article] [PubMed] [Google Scholar]
- 23.Perera RM, et al. Nature. 2015;524:361–365. doi: 10.1038/nature14587. [DOI] [PMC free article] [PubMed] [Google Scholar]
- 24.Calcagni A, et al. eLife. 2016;5 doi: 10.7554/eLife.17047. [DOI] [PMC free article] [PubMed] [Google Scholar]
- 25.Malouf GG, et al. Clin Cancer Res Off J Am Assoc Cancer Res. 2014;20:4129–4140. doi: 10.1158/1078-0432.CCR-13-3036. [DOI] [PMC free article] [PubMed] [Google Scholar]
- 26.Tsao H, Chin L, Garraway LA, Fisher DE. Genes Dev. 2012;26:1131–1155. doi: 10.1101/gad.191999.112. [DOI] [PMC free article] [PubMed] [Google Scholar]
- 27.Halaban R, Cheng E, Smicun Y, Germino J. J Exp Med. 2000;191:1005–1016. doi: 10.1084/jem.191.6.1005. [DOI] [PMC free article] [PubMed] [Google Scholar]
- 28.Primot A, et al. Pigment Cell Melanoma Res. 2010;23:93–102. doi: 10.1111/j.1755-148X.2009.00652.x. [DOI] [PubMed] [Google Scholar]
- 29.Steingrimsson E, et al. Proc Natl Acad Sci U S A. 2002;99:4477–4482. doi: 10.1073/pnas.072071099. [DOI] [PMC free article] [PubMed] [Google Scholar]
- 30.Settembre C, et al. Nat Cell Biol. 2013;15:647–658. doi: 10.1038/ncb2718. [DOI] [PMC free article] [PubMed] [Google Scholar]
- 31.Ezaki J, et al. Autophagy. 2011;7:727–736. doi: 10.4161/auto.7.7.15371. [DOI] [PMC free article] [PubMed] [Google Scholar]
Associated Data
This section collects any data citations, data availability statements, or supplementary materials included in this article.


