

Abstract
Key points
Brief dopamine events are critical actors of reward‐mediated learning in the striatum; the intracellular cAMP–protein kinase A (PKA) response of striatal medium spiny neurons to such events was studied dynamically using a combination of biosensor imaging in mouse brain slices and in silico simulations.
Both D1 and D2 medium spiny neurons can sense brief dopamine transients in the sub‐micromolar range.
While dopamine transients profoundly change cAMP levels in both types of medium spiny neurons, the PKA‐dependent phosphorylation level remains unaffected in D2 neurons.
At the level of PKA‐dependent phosphorylation, D2 unresponsiveness depends on protein phosphatase‐1 (PP1) inhibition by DARPP‐32.
Simulations suggest that D2 medium spiny neurons could detect transient dips in dopamine level.
Abstract
The phasic release of dopamine in the striatum determines various aspects of reward and action selection, but the dynamics of the dopamine effect on intracellular signalling remains poorly understood. We used genetically encoded FRET biosensors in striatal brain slices to quantify the effect of transient dopamine on cAMP or PKA‐dependent phosphorylation levels, and computational modelling to further explore the dynamics of this signalling pathway. Medium‐sized spiny neurons (MSNs), which express either D1 or D2 dopamine receptors, responded to dopamine by an increase or a decrease in cAMP, respectively. Transient dopamine showed similar sub‐micromolar efficacies on cAMP in both D1 and D2 MSNs, thus challenging the commonly accepted notion that dopamine efficacy is much higher on D2 than on D1 receptors. However, in D2 MSNs, the large decrease in cAMP level triggered by transient dopamine did not translate to a decrease in PKA‐dependent phosphorylation level, owing to the efficient inhibition of protein phosphatase 1 by DARPP‐32. Simulations further suggested that D2 MSNs can also operate in a ‘tone‐sensing’ mode, allowing them to detect transient dips in basal dopamine. Overall, our results show that D2 MSNs may sense much more complex patterns of dopamine than previously thought.
Keywords: biosensor imaging, dopamine, intracellular second messengers
Key points
Brief dopamine events are critical actors of reward‐mediated learning in the striatum; the intracellular cAMP–protein kinase A (PKA) response of striatal medium spiny neurons to such events was studied dynamically using a combination of biosensor imaging in mouse brain slices and in silico simulations.
Both D1 and D2 medium spiny neurons can sense brief dopamine transients in the sub‐micromolar range.
While dopamine transients profoundly change cAMP levels in both types of medium spiny neurons, the PKA‐dependent phosphorylation level remains unaffected in D2 neurons.
At the level of PKA‐dependent phosphorylation, D2 unresponsiveness depends on protein phosphatase‐1 (PP1) inhibition by DARPP‐32.
Simulations suggest that D2 medium spiny neurons could detect transient dips in dopamine level.
Abbreviations
- AC
adenylyl cyclase
- caged fluorescein
fluorescein bis‐(5‐carboxymethoxy‐2‐nitrobenzyl) ether
- DARPP‐32
dopamine‐ and cAMP‐regulated phosphoprotein, Mr 32 kDa
- DMSO
dimethyl sulfoxide
- fsk
forskolin
- IBMX
3,7‐dihydro‐1‐methyl‐3‐(2‐methylpropyl)‐1H‐purine‐2,6‐dione
- LED
light‐emitting diode
- MSN
medium spiny neuron
- NPEC‐DA
(N)‐1‐(2‐nitrophenyl)ethylcarboxy‐3,4‐dihydroxyphenethylamine, a caged version of dopamine
- PDE
phosphodiesterase
- PKA
protein kinase A
- PP
protein phosphatase
- TTX
tetrodotoxin
Introduction
Numerous aspects of the striatal function in behavioural tasks involve dopamine neurotransmission (Schultz, 2002; Nelson & Kreitzer, 2014). Midbrain dopaminergic neurons exhibit two distinct modes of firing: a pacemaker firing pattern (0.5–8 Hz), which generates tonic levels of dopamine, and a transient burst firing pattern (>15 Hz), which accounts for the phasic release of dopamine (Grace & Bunney, 1984a,b; Paladini & Roeper, 2014; Grace, 2016). In the striatum, the phasic release of dopamine is associated with reward‐predicting stimuli and lasts from less than a second to a few seconds (Gonon, 1997; Day et al. 2007; Schultz, 2010). Conversely, the omission of an expected reward, along with punishments, are associated with a depression in the activity of the dopaminergic neurons, thus resulting in a dip in tonic dopamine levels (Schultz & Romo, 1987; Mirenowicz & Schultz, 1996; Matsumoto & Hikosaka, 2009; Hart et al. 2014).
The striatum consists mostly of GABAergic medium‐sized spiny neurons (MSNs), which receive convergent excitatory inputs from cortical and thalamic areas involved in sensorimotor, cognitive and affective functions, and which further project to the output nuclei of the basal ganglia circuitry (Kreitzer, 2009; Lovinger, 2010; Gerfen & Surmeier, 2011; Surmeier et al. 2011). In these neurons, dopamine signals are transduced through the activation of D1‐like and D2‐like dopamine receptors, which control the cAMP–protein kinase A (PKA) cascade in an opposite manner, and thereby regulate important neuronal functions through a number of cellular targets including membrane channels, receptors and nuclear proteins (Reynolds et al. 2001; West & Grace, 2002; Surmeier et al. 2007; Kheirbek et al. 2008; Shen et al. 2008; Bertran‐Gonzalez et al. 2009; Higley & Sabatini, 2010; Cerovic et al. 2013; Biever et al. 2015; Kozorovitskiy et al. 2015). D1 and D2 receptors, the main dopamine receptor subtypes in the dorsal striatum, are segregated in two functionally antagonistic types of MSNs: the D1 MSNs, of the anatomical ‘direct pathway’, which express preferentially the D1 receptors and thus respond to dopamine with an activation of cAMP–PKA signalling, and the D2 MSNs, of the ‘indirect pathway’, which express preferentially the D2 receptors and respond to dopamine with an inhibition of cAMP–PKA signalling (Valjent et al. 2009; Bertran‐Gonzalez et al. 2010; Beaulieu & Gainetdinov, 2011).
In a context where the temporal pattern of dopamine release bears important physiological significance in determining the postsynaptic response (Arbuthnott & Wickens, 2007; Marcott et al. 2014; Yagishita et al. 2014; Swapna et al. 2016), surprisingly, the efficacy of dopamine on the intracellular signalling cascade remains poorly documented. It is commonly assumed that D1 and D2 receptors respond differently to phasic and tonic dopamine: phasic dopamine, which can reach micromolar concentration, is thought to activate the predominantly low‐affinity D1 receptors, while the much lower level of tonic dopamine would be sensed selectively by the D2 receptors. This assumption stems from measurements of receptor affinities (Richfield et al. 1989), but binding approaches have provided a number of conflicting results (Cumming, 2011; Skinbjerg et al. 2012). Moreover, receptor affinity does not correlate to functional efficacy on intracellular signals through a simple relationship (Kenakin, 2013). End‐point measurements of dopamine action upon intracellular signalling have also provided conflicting results, in particular for the D2 receptor, with EC50 values for dopamine ranging from nanomolar to tens of micromolar. Importantly, the temporal conditions of dopamine action were not considered in these studies although strong D1 receptor desensitization has been reported (Dumartin et al. 2000; Kim et al. 2004) and a powerful heterologous sensitization was described for the D2 receptor (Watts & Neve, 1996; Watts et al. 1998). A big leap forward was made with the optogenetic release of endogenous dopamine and electrophysiological monitoring of dopamine action through GIRK2 channels, which demonstrated the unexpected ability of D2 receptors to sense transient dopamine signals (Marcott et al. 2014). However, this approach reported an EC50 for dopamine in the range of tens of micromolar, which is hardly compatible with striatal dopamine levels in vivo. In addition, this latter approach could not provide a comparison of dopamine efficacy between D1 and D2 receptors under the same conditions. More importantly, it did not provide information about dopamine efficacy on the cAMP–PKA signalling pathway.
In this study, we used biosensor imaging on mouse striatal brain slices, photo‐release of caged dopamine and computational modelling to investigate the effect of transient dopamine signals on cAMP–PKA signalling, in both D1 and D2 striatal MSNs concurrently. Our results first reveal that transient dopamine activates D1 and D2 receptors with efficacies in the same sub‐micromolar order of magnitude, with around a twofold difference only, thus challenging the notion of a large difference in dopamine efficacies between D1 and D2 receptors. Transient dopamine triggers ‘mirror’ cAMP transients in their respective neurons, but interestingly, D2 MSNs depart from this symmetry at the level of the phosphorylation state of targets controlled by PKA and phosphatases. This observation implies that the same input signal can be read out differently at different stages along a signalling pathway, which would represent a way for the system to detect the specific dynamic features of the neuromodulatory input signal. Computational simulations using these measured data further indicate that D2 MSNs, but not D1 MSNs, could also respond to the transient dips in dopamine level often associated with reward omission.
Methods
Animals and live brain slice preparation
C57Bl/6J mice were obtained from Janvier (Le Genest Saint Isle, France) and housed under standardized conditions with a 12 h light–dark cycle, stable temperature (22 ± 1°C), controlled humidity (55 ± 10%) and food and water ad libitum. Animals were kept in accordance with the UPMC University animal care committee's regulations. All the experiments were performed in accordance with the French Ministry of Agriculture and Forestry guidelines for handling animals (decree 87–848).
Brain slices were prepared from a total of 140 mice aged from 7 to 11 days. Mice were killed by decapitation and the brain was quickly removed. Coronal brain slices were cut with a VT1200S microtome (Leica). Slices were prepared in an ice‐cold solution of the following composition: 125 mm NaCl, 0.4 mm CaCl2, 1 mm MgCl2, 1.25 mm NaH2PO4, 26 mm NaHCO3, 5 mm sodium pyruvate, 20 mm glucose and 1 mm kynurenic acid, saturated with 5% CO2 and 95% O2. The slices were incubated in this solution for 30 min at room temperature and then placed on a Millicell‐CM membrane (Millipore) in culture medium (50% Minimum Essential Medium, 50% Hanks' Balanced Salt Solution, 6.5 g l−1 glucose, penicillin‐streptomycin, Invitrogen, San Diego, CA, USA). We used the Sindbis virus as a vector to induce expression of the biosensors after overnight incubation (Ehrengruber et al. 1999). The coding sequences of Epac‐SH150 (Polito et al. 2013) and AKAR3 (Allen & Zhang, 2006) were inserted into the viral vector pSinRep5 (Invitrogen). Viral particles (∼5 × 10⁵ particles per slice) were added and slices were incubated overnight at 35°C under an atmosphere containing 5% CO2. Before the experiment, slices were incubated for 30 min in the recording solution (125 mm NaCl, 2 mm CaCl2, 1 mm MgCl2, 1.25 mm NaH2PO4, 26 mm NaHCO3, 5 mm sodium pyruvate, 20 mm glucose, saturated with 5% CO2 and 95% O2). Recordings were performed with a continuous perfusion (2 ml.min−1) of the same solution, at 32°C, saturated with 5% CO2 and 95% O2. Except for the experiments shown in Fig. 6, all drugs were added in this continuous bath perfusion. Fast application of SCH23390 (Fig. 6) was performed using a rapid micro‐perfusion system, using a glass pipette to apply the drug locally over the imaging field as described earlier (Gervasi et al. 2007). This system has a delay of 1 s for the drug to reach the surface of the brain slice. The drug then diffuses through the slice to reach the imaged neurons within ∼10 s (Gervasi et al. 2007).
Figure 6. Dopamine remains in the brain slice for minutes after uncaging.
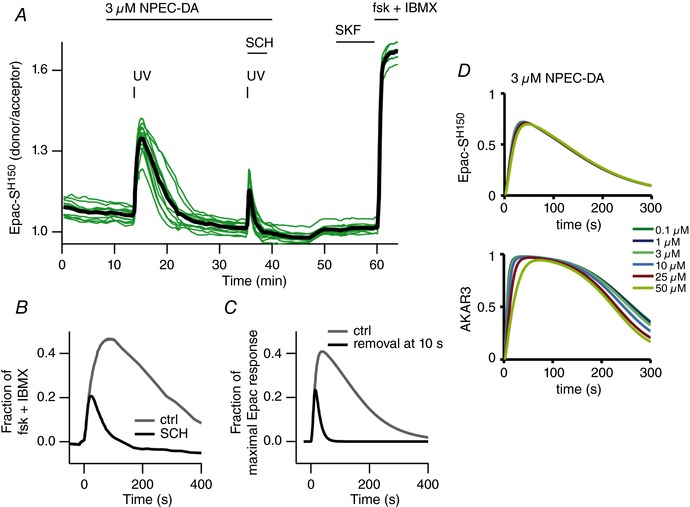
A, a brain slice expressing the Epac‐SH150 biosensor was imaged with wide‐field microscopy. A first uncaging of NPEC‐DA (3 μm) was performed to produce a control cAMP response in D1 MSNs. After recovery, a second similar uncaging was performed, while the D1 antagonist SCH‐23390 (SCH, 1 μm) was applied at the same time with a fast perfusion system. In the presence of SCH‐23390, the cAMP response appeared of smaller amplitude and duration. Subsequent application of SKF‐81297 (SKF, 100 nm) showed no effect because D1 receptors were still blocked by SCH‐23390. B, overlaid traces of the two uncaging episodes shown in A. In this experiment, while the effect of UV uncaging is instantaneous, diffusion of the antagonist from the surface of the slice to the in‐depth imaged neurons requires an additional diffusion time. SCH‐23390 was thus able to shorten the response to dopamine uncaging, indicating that dopamine is still activating D1 receptors minutes after having been released in the brain slice. C, the same experiment was simulated, with control uncaging and with dopamine being removed 10 s after release. D, biosensor concentration has little effect on response amplitude. Simulations using the D1 MSN model with different concentrations of the Epac‐SH150 or AKAR3 biosensors, and dopamine stimuli mimicking the dopamine uncaging experiment. The dopamine stimulus corresponds to an instantaneous increase in dopamine concentration to the indicated concentration with an exponential decay with a 90 s time constant (see Methods). Differences in logged responses became significant only for biosensor concentrations of 50 μm and above. [Color figure can be viewed at wileyonlinelibrary.com]
Since other endogenous neuromodulators might interfere with the response to dopamine, a cocktail of inhibitors was used throughout the uncaging experiments: tetrodotoxin to block electrical activity (200 nm); atropine, a muscarinic receptor antagonist (1 μm); CGP 55845A, a GABA‐B receptor antagonist (100 nm); AM 251, a CB‐1 receptor antagonist (100 nm); naloxone, an opioid receptor antagonist (500 nm).
Live brain slice imaging
Recordings were performed with 40 × 0.8 NA water‐immersion objectives. For two‐photon imaging, excitation was obtained using a Ti:sapphire laser (MaiTai HP; Spectra‐Physics, Mountain View, CA, USA) tuned at 850 nm for donor excitation. Galvanometric scanners (model 6210, Cambridge Technology, Cambridge, MA, USA) were used for raster scanning, and a piezo‐driven objective scanner (P‐721 PIFOC, Physik Instrumente GmbH) was used for Z‐Stack image acquisition. The system was controlled by MPscope software (Nguyen et al. 2006). The microscope was based on an Olympus BX51WI upright microscope. A two‐photon emission filter was used to reject residual excitation light (E700 SP, Chroma Technology, Brattleboro, VT, USA). A fluorescence cube containing 479/40 and 542/50 emission filters and a 506 nm dichroic beamsplitter (FF01‐479/40, FF01‐542/50 and FF506‐Di02‐25×36 Brightline Filters, Semrock, Rochester, NY, USA) was used for the orthogonal separation of the two fluorescence signals. Two imaging channels (H9305 photomultipliers, Hamamatsu) were used for simultaneous detection of the two types of fluorescence emission. For each data point, an image Z‐stack of 30–40 images with 0.5 μm interval was acquired. The frequency of data acquisition was approximately 1 pair of stacks every 30 s.
Wide‐field images were obtained with an Olympus BX50WI or BX51WI upright microscope and an ORCA‐AG camera (Hamamatsu). Images were acquired with iVision (Biovision, Exton, PA, USA). The excitation and dichroic filters were D436/20 and 455dcxt. Signals were acquired by alternating the emission filters, HQ480/40 for donor, and D535/40 for acceptor, with a filter wheel (Sutter Instruments, Novato, CA, USA). Filters were obtained from Chroma Technology (Brattleboro, VT, USA).
Photorelease of dopamine from NPEC‐DA was performed using high power 360 nm LED sources mounted on the epifluorescence port of the microscopes, providing 15 mW at the exit of the microscope objective (0.5 s flash duration) or 7.5 mW (1 s flash duration). The combination of LED sources at 360 nm (for uncaging) and 420 nm (for imaging) was purchased from Mightex (Toronto, Canada). The frequency of data acquisition, usually 1 image pair every 30–50 s, was increased to 1 pair every 5 s, starting 10 data points before dopamine uncaging.
The dorsomedial part of the striatum was identified with a 5× objective. In order to identify the neurons in the field of view, recordings in wide‐field microscopy were terminated by the acquisition of an image stack of 100 μm depth. MSNs were identified by their morphology in 3D image stacks: we rejected the few cells that didn't display an obvious neuronal morphology, smooth membrane contour and a soma diameter of less than 13 μm, thus excluding giant cholinergic interneurons. We further discarded very few cells which did not respond to either D1 or A2A stimulation.
Data analysis
The FRET change in the biosensor was quantified by ratiometric imaging: cAMP binding to Epac‐SH150 is associated with an increase in donor/acceptor ratio; PKA‐dependent phosphorylation is associated with an increase in acceptor/donor ratio (Polito et al. 2014). Images were analysed with custom routines written in the IGOR Pro environment (Wavemetrics, Lake Oswego, OR, USA). No correction for bleed‐through or direct excitation of the acceptor was applied, since this correction, while increasing the absolute amplitude of ratio changes, also increases the noise in the measurement and does not enhance measurement precision (Ducros et al. 2009). The emission ratio was calculated for each pixel: F 480/F 535 for Epac‐SH150 sensor, and F 535/F 480 for AKAR3 sensor. The pseudo‐colour images display the ratio value coded in hue and the fluorescence of the preparation coded in intensity.
Two‐photon imaging was used in some experiments for unambiguous separation and identification of D1 and D2 MSNs in the slice (Fig. 1). Ratio measurements were performed on a series of 5–10 consecutive images from the image stack, centred on the cell body. When visible, the nucleus was excluded from the measurement. Wide‐field imaging also allowed separation of D1 and D2 MSNs provided that the infection level was kept low, and fields without fluorescence overlap between neighbouring neurons were chosen. The optical cross‐contamination resulting from out of focus light was evaluated by the response to CGS 21680 and SKF‐81297: cells were rejected from analysis if the cross‐contamination was above 30%. Cells were also excluded from the analysis when basal ratio was elevated.
Figure 1. D1 and A2A/D2 responses are segregated in two main types of neurons in the dorsal striatum.
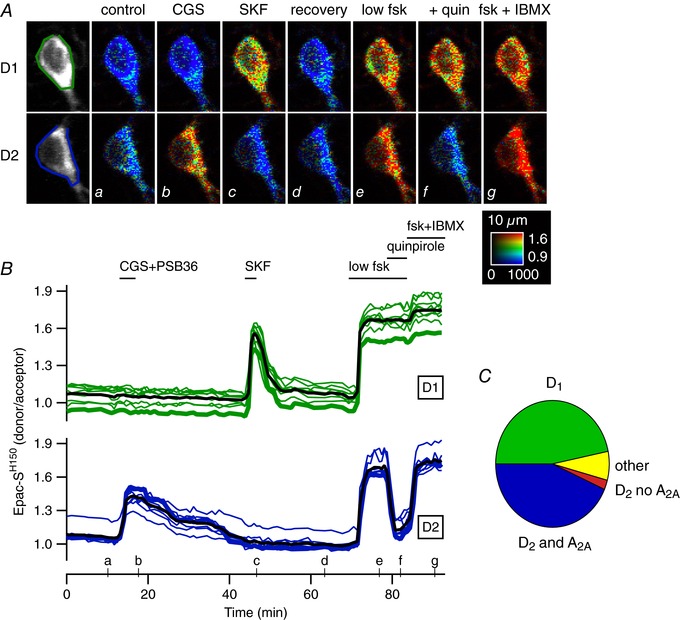
A, two representative D1 and D2 MSNs (out of 21) in a brain slice expressing the cAMP biosensor Epac‐SH150, imaged with two‐photon microscopy: raw fluorescence of the donor is displayed in grey and donor/acceptor fluorescence ratio is displayed in pseudo‐colour. Images a–g show the ratio corresponding to the time points indicated on the graph below in B. B, each trace indicates the emission ratio measured on the cell body of individual neurons. Traces are grouped on the basis of their similar response pattern. Thick traces correspond to the two cells illustrated in A. Black traces represent the average response. Bath application of the adenosine A2A agonist CGS 21680 (1 μm), in the presence of the antagonist of A1 receptors PSB36 (0.1 μm), revealed which MSNs express A2A receptors (blue traces). Bath application of SKF‐81297 (SKF, 100 nm) revealed MSNs which express D1‐like receptors (green traces). A low dose of forskolin (low fsk, 0.5 μm) increased cAMP in all MSNs. Addition of the D2‐like agonist quinpirole (1 μm) decreased cAMP in the neurons which also responded to A2A agonist. The final application of forskolin (to activate adenylyl cyclases, fsk, 13 μm) and IBMX (to inhibit phosphodiesterases, 200 μm) showed the maximal ratio response for each neuron. The calibration square indicates from left to right increasing intensity levels, from bottom to top increasing ratio values, i.e. increasing intracellular cAMP concentration. The size of the square is 10 μm. C, 205 neurons from 6 similar experiments sorted into 4 categories: neurons responding to SKF (D1 MSNs), neurons responding to both CGS and quinpirole (D2 MSNs; D2 and A2A), neurons responding only to quinpirole (D2 no A2A), and neurons responding to nothing except the final fsk+IBMX (others).
Responses obtained from MSNs of the same type were averaged for each experiment (i.e. brain slice).
Drugs
Salts to prepare the solutions were from Sigma‐Aldrich (St Quentin‐Fallavier, Isère, France). TTX was from Latoxan (Valence, France). Caged fluorescein (fluorescein bis‐(5‐carboxymethoxy‐2‐nitrobenzyl) ether, dipotassium salt) was from ThermoFisher. All other drugs were from Tocris Cookson (Bristol, UK). The stock solutions were prepared by dissolving the powders with either DMSO (dimethyl sulfoxide) or water. All stock solutions were stored at −20°C. NPEC‐DA was aliquoted in 5 μL samples and discarded at the end of the day. Solution containing NPEC‐DA was protected from ambient light.
Computational modelling
The biochemical signalling networks for both D1 and D2 MSN are modelled as a system of chemical reactions present in a single reaction compartment devoid of any geometry. The temporal evolution of individual chemical reaction is modelled as an
ordinary differential equation (ODE) using the chemical mass‐action equation, as:
If a reaction is irreversible, the reverse rate constant k r is set to 0. The enzymatic reactions (involving enzyme E, substrate S and product P) in the signalling cascade are modelled as a two‐step binding (reversible) and transformation (irreversible) reaction. The signalling networks are represented as a system of coupled ODEs. Simulations of these reaction systems are done using the ode15s solver available in the MATLAB Simbiology toolbox (MathWorks) with a maximum time step of 0.01 s. The description about the signalling processes that are represented as chemical reactions are presented below. The reaction‐kinetic models built in this study is publicly available at BioModels database (Chelliah et al. 2015) in SBML format which include all the modelled biochemical reactions and respective rate parameters (Model IDs: MODEL1701170000, MODEL1701170001).
Modelled signalling network
The modelled biochemical network for D1 MSNs includes the signalling processes triggered by the dopamine‐dependent activation of D1 receptor, which is coupled to Golf G‐protein. Activation of D1 receptor leads to the activation of Golf G‐protein. The kinetic parameters of the all the receptors and G‐protein activation that we used are constrained to obtain an activation time constant in the range of 50–100 ms as suggested by measurements in neurons (Chuhma et al. 2014; Marcott et al. 2014). Once activated, Golf binds to AC5. The duration of the AC5 activation due to Golf is dictated by the GTPase activity of the G‐protein, which acts as the deactivation mechanism of the G‐protein. The ligand–receptor interactions and the Golf–AC5 interactions are modelled as reversible binding reactions whereas the Golf activation and deactivation processes are modelled as single step irreversible reactions. The binding of Golf with AC5 leads to an elevation cAMP production. This increased rate of cAMP production is modelled by an increased k cat, without affecting K M, of ATP to cAMP conversion in the reactions involving Golf‐bound AC5 compared to only AC5. In the current preparation, cAMP changes are measured through Epac‐SH150 sensor. Thus, Epac‐SH150 has also been included in the model to assist the optimization of cAMP‐related kinetic parameters. The cAMP binding parameters of Epac‐SH150 were constrained using the known dose‐dependent relation between cAMP and Epac‐SH150 (Polito et al. 2013). Since PDE10 is the most expressed PDE variant in the striatum (Kelly et al. 2014), it is the only PDE included in the model. The kinetic rate parameters of PDE10 were selected to match the time course of the Epac‐SH150 signal observed in the current dataset. cAMP further activates PKA and this PKA activation is modelled as a two‐step sequential binding reaction between cAMP and PKA holoenzyme, followed by a single step dissociation between the regulatory and catalytic subunit. The parameters for these and dissociation reactions are constrained by the known dose‐dependent relation between cAMP and PKA (Dostmann & Taylor, 1991). PKA activation also leads to AKAR3 phosphorylation in our model. We refined the PKA activation and the PKA‐dependent AKAR3 phosphorylation parameters to reproduce the time course and dose response of AKAR3 signal observed in the dataset presented here. The parameters are further constrained by the previously observed AKAR activation/deactivation kinetics in response to transient dopamine stimulation (Yagishita et al. 2014).
The catalytic subunit of PKA also phosphorylates the Thr‐34 residue of DARPP‐32 and the phosphorylated Thr‐34 binds to PP1 with high affinity (Huang et al. 1999). This residue is dephosphorylated strongly by PP2B and there also appears to be some contribution of PP2A (Nishi et al. 2002; Ahn et al. 2007b). However, the quantitative difference in the contribution between these different dephosphorylating forces is not clear. Thus, in our model, for simplicity, we assume that all the dephosphorylation of Thr‐34 residue is carried by a single pool of PP2B. It is also assumed that this pool of PP2B directly acts on phosphorylated Thr‐34 species which is in free state and not bound to PP1. The PP2B‐dependent dephosphorylation parameters are adjusted to reproduce previously published changes in Thr‐34 levels upon PP2B stimulation (Nishi et al. 2002, 2005). The DARPP‐32 signalling network module also contains phosphorylation and dephosphorylation of Thr‐75 residue by CDK5 and PP2A, respectively (Bibb et al. 1999; Ahn et al. 2007a,b).
The modelled signalling network for D2 MSN has the same signalling core (from AC5 upstream to DARPP‐32 downstream) as the D1 network. The main differences between D2 and D1 models are at the level of receptors and G‐proteins: the D2 signalling network includes A2A and D2 receptors coupled to Golf and Gi/o G‐proteins, respectively. The receptor and G‐protein activation kinetics used are similar to the ones of the D1 model. As mentioned above, the deactivation kinetics of G‐protein is dictated by the GTPase activity of the G‐proteins. The deactivation kinetics of Golf in the D2 computational model is the same as the value used in the D1 model. However, the deactivation of Gi/o is assumed to be around ten times faster than the Golf value. This is based on the observation that striatal neurons are enriched with RGS proteins, which enhance the GTPase rate of Gi/o proteins (Gold et al. 1997). Similar to the D1 model, the active Golf due to ligand‐bound A2A receptor binds to AC5 thereby increasing the rate of cAMP production. In addition, the ligand–receptor interaction for A2A receptor and the Golf–AC5 interactions are modelled as reversible binding reactions whereas the Golf activation and deactivation processes are modelled as single step irreversible reactions. The increased cAMP production for Golf–AC5 is modelled by increasing the k cat, without affecting K M, of ATP to cAMP conversion in the reactions involving Golf‐bound AC5 compared to only AC5. On the other hand, the activation of D2 receptor leads to the activation of Gi/o. The active Gi/o binds to AC5 and the Gi/o–AC5 complex has a reduced rate of cAMP production, modelled by decreasing the k cat, without affecting K M, of ATP to cAMP conversion in the reactions involving Gi/o‐bound AC5 compared to only AC5. Since the core signalling network is the same between the two models, the biochemical reactions and respective kinetic rate parameters are also the same, except that of receptor activation–deactivation cycle. The A2A and D2 receptor‐related rate parameters and the initial amounts of receptors and G‐proteins have been constrained to reproduce the Epac‐SH150 and AKAR3 time course and dose response observed for D2 MSNs in our experiments upon dopamine uncaging. Apart from the receptor/G‐protein parameters, there are also a differences in the amounts of PP1, PP2B and PP2A between the two models. The levels of these phosphatases are lower in the D2 model compared to the D1 model, to account for the D2 neuron‐specific DARPP‐32 observation (Bateup et al. 2008).
Model inputs
The main input to both models is dopamine. There are three kinds of dopamine inputs considered in this study:
Dopamine peak
These inputs represent the temporary and time‐varying elevation of the extracellular dopamine concentration.
-
(i)
Simulated dopamine uncaging. This input simulates the dopamine elevation produced in our dopamine uncaging experimental protocol. It is modelled as an instantaneous increase in dopamine concentration to a given amplitude (representing the fast action of UV pulse on NPEC‐DA) followed by an exponential decay (representing the clearance of uncaged dopamine). The time constant of the exponential decay is ∼90 s, which closely reproduces the time course of Epac‐SH150 and AKAR3 time course for both D1 and D2 models. This input is mainly used in the process of model fitting.
-
(ii)
Brief dopamine peak. This represents a brief transient change in dopamine concentration, in the order of a few seconds. It is modelled as a positive rectangular pulse with a given amplitude for a given pulse duration. The basal dopamine level used outside the pulse duration is zero.
Dopamine dip
This input represents the transient decrease in the extracellular dopamine concentration with respect to a given basal level. It is modelled as a negative rectangular pulse with the dopamine concentration set to zero during the duration of the pulse. The dopamine concentration outside the pulse is given a constant basal level.
Results
Segregated D1 and A2A/D2 responses in the dorsomedial striatum
D1‐like and D2‐like dopamine receptors are oppositely coupled to the cAMP–PKA signalling cascade. Here, we imaged the fluorescence of the Epac‐SH150 biosensor with a two‐photon microscope to observe, in real time, how the activation of D1‐ and D2‐like dopamine receptor subtypes affected intracellular cAMP levels in mouse MSNs (Fig. 1).
First, bath application of the A2A receptor agonist CGS 21680 (CGS, 1 μm) increased intracellular cAMP in about half of the MSNs present in the field of view, revealing the A2A positive neurons (Fig. 1 A and B). Since CGS 21680 is also an agonist of adenosine A1 receptor (Klotz et al. 1999; Gao et al. 2004), which is expressed in the striatum, all applications of CGS 21680 were performed in the presence of the A1 receptor antagonist PSB36 (100 nm). After the washout of the agonist and recovery of the cAMP level to baseline, bath application of the D1 receptor agonist SKF‐81297 (SKF, 100 nm) increased cAMP signal in the other half of the MSNs present in the field of view, the D1 MSNs. Finally, the functional presence of the D2 receptors was revealed by first increasing cAMP production in all neurons with a low dose of the adenylyl cyclase activator forskolin (0.5 μm), followed by the application of the D2 receptor agonist quinpirole (1 μm): quinpirole reverted the forskolin response in the MSNs which responded to A2A receptor agonist CGS 21680; in contrast, D1 MSNs showed no response to quinpirole (Fig. 1 A and B).
Out of 205 neurons in total, from six independent experiments (18 to 56 neurons per experiment), none of the tested neurons responded to the activation of both D1 and D2 receptors. Ninety‐six neurons responded to the activation of D1 receptor only (hereafter called D1 MSNs) and 89 neurons responded to the activation of both A2A and D2 receptors (hereafter called D2 MSNs). Five neurons responded to D2 receptor activation but failed to respond to A2A receptor activation. Fifteen neurons, among which a few were putative aspiny cholinergic interneurons, responded to none of the drugs except to fsk and IBMX (Fig. 1 C). Our experiments are thus in agreement with previous studies (Bertran‐Gonzalez et al. 2008; Valjent et al. 2009), showing that, in the dorsal striatum, D1 and D2 receptors are segregated in two subpopulations of MSNs, with D2 being co‐expressed with A2A receptors.
Dopamine uncaging triggers transient and opposite cAMP signal changes in D1 and D2 MSNs
Phasic release of dopamine in the striatum is commonly assumed to occur after a burst of action potentials in dopaminergic neurons, in response to a reward event (Schultz, 2010). Here, we increased the temporal resolution of our recordings using wide‐field microscopy and triggered dopamine release by photolysis of NPEC‐DA ‘caged’ dopamine) with a flash of UV light in the brain slice. The cellular responses to uncaging were monitored in D1 and D2 MSNs with the cAMP biosensor Epac‐SH150 (Fig. 2). A first uncaging event (1 μm NPEC‐DA) increased the cAMP signal in approximately half of the MSNs, consistent with the activation of the D1 receptors in D1 MSNs (Fig. 2). In the absence of NPEC‐DA, the flash of UV light triggered minimal changes in the biosensor signal. Since D2 receptors are negatively coupled to cAMP production, intracellular cAMP levels were then increased selectively in D2 MSNs by applying A2A receptor agonist CGS 21680 (CGS, 1 μm) in the presence of the A1 antagonist PSB36 (100 nm). Once a steady‐state cAMP level was reached in D2 MSNs, the effect of dopamine uncaging could be monitored simultaneously in D1 and D2 MSNs, in the form of transient cAMP responses of opposite directions, i.e. peaks in the D1 MSNs and troughs in the D2 MSNs (Fig. 2 B and C). This second dopamine uncaging in the presence of CGS 21680 was used to quantify the dopamine effect on D1 and D2 MSNs. SKF‐81297 (SKF, 100 nm) was used to elicit the maximal D1‐dependent biosensor signal to serve as the reference for normalizing the D1 response (Fig. 2 C). The amplitude of the A2A response to CGS 21680 was used as the reference for normalizing the D2 response (Fig. 2 C).
Figure 2. Transient dopamine induces positive and negative cAMP responses in D1 and D2 MSNs, respectively.
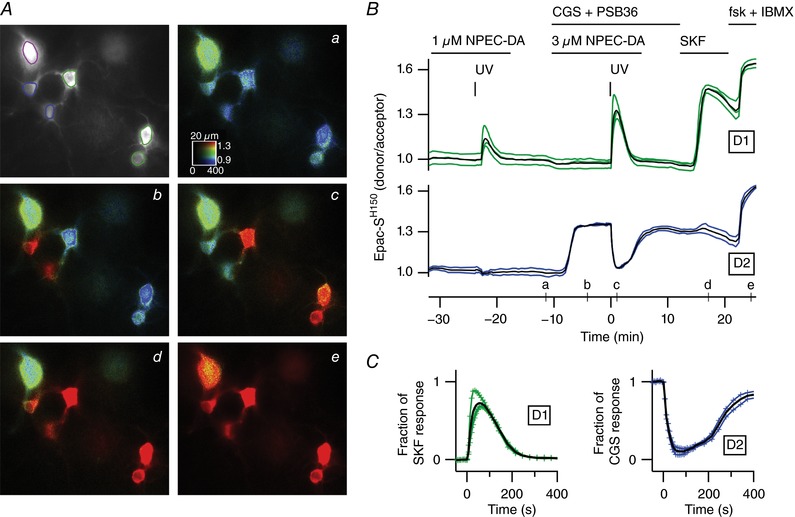
A, wide‐field imaging of the cAMP biosensor Epac‐SH150 in the dorsal striatum. Raw fluorescence of the donor is displayed in grey and donor/acceptor fluorescence ratio is displayed in pseudo‐colour. Images a–e show the ratio corresponding to the time points indicated on the graph in B. The large neuron (purple contour, top left) is a putative giant cholinergic interneuron. B, dopamine released from NPEC‐DA (1 μm) by UV uncaging generated a transient positive response in the D1 MSNs (green traces), and no effect on basal cAMP levels in D2 MSNs (blue traces). During the steady‐state response to the A2A receptor agonist CGS 21680 (CGS, 1 μm) in D2 MSNs, uncaging (test dose of 3 μm NPEC‐DA) generated a second transient increase in the D1 MSNs, and a trough in the D2 MSNs. The D1 receptor agonist SKF‐81297 (SKF, 100 nm) was applied at the end of the experiment to determine the maximal D1 response. The final application of forskolin (fsk, 13 μm) and IBMX (200 μm) revealed the saturating ratio level for each neuron. The A1 receptor antagonist PSB36 (100 nm) was applied together with CGS 21680. C, the traces of these individual cells and their average ratio responses in the D1 or D2 MSNs are normalized with respect to the maximal D1 and A2A responses produced by SKF‐81297 or CGS 21680, respectively. Black traces in B and C represent the averages.
To test for protocol reproducibility within an experiment, dopamine uncaging was repeated several times in the same experiment, producing responses of similar amplitudes and time courses. The extent of dopamine uncaging from NPEC‐DA was checked by uncaging 1 μm NPEC‐DA with increasing UV power: D1 responses reached a saturation between 7.5 and 15 mJ; a power of 7.5 mW UV was used throughout this manuscript. The involvement of D1‐like and D2‐like receptors was verified pharmacologically. When dopamine was uncaged in the presence of the D1‐like receptors antagonist SCH‐23390 (1 μm), the cAMP response in D1 MSNs was suppressed whereas the D2 MSNs responded normally. Similarly, the inhibition of D2‐like receptors with the antipsychotic drug haloperidol (100 nm) abolished the trough in cAMP level that followed dopamine uncaging in D2 MSNs, while the D1 peaks in D1 MSNs remained unchanged. Inhibition of monoamine re‐uptake with GBR‐12783 (1 μm) and desipramine (1 μm) had no effect on baseline cAMP level nor on responses to transient dopamine.
Dopamine transients activate D1 and D2 receptors with similar efficacies
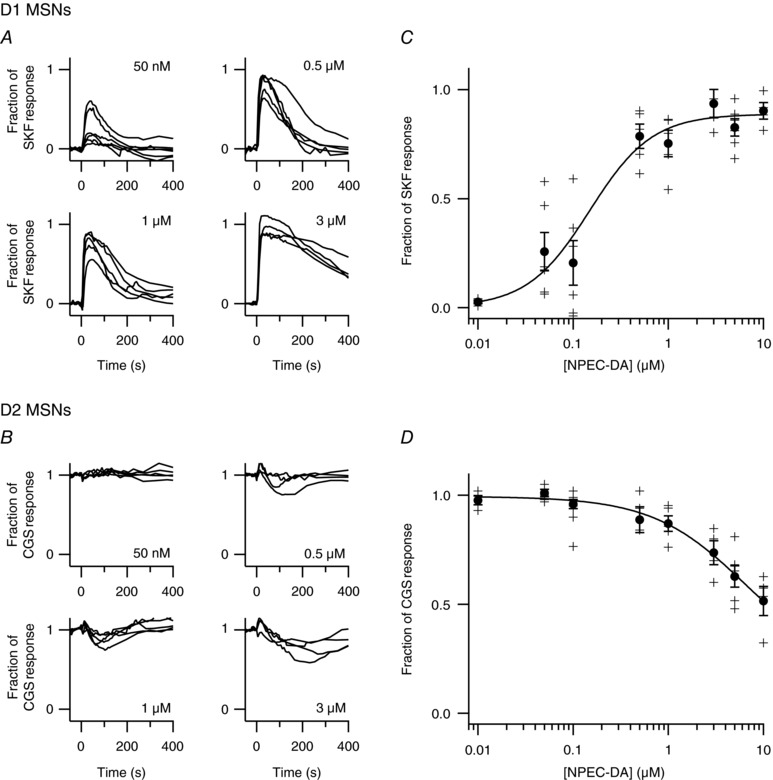
We then used uncaging to test the dose dependency of dopamine on the cAMP response in D1 and D2 MSNs. As in Fig. 2, our protocol included a first uncaging with 1 μm NPEC‐DA to reveal D1 MSNs, a recovery period of more than 10 min and a second uncaging with the tested dose of NPEC‐DA. A single dose was tested in each experiment. The traces of all MSNs of a same type were averaged. In D1 MSNs (Fig. 3 A), the peak amplitude was quantified as a fraction of the response to SKF‐81297 (SKF, 100 nm); in D2 MSNs (Fig. 3 B), the negative cAMP response was quantified as a fraction of the steady‐state level elicited by the A2A receptor agonist CGS 21680 (CGS, 1 μm) measured before dopamine uncaging. These values were used to build the dose–response curves, with at least 5 independent experiments for each dose. In D1 MSNs, the D1 cAMP dose–response relationship was fitted to a Hill equation with an EC50 of 0.68 μm and Hill coefficient of 1.5 (Fig. 3 C). The curve reached a plateau at 80% of the SKF response indicating that transient dopamine stimulation does not elicit maximal activation of the D1 receptor. In D2 MSNs, the cAMP dose–response relationship was fitted to a Hill equation with an EC50 of 0.39 μm and Hill coefficient of 1.2 (Fig. 3 D).
Figure 3. Transient dopamine regulates cAMP in D1 and D2 MSNs in a dose‐dependent manner.
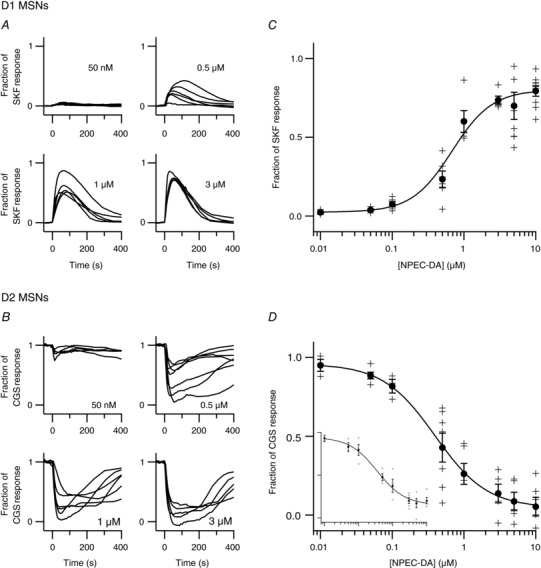
The experiment presented in Fig. 2 was repeated with different doses of NPEC‐DA (a single dose per experiment) in brain slices expressing the Epac‐SH150 biosensor. Each trace represents the average response to dopamine uncaging for D1 MSNs (A) or D2 MSNs (B) in one brain slice. C, for D1 MSNs, the amplitude of the cAMP responses was normalized with respect to the response to SKF‐81297 (100 nm); EC50 was 0.68 μm. D, for D2 MSNs, responses were normalized to the level reached with CGS 21680 (1 μm) before uncaging; EC50 was 0.39 μm. Inset (same units), a similar dose–response analysis was performed except that a low concentration of forskolin (63 nm) was used to increase cAMP to a steady‐state level in D2 MSNs; EC50 was 0.35 μm.
It was previously demonstrated that the binding of agonists or antagonists onto A2A receptors decreases the affinity of D2 receptors for dopamine through heterodimer interactions (Ferré et al. 1991, 2008; Vidi et al. 2008; Bonaventura et al. 2015), and we investigated whether this interaction affected dopamine efficacy in our conditions. Therefore, instead of stimulating A2A receptors, we used a low concentration of forskolin (63 nm) to increase cAMP to a steady‐state level that roughly matched the level obtained with A2A receptor stimulation. Dopamine uncaging transiently decreased forskolin‐induced steady‐state cAMP levels. The depth of this cAMP trough was expressed as a fraction of the response to low forskolin. The dose–response relationship obtained with low forskolin was similar to that obtained with CGS (EC50 of 0.35 μm and Hill coefficient of 1.0; Fig. 3 D inset). This suggests that our measurement of dopamine efficacy is independent of the A2A–D2 interaction. However, the maximal D2 effect of transient dopamine only reached ∼0.80 with low forskolin vs. ∼1.0 with A2A agonist, suggesting that a fraction of the adenylyl cyclases activated by forskolin remain out of reach for Gi/o proteins.
Downstream effect of dopamine uncaging, measured at the level of PKA‐dependent phosphorylation
Downstream of cAMP, we measured the efficacy of transient dopamine in affecting PKA‐dependent phosphorylation with the same protocol as Fig. 2, except that the measurements were carried out with AKAR3 biosensor (Fig. 4). The AKAR3 biosensor is a PKA substrate, and, upon phosphorylation, a conformational change of the protein results in an increased FRET between donor and acceptor. This change is reversible upon dephosphorylation by phosphatases like PP1.
Figure 4. Effect of transient dopamine on PKA‐dependent phosphorylation in D1 and D2 MSNs.
Similar experiments as in Fig. 3 were performed with the PKA biosensor AKAR3. Each trace represents the average response to dopamine uncaging for D1 MSNs (A) or D2 MSNs (B) in one brain slice. For D1 MSNs, AKAR3 responses were normalized with respect to the response to SKF‐81297 (100 nm); for D2 MSNs, responses were normalized to the level reached with CGS 21680 (1 μm) before uncaging. The maximal value of the transient AKAR3 response was used to build a dose–response curve for D1 MSNs (C) and D2 MSNs (D). Fitting the data to a Hill equation gives an EC50 of 0.15 μm for D1 MSNs.
In D1 MSNs, increasing doses of NPEC‐DA led to transient AKAR3 responses of increasing magnitude (Fig. 4 A). The dose–response relationship was fitted to a Hill equation with an EC50 of 0.15 μm and a Hill coefficient of 1.3. This lower EC50 of dopamine on the biosensor AKAR3 compared to Epac‐SH150 is consistent with PKA having a higher sensitivity for cAMP than Epac (Dostmann & Taylor, 1991; Bos, 2003). Indeed, the higher sensitivity of the AKAR3 biosensor compared to Epac‐based biosensors has already been reported (Castro et al. 2010, 2013; Polito et al. 2013) and fits with the observation that 100 nm SKF‐81297 increases the AKAR3 signal to its maximal level, which is not found with Epac‐SH150. In D2 MSNs, the depth of the dopamine‐induced troughs in PKA‐dependent phosphorylation levels were modest, even at micromolar doses of NPEC‐DA (Fig. 4 B), revealing a profound imbalance between D1 and D2 MSNs in their integration of a same dopamine transient. For example, a 0.5 μm dose of NPEC‐DA triggered a maximal peak response in D1 MSNs, whereas in D2 cells the CGS‐induced steady‐state was reduced by only 10%. These results show that transient dopamine is highly potent in increasing PKA‐dependent phosphorylation in D1 MSNs, whereas in D2 MSNs, dopamine transients are much less efficient, despite the strong decrease in cAMP signal.
Experimentally constrained cAMP–PKA signalling models for D1 and D2 MSNs
The duration of D1‐dependent AKAR response in our experiments is longer than what has been previously reported (Yagishita et al. 2014), which suggested that dopamine released by uncaging in our preparation might stay in the slice for tens of seconds, whereas phasic dopamine measured in response to burst firing of dopamine neurons, as observed in reward‐learning paradigms, lasts for only a few seconds (Day et al. 2007). Thus, we wanted to explore with in silico simulations the cAMP–PKA response produced by dopamine inputs lasting a few seconds. To this end, we developed two separate experimentally constrained mass‐action reaction‐kinetic models of the dopamine‐triggered signalling network in D1 and D2 MSNs (see Methods).
The modelled biochemical network for D1 MSNs includes the signalling processes triggered by the activation of D1 receptor (Fig. 5 A). D1 receptor activates AC5, which then leads to an increase in cAMP and PKA activation (Fig. 5 A). The modelled network includes the PKA‐dependent phosphorylation of DARPP‐32, which turns DARPP‐32 into a potent PP1 inhibitor. The network also includes PDE10 as a cAMP sink, and other DARPP‐32‐related phosphorylation and dephosphorylation reactions (Fig. 5 A). All these different interactions in the signalling network are represented as sets of biochemical reactions, and each biochemical reaction is modelled as an ordinary differential equation governed by mass‐action kinetics (see Methods). The parameters in the model are the kinetic rate constants for individual reactions. This biochemical reaction model is a recalibrated version of a previously published signalling model (Nair et al. 2015). The networks also include Epac‐SH150 and AKAR3 biosensors in order to constrain various kinetic parameters using the observed Epac‐SH150 and AKAR3 responses in the dopamine uncaging experiments. As the objective of including Epac‐SH150 was to constrain the kinetic parameters using our biosensor measurements, it was only used during the model building process and not included in subsequent simulation experiments. On the other hand, along with constraining the model parameters, inclusion of AKAR3 in the network also served as a representative PKA substrate.
Figure 5. Modelled D1 and D2 MSN signalling network and fitting to experimental data.
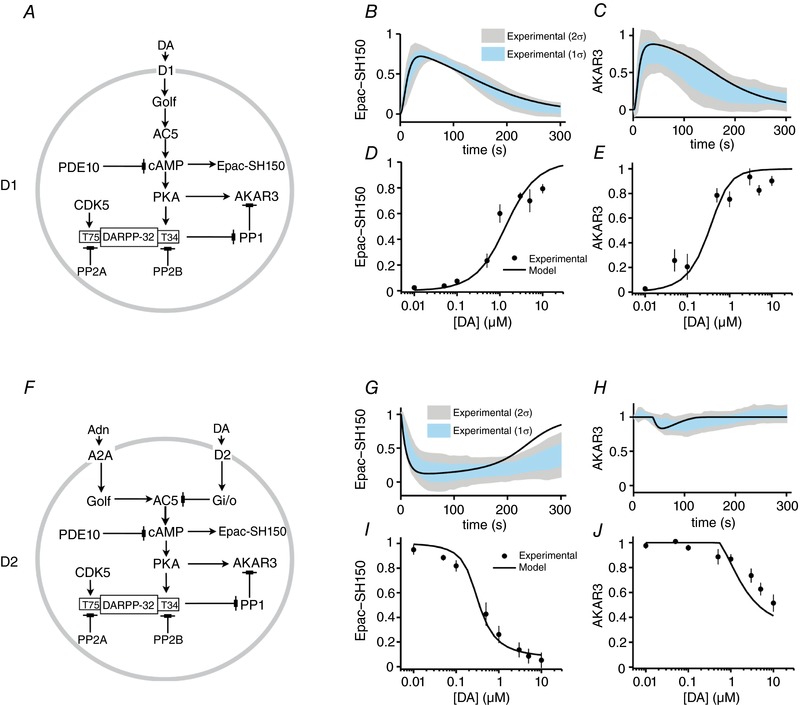
A, modelled signalling network for dopamine‐dependent signalling in D1 MSN. B and C, comparison of D1 MSN model simulation and measured response at the level of Epac‐SH150 in response to uncaging of 3 μm dopamine (B) and at the level of AKAR3 phosphorylation in response to uncaging of 1 μm dopamine (C). The shaded regions indicate the first and second standard deviations of the measured responses. Dopamine uncaging is simulated using an instantaneous increase in DA concentration to a given amplitude followed by an exponential decay (see Methods). D and E, comparison of the simulated and measured Epac‐SH150 (D) and AKAR3 (E) responses with varying concentrations of uncaged dopamine. F, modelled signalling network for dopamine‐dependent signalling in D2 MSN. The signalling core is the same as in D1 model except for the receptors. G and H, comparison of D2 model simulation and measured response at the level of Epac‐SH150 in response to uncaging of 3 μm dopamine (G) and at the level of AKAR3 phosphorylation in response to uncaging of 1 μm dopamine (H). I and J, comparison of dopamine dose‐dependent response between D2 model simulations and measurement at the level of Epac‐SH150 (I) and AKAR3 (J). [Color figure can be viewed at wileyonlinelibrary.com]
The basal cAMP levels in MSNs have been previously estimated around 30–100 nm (Polito et al. 2015). Thus, we first constrained the AC5 and PDE10 parameters such that the basal cAMP level was in this range. In addition, the reaction parameters related to cAMP production and degradation, along with the receptor and G‐protein activation–inactivation cycle, were also constrained to produce cAMP responses similar to those observed experimentally when recording Epac‐SH150 signal in response to 3 μm dopamine uncaging (Fig. 5 B). Downstream of cAMP, the PKA activation parameters were constrained using previously published cAMP dose‐dependent activation of the PKA subunit RIIβ (Dostmann & Taylor, 1991) and further refined taking in consideration the phosphorylation (PKA) and dephosphorylation (PP1) parameters of the AKAR3 response to 1 μm dopamine uncaging (Fig. 5 C). The AKAR3 phosphorylation/dephosphorylation kinetic was also constrained by known dynamics of striatal AKAR response produced by transient dopaminergic stimulation (Yagishita et al. 2014). The D1 receptor binding parameters were then further constrained to match the model output with the observed dose–response for dopamine uncaging on Epac‐SH150 response (Fig. 5 D) and AKAR3 phosphorylation (Fig. 5 E).
Since DARPP‐32 plays an important role in transient dopamine response in D1 MSNs at the level of the PKA:PP1 equilibrium (Castro et al. 2013), it was also included in the model downstream to PKA (Fig. 5 A). PKA phosphorylates DARPP‐32 at Thr‐34, which turns DARPP‐32 into a potent inhibitor of PP1 (Hemmings et al. 1984). DARPP‐32 is also phosphorylated at Thr‐75 by CDK5 (Bibb et al. 1999). As in previous modelling studies (Nair et al. 2015, 2016), the phosphorylation and dephosphorylation reactions at these two residues were constrained using the estimated basal (Nishi et al. 1997; Bibb et al. 1999; Bateup et al. 2008) and stimulated (Nishi et al. 2000; Bateup et al. 2008) levels of phosphorylated residues.
The reaction‐kinetic model for D2 MSNs was built by modifying the D1 model because the core signalling modules are identical except for the receptors (Fig. 5 F). Thus, we used the same biochemical reactions and respective kinetic rate parameters in the common signalling core of the two models. The parameters related to A2A and D2 receptors were constrained to reproduce the observed dynamics of Epac‐SH150 (Fig. 5 G) and AKAR3 (Fig. 5 H) signals produced by dopamine uncaging. The model also reproduces the dopamine uncaging dose‐dependent response of Epac‐SH150 (Fig. 5 I) and AKAR3 (Fig. 5 J).
It has been previously indicated that the basal level of phospho‐Thr‐34 DARPP‐32 is higher in D2 MSNs than in D1 MSNs (Nishi et al. 1997; Bateup et al. 2008; Polito et al. 2015). Since we have assumed the kinetic parameters for all biochemical reactions to be identical in D1 and D2 models, we accommodated this higher basal level of phospho‐Thr‐34 in the D2 model by decreasing the amount of PP2B to half the amount used in the D1 model. This reduces the efficacy of Thr‐34 dephosphorylation in the D2 model compared to the D1 model. This reduced dephosphorylation efficacy aligns well with previously published observations regarding the imbalance in the DARPP‐32 phosphorylation (Nishi et al. 2008) or DARPP‐32‐mediated PP1 inhibition between D1 and D2 MSNs (Polito et al. 2015). The modelled D2 signalling network also reproduces the previously published observation on the effect of D2 receptor saturation upon DARPP‐32 phosphorylation (Bateup et al. 2008).
In order to constrain the model parameters using our Epac‐SH150 and AKAR3 time series and dose response data, we had to assume that dopamine uncaging resulted in an instantaneous increase in dopamine which subsequently decayed exponentially with a time constant of ∼90 s. This suggested that dopamine remained available to act on receptors for some time after uncaging. We experimentally tested dopamine clearance using a fast microperfusion system to apply the D1‐like receptor antagonist SCH‐23390 (1 μm) simultaneously with uncaging: while dopamine uncaging triggers an immediate release of dopamine in the brain slice, the diffusion of the antagonist from the surface to the depth of the brain slice where neurons are imaged takes at least 10 s (Nicholson, 2005; Gervasi et al. 2007). Compared to the first control D1 response, SCH‐23390 strongly reduced the duration of the second response, stopping it before it reached its peak (Fig. 6 A and B). The model output matches the measurements quite well (Fig. 6 C), which supports our assumption regarding the slow clearance of uncaged dopamine, and indicates that the clearance rate used in the model building process is close to the actual rate in brain slices. Furthermore, diffusion out of the uncaging volume was tested by monitoring the decay of fluorescein fluorescence in a brain slice after its release from caged fluorescein in the same experimental conditions as for our dopamine uncaging experiments. Fluorescein fluorescence decayed with a time constant of 109 s, consistent with the value obtained for dopamine during the model fitting. Together with the lack of effect of dopamine re‐uptake inhibitors, these data show that the decay of uncaged dopamine in young brain slices is mainly driven by diffusion out of the imaging volume and therefore slower than in other preparations (Lee et al. 2002).
One concern while using biosensors is that a high amount of biosensor could introduce buffering effects and readout artefacts. We simulated whether different concentrations of Epac‐SH150 or AKAR3 resulted in consistent responses to uncaging protocols using the D1 and D2 models. The simulations indicated that the biosensor responses are robust in a wide range of biosensor concentrations (Fig. 6 D).
D1 and D2 model simulation with brief dopamine durations
We used the experimentally constrained D1 and D2 signalling network models to explore the effects of brief dopamine pulses resulting from phasic activity in dopaminergic neurons on cAMP–PKA signalling in MSNs (Fig. 7). A tonic A2A activity was included for the simulations of the D2 network in order to observe the D2 receptor‐dependent effect on cAMP. We set the tonic A2A activity to produce ∼50% of the maximum A2A receptor‐induced cAMP elevation. All D2 model simulations for the rest of the study were done with this tonic A2A activity. Both models were simulated with a dopamine signal of rectangular shape with varying durations and amplitudes, and the effect was inspected in D1 and D2 MSNs at the level of intracellular cAMP (Fig. 7 A and D), PKA activation (Fig. 7 B and E) and PKA/phosphatase substrate (AKAR, in this case) phosphorylation level (Fig. 7 C and F). As expected, transient dopamine inputs in D1 MSNs produced an increase in free intracellular cAMP through the activation of D1 receptors. However, for dopamine amplitudes lower than 1 μm, this increase in free cAMP was negligible compared to that produced by saturating D1 receptors (Fig. 7 A). Larger cAMP responses were obtained in the micromolar range and these responses also depended on the duration of the transient input (Fig. 7 A). In contrast, D2 signalling system appeared to be more sensitive to brief dopamine transients (Fig. 7 D). The cAMP levels decreased in response to transient dopamine inputs in the D2 model simulations, due to transient activation of the D2 receptors. Unlike the D1 model, even a brief dopamine input with a sub‐micromolar amplitude (around 0.2 μm) produced a large decrease in cAMP in the D2 model simulations (Fig. 7 D). Moreover, the relation between dopamine amplitude and cAMP decrease appears to be quite steep: while a dopamine transient of 0.1 μm produced negligible decrease in cAMP, a transient of 0.5 μm could reduce the cAMP level down to its minimum possible level (Fig. 7 D). This is unlike the simulation output for the D1 model where the relation between dopamine amplitude and cAMP effect was more gradual (Fig. 7 A). Moreover, the cAMP responses in the D2 model simulations appeared to be largely insensitive to the duration of the transient dopamine input, the effect being similar for all transients of 1 s duration and more (Fig. 7 D).
Figure 7. Simulations of D1 and D2 MSN models with brief dopamine transients.
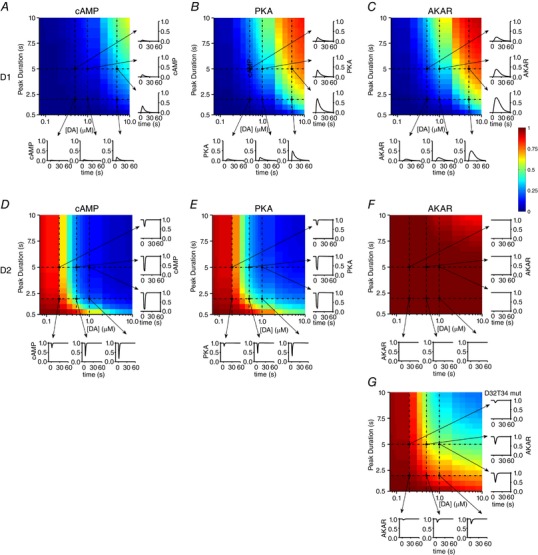
Responses at the level of cAMP (A), PKA (B) and AKAR (C) for the D1 MSN model simulations with different amplitude and duration of dopamine input. Each heat map represents the maximal value of the response produced by dopamine input of the indicated amplitude and duration. Colours correspond to the shown colour bar. The response values are normalized between 0 and 1, where 0 corresponds to the response in absence of any receptor stimulation and 1 corresponds to the response produced by saturating activation of D1 receptor. The traces show the time course of the responses for selected dopamine input levels (0.5 μm, 1.0 μm and 5.0 μm) and durations (2 s and 5 s). Responses at the level of cAMP (D), PKA (E) and AKAR (F) for the D2 MSN model simulations with different amplitude and duration of dopamine input. G, same as F, except that DARPP‐32 bears a Thr34 lack‐of‐function mutation. The heat map represents the minimal value of the response produced by dopamine input. The response values are normalized between 0 and 1, where 0 corresponds to the response in absence of any receptor stimulation and 1 corresponds to the response produced by the activation of ∼50% of A2A receptor. The traces show the time course of the response for selected dopamine input level (0.2 μm, 0.5 μm and 1.0 μm) and duration (2 s and 5 s).
The response at the level of PKA activation closely followed the pattern observed for cAMP response in both D1 and D2 models (Fig. 7 B and E). However, in the D1 model, the relation between the amplitude of transient dopamine input and level of normalized PKA activation was left‐shifted compared to normalized cAMP levels (compare Fig. 7 A and B). Similarly, the relation between the duration of transient dopamine and PKA appeared to be down‐shifted compared to cAMP activation. Thus, in D1 MSNs, dopamine transients in the lower micromolar range and with short duration could produce significant PKA activation even though the level of cAMP, compared to maximum possible level, may be modest. In the D2 model, the relation between dopamine amplitude and PKA activation is less steep than its cAMP counterpart (compare Fig. 7 D and E).
Downstream of PKA activity, we also looked at how the level of AKAR phosphorylation responded to brief dopamine transients. We considered AKAR as a proxy for general PKA and phosphatase substrate. The response at the level of AKAR phosphorylation for the D1 model closely followed the PKA activation response, suggesting that brief dopamine transients of micromolar amplitude could produce a significant phosphorylation of PKA substrates (Fig. 7 C). However, for the D2 model, there was an unexpected divergence between responses at PKA and AKAR level. There was no significant effect of transient dopamine input on AKAR phosphorylation, even for high dopamine amplitudes and long durations (Fig. 7 F), contrary to the PKA response upstream of AKAR which is sensitive to even sub‐micromolar dopamine levels (compare Fig. 7 F with E).
Since active PKA itself appears to be quite responsive in D2 model simulations (Fig. 7 E), a possible reason for the counter‐intuitive AKAR response could be the inhibition of PP1 mediated by PKA‐dependent DARPP‐32 phosphorylation at Thr‐34, as already described with biosensor imaging (Castro et al. 2013; Polito et al. 2015). Therefore, we assessed the role of DARPP‐32‐mediated PP1 inhibition on the AKAR response of D2 MSNs using a D2 model variant (D32T34 mut) in which the PP1 inhibition by the Thr‐34 was turned off. The elimination of DARPP‐32‐mediated PP1 inhibition allowed for a reduction in AKAR phosphorylation level for some combinations of dopamine amplitudes and durations (Fig. 7: compare G with F). This indicates that DARPP‐32 plays an important role in preventing the dephosphorylation of PKA substrates following a dopamine transient in D2 MSNs. However, even in the absence of DARPP‐32‐mediated PP1 inhibition, the AKAR reduction produced by brief (e.g. less than 5 s) dopamine peaks in D2 MSNs is much less pronounced than the PKA reduction (compare Fig. 7 G with E). This is because the time window of diminished PKA activity resulting from dopamine transients, in this case, is too short compared to PP1‐mediated AKAR dephosphorylation kinetics.
To summarize, both D1 and D2 signalling systems can sense brief dopamine inputs, which are subsequently transformed into opposing intracellular changes at the level of cAMP and PKA. At both levels, D2 MSNs appear to be more sensitive than D1 MSNs, in terms of amplitude and duration of the dopamine input. However, at the level of AKAR, D2 MSNs remain unresponsive to brief dopamine transients, due to the strong PP1 inhibition exerted by DARPP‐32.
Simulations indicate that D2 MSNs can sense a dip in the tonic level of dopamine
Aversive stimuli or the omission of an expected reward result in a pause in dopamine neuron activity, and thus in a transient dip in striatal dopamine level. We used our models to explore the effects of transient dips in dopamine level on cAMP–PKA signalling. To this end, both D1 and D2 models were simulated with varying levels of basal dopamine concentration, and a dip in this tonic dopamine level for different durations (Fig. 8). As with the previous simulations, the D2 model was simulated with a tonic A2A activity set to produce ∼50% of the maximum possible A2A‐dependent cAMP level.
Figure 8. Simulations of D1 and D2 MSN models with varying levels of tonic dopamine and dips in this tone level.
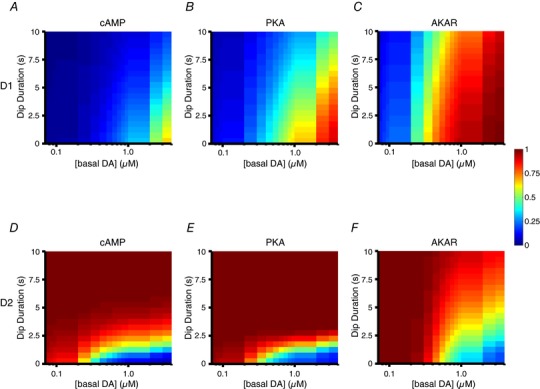
Responses at the level of cAMP (A), PKA (B) and AKAR (C) for the D1 MSN model simulations with varying basal (tonic) dopamine levels (upper 1D heat map) and the effect of a dopamine dip (lower 2D heat map) in these different basal level conditions. Each heat map represents the maximal value of the response produced by the dopamine dip. Colours correspond to the shown colour bar. The response values are normalized between 0 and 1, where 0 corresponds to the minimal response in the absence of any receptor stimulation and 1 corresponds to the response produced by a maximal activation of the D1 receptor. The relation between basal response and tonic dopamine level is displayed as a heat map using the same colour map as the dip response in order to facilitate comparison between the basal response and the effect of dip on top of that. Responses at the level of cAMP (D), PKA (E) and AKAR (F) for the D2 MSN model simulations with varying basal dopamine levels (upper 1D heat map) and the effect of a dopamine dip (lower 2D heat map) in these different basal level condition. In this case, the heat map represents the minimal value of response. The response values are normalized, 0 corresponding to the minimal response in absence of any receptor stimulation and 1 corresponding to the maximal response produced by the activation of ∼50% of A2A receptor.
Figure 8 A shows the effect of dips of different durations at different basal dopamine levels on cAMP in the D1 model. The dip duration of 0 s represented a scenario where there was no dip, thus representing the steady‐state level of cAMP for different basal dopamine levels. The steady‐state level of cAMP increased with the level of basal dopamine, and became significant when reaching the micromolar range (Fig. 8 A, dip duration = 0 s). When basal dopamine was in the sub‐micromolar range, there was little intracellular cAMP to start with, and therefore a dopamine dip had no effect on cAMP levels (Fig. 8 A, left side). With basal dopamine in the micromolar range, a dip in dopamine led to a clear reduction in the level of cAMP (Fig. 8 A, right side). The D1 model followed the same pattern at the level of PKA activity, although the responses were slightly left‐shifted due to the high sensitivity of PKA to cAMP (Fig. 8 B, dip duration = 0 s). Thus, the cAMP level reached with 1 μm basal dopamine was modest but sufficient to moderately activate PKA (compare Fig. 8 A and B; dip duration = 0 s). Similar to cAMP, there was no effect of a dopamine dip in the range where the steady‐state PKA was low to start with (Fig. 8 B, left half). An effect of the dip appeared in a higher range of basal dopamine, and required the dip to last at least 5 s (Fig. 8 B, right half). Thus, in order to be effective in the D1 signalling system, a dopamine dip should be long enough to accommodate the deactivation kinetics of the downstream effector system, a kinetics determined by G‐protein inactivation, cAMP degradation and PKA inactivation. Basal dopamine was more effective on AKAR phosphorylation level than on PKA (Fig. 8 C, dip duration = 0 s; compare with Fig. 8 B): even a sub‐micromolar level of basal dopamine led to a highly phosphorylated state, which is consistent with the high sensitivity of AKAR to PKA‐mediated phosphorylation. In this condition, a dopamine dip even of long duration had negligible effect on AKAR phosphorylation (Fig. 8 C).
In the D2 model, the A2A‐mediated steady state level of cAMP was decreased in the presence of sufficient basal dopamine, via the activation of D2 receptors (Fig. 8 D, dip duration = 0 s): there was no significant effect at very low basal dopamine on the cAMP levels, whereas the cAMP level was strongly reduced by dopamine concentrations in lower sub‐micromolar range. In this regime, since the cAMP signal was strongly inhibited, a transient lack of dopamine could allow for cAMP signalling to recover a high level. Indeed, simulation reported that brief dopamine dips (1–2 s) resulted in a strong cAMP increase (Fig. 8 D, right part). On the other hand, a dopamine dip had no effect if the basal dopamine was lower because in these conditions the starting level of cAMP was already around its maximum value (Fig. 8 D, left part).
Simulations showed similar effects at the level of PKA activity: a basal dopamine level in lower sub‐micromolar exerted a strong reduction in the PKA activity (Fig. 8 E, dip duration = 0 s). Again, dips with a short duration (1–2 s) led to efficient PKA activation. The effects on AKAR were similar to those simulated with PKA, except that the basal dopamine level producing an effect was slightly right shifted (Fig. 8 F, dip duration = 0 s). Similar to the PKA response, in a condition of sub‐micromolar basal dopamine, a dip led to increased AKAR phosphorylation (Fig. 8 F). However, the relation between the strength of AKAR response and dip duration appeared to be more graded that the relation between PKA activation and dip duration (Fig. 8 F). This led to a possibility that the dip duration may also have an encoding role as it has been previously hypothesized (Bayer et al. 2007; Nair et al. 2015).
In summary, while D1 MSNs appeared poorly suited to detect a dip in basal dopamine in a physiologically relevant range of dopamine concentration, D2 MSNs were capable of responding to dips of short durations, in a range of basal dopamine which is compatible with physiological conditions, and at all levels of the signalling cascade.
Discussion
It is commonly accepted that striatal D1 receptors have low affinity for dopamine compared to D2 receptors, leading to the idea that D2 receptors are activated by the tonic dopamine levels under basal conditions, while D1 receptors sense the phasic dopamine signals. The data we obtained using biosensor imaging on MSNs in brain slices challenge this assumption by showing that the EC50 of transient dopamine on D1 and D2 receptors differ only by a factor of two. These measurements, complemented with numerical simulations, indicate that both D1 and D2 MSNs can integrate a brief dopamine transient into a change in cAMP. However, in D2 MSNs, brief dopamine transients fail to affect the phosphorylation level of AKAR, a biosensor protein that reports the PKA/phosphatases equilibrium. In addition, simulations suggest that D2 MSNs can work in a ‘tone sensing’ mode, where they successfully respond to the transient interruptions (dips) in the tonic release of dopamine associated with the omission of expected rewards. The switch between the different detection modes for D2 MSNs may result from changes in tonic dopamine, adenosine, as well as from a number of other neuromodulatory cues that remain to be studied.
Our approach with biosensor imaging and transient stimulation with dopamine uncaging provided similar EC50 values for cAMP responses in D1 and D2 MSNs, in the sub‐micromolar range. While these values are in accordance with previously published measurements in pituitary homogenates or embryonic neuronal cultures (Enjalbert & Bockaert, 1983; Weiss et al. 1985), they strongly depart from several other studies, in particular for the D2 receptor, where published efficacies range from nanomolar to micromolar (Albert et al. 1990; Schoffelmeer et al. 1994). Indeed, both D1 and D2 receptors exhibit high and low affinity states, and the proportion between these states critically depends on intracellular GTP levels and on the extent of receptor to G‐protein pre‐coupling (Richfield et al. 1989; Waelbroeck, 1999). The ternary complex model of receptor G‐protein interaction postulates that the receptor affinity is higher when G‐protein is pre‐coupled to the receptors. Gi/o proteins, in particular, have been noted to exist as a pre‐coupled complex with the receptor even in the absence of ligand (Bünemann et al. 2003). A low level of GTP could shift the equilibrium towards the high affinity receptor–G‐protein complex (Hulme & Trevethick, 2010) and this parameter remains difficult to control in many experimental preparations. The density of receptors at the membrane may also affect efficacy measurements: our in silico simulations show the critical importance of this factor, which is hard to control in heterologous expression systems. Efficacy also depends on the output level which is considered (Kenakin, 2013) and our data indeed show a lower EC50 of dopamine on PKA‐dependent phosphorylation than on cAMP in D1 MSNs. The opposite effect is seen in D2 MSNs, with dopamine efficacy being highest on cAMP, then decreasing at the level of PKA‐dependent phosphorylation, and decreasing even more for G‐protein coupled potassium (GIRK) channel (Marcott et al. 2014). This is consistent with in silico simulations which showed that D2 receptors required high levels of dopamine for Gβγ signalling on GIRK channels (Nair et al. 2015). Another contributing factor may be slow adaptations of receptor efficacy and signalling cascade during the course of long dopamine applications. The D1 receptor strongly desensitizes (Dumartin et al. 2000) with a half‐decay time of ∼7 min (Gardner et al. 2001), inducing a twofold decrease in efficacy and reducing the maximal cAMP production (Kim et al. 2004). Symmetrically, the D2 receptor displays a heterologous sensitization (Watts & Neve, 1996; Watts et al. 1998). Altogether, these data suggest that sustained dopamine applications could profoundly affect dopamine efficacy on D1 and D2 receptors. Such effects are circumvented with dopamine uncaging, since the rise of dopamine level occurs within less than a second and decays in about 100 s.
The integrative action of the signalling cascade leads to the emergence of more complex properties that determine what type of dopamine signal can be sensed, and computational modelling is critical to understand these complex properties. Our data fit with the widely accepted notion that D1 MSNs are detectors of phasic dopamine. D1 MSNs indeed showed large responses to dopamine transients at the level of both cAMP and PKA‐dependent phosphorylation, consistent with a highly efficacious transduction system geared for sensing dopamine transients (Castro et al. 2013). In contrast to D1 MSNs, D2 MSNs showed an unexpected complexity in the integration of dopamine transients: the traditional view is that D2 receptors sense tonic dopamine, but this is contradicted by more recent data. Our data, as well as previous recordings with GIRK channels (Marcott et al. 2014), show that D2 neurons can sense transient dopamine in a high concentration range. In vivo, D2 receptors in MSNs have also been shown to mediate the psychomotor effects of cocaine, further supporting their role in the striatal response to high dopamine levels (Kharkwal et al. 2016). Yet, contrasting with the high cAMP responsiveness to brief dopamine transients, dopamine had little effect in decreasing the phosphorylation level in D2 cells, which is in line with the commonly accepted unresponsiveness of D2 MSNs to phasic dopamine. Our data thus suggest that D2 MSNs present a differential responsiveness to phasic dopamine: Gi/o‐ and cAMP‐dependent effectors such as G‐protein coupled channels, cyclic‐nucleotide gated channels and Epac proteins would selectively respond to phasic dopamine, whereas PKA targets, like NMDA receptors, synaptic proteins, PKA‐regulated ion channels or nuclear proteins could remain insensitive.
Our simulations highlight DARPP‐32 as a mediator of the unresponsiveness of D2 MSNs to transient dopamine peaks at the level of PKA/PP1 substrates. The DARPP‐32 phosphorylation produced by A2A receptors results in a strong inhibition of PP1. A transient dopamine input may only produce an effect if the time window of reduced PKA is long enough to allow DARPP‐32 Thr‐34 dephosphorylation and subsequent PP1 disinhibition. The computational models used in this study indicate that this disinhibition of PP1 could be particularly slow in D2 MSNs due to relatively weak dephosphorylation pressure on DARPP‐32. This would be consistent with previous observations reporting a higher PKA‐dependent phosphorylation of DARPP‐32 in D2 MSNs compared to D1 MSNs (Nishi et al. 2008). This difference between D1 and D2 MSNs certainly accounts for the efficient phosphorylation of several PKA targets in D2 MSNs, such as the GABAA receptors (Janssen et al. 2009) or histone H3 protein (Polito et al. 2015), even for small elevations in cAMP. As DARPP‐32 is involved in the temporal aspects of signal integration at various downstream effectors (Castro et al. 2013; Polito et al. 2015; Nair et al. 2016), it would be interesting to see how these neuron‐specific differences could affect such integrative processes.
The detection mode of D2 MSNs significantly differs depending on the tonic dopamine levels. Very low levels of tonic dopamine result in no significant inhibition of cAMP–PKA signalling and, in this configuration, cAMP in D2 MSNs can decrease in response to transient dopamine peaks. On the other hand, if tonic dopamine is high enough to suppress cAMP under basal conditions, then a dopamine peak cannot produce a further cAMP reduction. However, a dip in dopamine tone would result in an increase in cAMP, as previously predicted (Dreyer et al. 2010; Nair et al. 2015). D2 MSNs may thus be well suited for sensing the transient interruptions in tonic release of dopamine that are associated with the omission of expected rewards. This effect requires the activity of functionally coupled Golf‐dependent counterparts: if there is no underlying Golf‐mediated activity, neither a dopamine peak nor a dopamine dip will produce a D2‐dependent cAMP response. A2A is one important Golf‐coupled receptor, but a number of other neuromodulatory processes could play a similar role.
Basal dopamine levels vary over a wide range, from few tens of nanomolar to sub‐micromolar range (Kulagina et al. 2001; Chen & Budygin, 2007; Atcherley et al. 2015). At nanomolar dopamine level, both D1 and D2 MSNs can detect a transient dopamine peak. As the ambient dopamine level increases, PKA‐dependent phosphorylation level increases in D1 MSNs, which progressively blunts responses to dopamine peaks, whereas the cAMP signalling level remains responsive. In parallel, D2 MSNs lose their sensitivity to dopamine peaks but may then respond to transient dips in ambient dopamine levels, thus switching from peak to dip detection mode. Higher tonic dopamine levels, such as those obtained with drugs of abuse (Di Chiara & Imperato, 1988; Heien et al. 2005; Covey et al. 2013), would strongly activate D1 and D2 receptors, which thus appear as complex detectors of dopamine signals, integrating both concentration and temporal parameters.
In the case of D2 MSNs, the importance of the parameters coupling the D2 receptor and Gi/o proteins can be inferred from the model. For the cAMP signal in D2 MSNs to respond to a dopamine dip, the D2‐associated Gi/o protein should have a fast GTPase activity: if the deactivation of Gi/o is not fast enough, the dopamine dip detected at the level of the receptor could not propagate downstream. The high expression of Gi/o‐specific RGS protein in striatal neurons could be a way for Gi/o to achieve this fast GTPase activity (Gold et al. 1997; Xie et al. 2012). GTPase activating proteins (GAP) like RGS could accelerate the intrinsic GTPase activity by several orders of magnitude (Kimple et al. 2011). However, stimulatory G proteins (Gs/olf) are not effectively acted on by the RGS proteins (Ross & Wilkie, 2000). Even though AC5 is known to act as a GAP protein for Gs/olf, it is not as efficient as RGS on Gi/o (Scholich et al. 1999). These differences in GAP for Gi/o and Gs/olf are consistent with D2 MSNs being more efficient in detecting dopamine dips than D1 MSNs. On the other hand, in order to detect a transient dopamine peak, D1 and D2 receptors and their associated G‐protein activation kinetics should be fast: previously reported transient responses to dopamine suggest that the D1 and D2 signalling systems fulfil this requirement (Castro et al. 2013; Marcott et al. 2014; Yagishita et al. 2014).
Despite large advances in the understanding of the basal ganglia circuitry, a number of controversies persist. Whereas the classical model proposes an ‘opposing’ role for phasic and tonic dopamine, and direct and indirect pathways in the execution of motor programmes, other models describe a more complex integration through the network in which the temporal aspect is essential (Arbuthnott & Wickens, 2007; Nambu, 2008; Matsumoto & Hikosaka, 2009; Cui et al. 2013). Our data highlight an additional level of complexity which resides at the postsynaptic level, where a given neuromodulatory stimulus integrated through one signalling pathway allows for different integration schemes in the target neuron. Further complexity can arise from the differential splicing of D2 receptor mRNA (Monsma et al. 1989). While our data pertain to the D2 long variant that is the predominant form present at the postsynaptic level, differences in dopamine effect on cAMP–PKA signalling may be expected in presynaptic terminals, where the short variant is predominant (Khan et al. 1998; Usiello et al. 2000). D3 receptors, which exhibit a high affinity for dopamine, may change the detection modes selectively in the ventral striatum, a feature that might be of therapeutic interest (Sokoloff et al. 1990; Sokoloff & Le Foll, 2017).
Other signalling pathways that are modulated in parallel with cAMP–PKA could also exhibit a selective responsiveness to a specific temporal pattern of dopamine stimulation. Indeed, dopamine receptors have been reported to couple to the Gq–phospholipase C pathway, the extracellular signal‐regulated kinase (ERK), Src family kinases (SFKs), the arrestin—Ak–GSK3β pathway, and hypothesized to facilitate cross‐talk between various pathways (Hernandez‐Lopez et al. 2000; Beaulieu et al. 2005, 2015; Del'Guidice et al. 2011; Pascoli et al. 2011, 2014; Gutierrez‐Arenas et al. 2014). Whether these non‐canonical signalling pathways can distinguish between tonic and phasic dopamine remains to be investigated. Local differences at the sub‐cellular level may add another layer of complexity. While purely geometric factors play an important role, additional factors probably related to local differences in signalling proteins underlie different integrative properties that were reported between neighbouring sub‐cellular compartments within a same neuron (Neves et al. 2008; Castro et al. 2010; Gervasi et al. 2010; Li et al. 2015; Maiellaro et al. 2016).
It is very likely that this whole system fluctuates in vivo under the influence of continuous changes in numerous neuromodulators. Adenosine levels change transiently within a wide temporal range (Cechova & Venton, 2008; Nguyen et al. 2014; Sims & Dale, 2014). Other neuromodulators such as acetylcholine (Threlfell et al. 2010, 2012; Nair et al. 2015), serotonin (Tanaka et al. 2007) or nitric oxide (Polito et al. 2013; Threlfell & West, 2013) are also likely to affect directly or indirectly cAMP signalling. Knowing the physiological conditions controlling these different neuromodulatory signals would allow a more comprehensive understanding of the physiology of D2 MSNs. Our modelling study depicts a system which lies at the border between different signal detection behaviours: relatively modest changes in these neuromodulators could lead to profound differences in MSN responsiveness to dopamine, switching the D2 MSNs between peak or tone sensing mode.
Additional information
Competing interests
The authors declare no conflict of interest.
Author contributions
C.Y., A.G.N., L.C. and L.R.C. performed experiments. C.Y., A.G.N., L.R.C., J.H.K. and P.V. analysed data and drafted the work. All authors have approved the final version of the manuscript, agree to be accountable for all aspects of the work in ensuring that questions related to the accuracy or integrity of any part of the work are appropriately investigated and resolved. All persons designated as authors qualify for authorship, and all those who qualify for authorship are listed.
Funding
Labex Biopsy; Ecole des Neurosciences de Paris; DIM Cerveau Pensée Région Île‐de‐France; The European Horizon2020 Framework Programme under grant agreement no. 720270 (Human Brain Project SGA1); The Swedish Research Council; National Institute on Alcohol Abuse and Alcoholism Grant 2R01AA016022; Swedish e‐Science Research Center; EuroSPIN – an Erasmus Mundus Joint Doctoral programme.
Translational perspective
A number of clinically used drugs, and in particular most (if not all) antipsychotics, are antagonists of dopamine receptors. Although these drugs clearly improve the patient's condition, they do not alleviate all the symptoms of the disease and inflict some undesirable side‐effects. Biosensor imaging on live brain slices allows for a dynamic measurement of the cellular response to a transient neuromodulatory stimulus. This approach revealed that, surprisingly, dopamine has a similar efficacy on D1 and D2 receptors, in contradiction to many biochemical measurements. The added value of this approach lies in: (1) the dynamic aspect of the measurement, which circumvents slow adaptations and desensitization processes; (2) the fact that the measurement is performed on endogenous receptors in living neurons; (3) the possibility to probe individual neurons in a defined brain region. The benefits of this approach in the development of novel drugs acting on dopamine receptors could be twofold. First, it can provide a measurement of drug efficacy and potency on the functional response to dopamine, in particular a quantitative comparison of drug efficacies on neurons expressing different subtypes of dopamine receptors, thus helping define a therapeutic window. Secondly, by adding a temporal dimension to analysis of receptor action on intracellular signalling, it may change our conception of the pathophysiological role played by the therapeutic target.
Supporting information
Disclaimer: Supporting information has been peer‐reviewed but not copyedited.
Video S1. Time‐course of changes in cAMP in D1 and D2 MSNs.
Video S2. Time‐course of changes in PKA‐dependent phosphorylation level in D1 and D2 MSNs.
Acknowledgements
We thank Aurélie Ky, Jérôme Tange and Bryon Da Silva for helpful contributions to the experimental work. We thank Professor Juan Llopis for helpful discussions and comments on the manuscript, and Professor Kazuya Kikuchi for his insight in chemistry.
Linked articles This article is highlighted by a Perspective by Madsen & Dreyer. To read this Perspective, visit https://doi.org/10.1113/JP275079.
This is an Editor's Choice article from the 15 December 2017 issue.
References
- Ahn JH, McAvoy T, Rakhilin SV, Nishi A, Greengard P & Nairn AC (2007a). Protein kinase A activates protein phosphatase 2A by phosphorylation of the B56delta subunit. Proc Natl Acad Sci USA 104, 2979–2984. [DOI] [PMC free article] [PubMed] [Google Scholar]
- Ahn JH, Sung JY, McAvoy T, Nishi A, Janssens V, Goris J, Greengard P & Nairn AC (2007b). The B’’/PR72 subunit mediates Ca2+‐dependent dephosphorylation of DARPP‐32 by protein phosphatase 2A. Proc Natl Acad Sci USA 104, 9876–9881. [DOI] [PMC free article] [PubMed] [Google Scholar]
- Albert PR, Neve KA, Bunzow JR & Civelli O (1990). Coupling of a cloned rat dopamine‐D2 receptor to inhibition of adenylyl cyclase and prolactin secretion. J Biol Chem 265, 2098–2104. [PubMed] [Google Scholar]
- Allen MD & Zhang J (2006). Subcellular dynamics of protein kinase A activity visualized by FRET‐based reporters. Biochem Biophys Res Commun 348, 716–721. [DOI] [PubMed] [Google Scholar]
- Arbuthnott GW & Wickens J (2007). Space, time and dopamine. Trends Neurosci 30, 62–69. [DOI] [PubMed] [Google Scholar]
- Atcherley CW, Wood KM, Parent KL, Hashemi P & Heien ML (2015). The coaction of tonic and phasic dopamine dynamics. Chem Commun (Camb) 51, 2235–2238. [DOI] [PMC free article] [PubMed] [Google Scholar]
- Bateup HS, Svenningsson P, Kuroiwa M, Gong S, Nishi A, Heintz N & Greengard P (2008). Cell type‐specific regulation of DARPP‐32 phosphorylation by psychostimulant and antipsychotic drugs. Nat Neurosci 11, 932–939. [DOI] [PMC free article] [PubMed] [Google Scholar]
- Bayer HM, Lau B & Glimcher PW (2007). Statistics of midbrain dopamine neuron spike trains in the awake primate. J Neurophysiol 98, 1428–1439. [DOI] [PubMed] [Google Scholar]
- Beaulieu JM, Espinoza S & Gainetdinov RR (2015). Dopamine receptors – IUPHAR Review 13. Br J Pharmacol 172, 1–23. [DOI] [PMC free article] [PubMed] [Google Scholar]
- Beaulieu JM & Gainetdinov RR (2011). The physiology, signaling, and pharmacology of dopamine receptors. Pharmacol Rev 63, 182–217. [DOI] [PubMed] [Google Scholar]
- Beaulieu JM, Sotnikova TD, Marion S, Lefkowitz RJ, Gainetdinov RR & Caron MG (2005). An Akt/beta‐arrestin 2/PP2A signaling complex mediates dopaminergic neurotransmission and behavior. Cell 122, 261–273. [DOI] [PubMed] [Google Scholar]
- Bertran‐Gonzalez J, Bosch C, Maroteaux M, Matamales M, Herve D, Valjent E & Girault JA (2008). Opposing patterns of signaling activation in dopamine D1 and D2 receptor‐expressing striatal neurons in response to cocaine and haloperidol. J Neurosci 28, 5671–5685. [DOI] [PMC free article] [PubMed] [Google Scholar]
- Bertran‐Gonzalez J, Hakansson K, Borgkvist A, Irinopoulou T, Brami‐Cherrier K, Usiello A, Greengard P, Herve D, Girault JA, Valjent E & Fisone G (2009). Histone H3 phosphorylation is under the opposite tonic control of dopamine D2 and adenosine A2A receptors in striatopallidal neurons. Neuropsychopharmacology 34, 1710–1720. [DOI] [PMC free article] [PubMed] [Google Scholar]
- Bertran‐Gonzalez J, Herve D, Girault JA & Valjent E (2010). What is the degree of segregation between striatonigral and striatopallidal projections? Front Neuroanat 4, [DOI] [PMC free article] [PubMed] [Google Scholar]
- Bibb JA, Snyder GL, Nishi A, Yan Z, Meijer L, Fienberg AA, Tsai LH, Kwon YT, Girault JA, Czernik AJ, Huganir RL, Hemmings HCJ, Nairn AC & Greengard P (1999). Phosphorylation of DARPP‐32 by Cdk5 modulates dopamine signalling in neurons. Nature 402, 669–671. [DOI] [PubMed] [Google Scholar]
- Biever A, Valjent E & Puighermanal E (2015). Ribosomal protein S6 phosphorylation in the nervous system: from regulation to function. Front Mol Neurosci 8, 75. [DOI] [PMC free article] [PubMed] [Google Scholar]
- Bonaventura J, Navarro G, Casado‐Anguera V, Azdad K, Rea W, Moreno E, Brugarolas M, Mallol J, Canela EI, Lluis C, Cortes A, Volkow ND, Schiffmann SN, Ferré S & Casado V (2015). Allosteric interactions between agonists and antagonists within the adenosine A2A receptor‐dopamine D2 receptor heterotetramer. Proc Natl Acad Sci USA 112, E3609–18. [DOI] [PMC free article] [PubMed] [Google Scholar]
- Bos JL (2003). Epac: a new cAMP target and new avenues in cAMP research. Nat Rev Mol Cell Biol 4, 733–738. [DOI] [PubMed] [Google Scholar]
- Bünemann M, Frank M & Lohse MJ (2003). Gi protein activation in intact cells involves subunit rearrangement rather than dissociation. Proc Natl Acad Sci USA 100, 16077–16082. [DOI] [PMC free article] [PubMed] [Google Scholar]
- Castro LR, Brito M, Guiot E, Polito M, Korn CW, Herve D, Girault JA, Paupardin‐Tritsch D & Vincent P (2013). Striatal neurones have a specific ability to respond to phasic dopamine release. J Physiol 591, 3197–3214. [DOI] [PMC free article] [PubMed] [Google Scholar]
- Castro LR, Gervasi N, Guiot E, Cavellini L, Nikolaev VO, Paupardin‐Tritsch D & Vincent P (2010). Type 4 phosphodiesterase plays different integrating roles in different cellular domains in pyramidal cortical neurons. J Neurosci 30, 6143–6151. [DOI] [PMC free article] [PubMed] [Google Scholar]
- Cechova S & Venton BJ (2008). Transient adenosine efflux in the rat caudate‐putamen. J Neurochem 105, 1253–1263. [DOI] [PubMed] [Google Scholar]
- Cerovic M, d'Isa R, Tonini R & Brambilla R (2013). Molecular and cellular mechanisms of dopamine‐mediated behavioral plasticity in the striatum. Neurobiol Learn Mem 105, 63–80. [DOI] [PubMed] [Google Scholar]
- Chelliah V, Juty N, Ajmera I, Ali R, Dumousseau M, Glont M, Hucka M, Jalowicki G, Keating S, Knight‐Schrijver V, Lloret‐Villas A, Natarajan KN, Pettit JB, Rodriguez N, Schubert M, Wimalaratne SM, Zhao Y, Hermjakob H, Le Novère N & Laibe C (2015). BioModels: ten‐year anniversary. Nucleic Acids Res 43, D542–8. [DOI] [PMC free article] [PubMed] [Google Scholar]
- Chen KC & Budygin EA (2007). Extracting the basal extracellular dopamine concentrations from the evoked responses: re‐analysis of the dopamine kinetics. J Neurosci Methods 164, 27–42. [DOI] [PubMed] [Google Scholar]
- Chuhma N, Mingote S, Moore H & Rayport S (2014). Dopamine neurons control striatal cholinergic neurons via regionally heterogeneous dopamine and glutamate signaling. Neuron 81, 901–912. [DOI] [PMC free article] [PubMed] [Google Scholar]
- Covey DP, Juliano SA & Garris PA (2013). Amphetamine elicits opposing actions on readily releasable and reserve pools for dopamine. PLoS One 8, e60763. [DOI] [PMC free article] [PubMed] [Google Scholar]
- Cui G, Jun SB, Jin X, Pham MD, Vogel SS, Lovinger DM & Costa RM (2013). Concurrent activation of striatal direct and indirect pathways during action initiation. Nature 494, 238–242. [DOI] [PMC free article] [PubMed] [Google Scholar]
- Cumming P (2011). Absolute abundances and affinity states of dopamine receptors in mammalian brain: A review. Synapse 65, 892–909. [DOI] [PubMed] [Google Scholar]
- Day JJ, Roitman MF, Wightman RM & Carelli RM (2007). Associative learning mediates dynamic shifts in dopamine signaling in the nucleus accumbens. Nat Neurosci 10, 1020–1028. [DOI] [PubMed] [Google Scholar]
- Del'Guidice T, Lemasson M & Beaulieu JM (2011). Role of beta‐arrestin 2 downstream of dopamine receptors in the basal ganglia. Front Neuroanat 5, 58. [DOI] [PMC free article] [PubMed] [Google Scholar]
- Di Chiara G & Imperato A (1988). Drugs abused by humans preferentially increase synaptic dopamine concentrations in the mesolimbic system of freely moving rats. Proc Natl Acad Sci USA 85, 5274–5278. [DOI] [PMC free article] [PubMed] [Google Scholar]
- Dostmann WR & Taylor SS (1991). Identifying the molecular switches that determine whether (Rp)‐cAMPS functions as an antagonist or an agonist in the activation of cAMP‐dependent protein kinase I. Biochemistry 30, 8710–8716. [DOI] [PubMed] [Google Scholar]
- Dreyer JK, Herrik KF, Berg RW & Hounsgaard JD (2010). Influence of phasic and tonic dopamine release on receptor activation. J Neurosci 30, 14273–14283. [DOI] [PMC free article] [PubMed] [Google Scholar]
- Ducros M, Moreaux L, Bradley J, Tiret P, Griesbeck O & Charpak S (2009). Spectral unmixing: analysis of performance in the olfactory bulb in vivo. PloS One 4, e4418. [DOI] [PMC free article] [PubMed] [Google Scholar]
- Dumartin B, Jaber M, Gonon F, Caron MG, Giros B & Bloch B (2000). Dopamine tone regulates D1 receptor trafficking and delivery in striatal neurons in dopamine transporter‐deficient mice. Proc Natl Acad Sci USA 97, 1879–1884. [DOI] [PMC free article] [PubMed] [Google Scholar]
- Ehrengruber MU, Lundstrom K, Schweitzer C, Heuss C, Schlesinger S & Gähwiler BH (1999). Recombinant Semliki Forest virus and Sindbis virus efficiently infect neurons in hippocampal slice cultures. Proc Natl Acad Sci USA 96, 7041–7046. [DOI] [PMC free article] [PubMed] [Google Scholar]
- Enjalbert A & Bockaert J (1983). Pharmacological characterization of the D2 dopamine receptor negatively coupled with adenylate cyclase in rat anterior pituitary. Mol Pharmacol 23, 576–584. [PubMed] [Google Scholar]
- Ferré S, Quiroz C, Woods AS, Cunha R, Popoli P, Ciruela F, Lluis C, Franco R, Azdad K & Schiffmann SN (2008). An update on adenosine A2A‐dopamine D2 receptor interactions: implications for the function of G protein‐coupled receptors. Curr Pharm Des 14, 1468–1474. [DOI] [PMC free article] [PubMed] [Google Scholar]
- Ferré S, von Euler G, Johansson B, Fredholm BB & Fuxe K (1991). Stimulation of high‐affinity adenosine A2 receptors decreases the affinity of dopamine D2 receptors in rat striatal membranes. Proc Natl Acad Sci USA 88, 7238–7241. [DOI] [PMC free article] [PubMed] [Google Scholar]
- Gao ZG, Mamedova LK, Chen P & Jacobson KA (2004). 2‐Substituted adenosine derivatives: affinity and efficacy at four subtypes of human adenosine receptors. Biochem Pharmacol 68, 1985–1993. [DOI] [PMC free article] [PubMed] [Google Scholar]
- Gardner B, Liu ZF, Jiang D & Sibley DR (2001). The role of phosphorylation/dephosphorylation in agonist‐induced desensitization of D1 dopamine receptor function: evidence for a novel pathway for receptor dephosphorylation. Mol Pharmacol 59, 310–321. [DOI] [PubMed] [Google Scholar]
- Gerfen CR & Surmeier DJ (2011). Modulation of striatal projection systems by dopamine. Annu Rev Neurosci 34, 441–466. [DOI] [PMC free article] [PubMed] [Google Scholar]
- Gervasi N, Hepp R, Tricoire L, Zhang J, Lambolez B, Paupardin‐Tritsch D & Vincent P (2007). Dynamics of protein kinase A signaling at the membrane, in the cytosol, and in the nucleus of neurons in mouse brain slices. J Neurosci 27, 2744–2750. [DOI] [PMC free article] [PubMed] [Google Scholar]
- Gervasi N, Tchenio P & Preat T (2010). PKA dynamics in a Drosophila learning center: coincidence detection by rutabaga adenylyl cyclase and spatial regulation by dunce phosphodiesterase. Neuron 65, 516–529. [DOI] [PubMed] [Google Scholar]
- Gold SJ, Ni YG, Dohlman HG & Nestler EJ (1997). Regulators of G‐protein signaling (RGS) proteins: region‐specific expression of nine subtypes in rat brain. J Neurosci 17, 8024–8037. [DOI] [PMC free article] [PubMed] [Google Scholar]
- Gonon F (1997). Prolonged and extrasynaptic excitatory action of dopamine mediated by D1 receptors in the rat striatum in vivo . J Neurosci 17, 5972–5978. [DOI] [PMC free article] [PubMed] [Google Scholar]
- Grace AA (2016). Dysregulation of the dopamine system in the pathophysiology of schizophrenia and depression. Nat Rev Neurosci 17, 524–532. [DOI] [PMC free article] [PubMed] [Google Scholar]
- Grace AA & Bunney BS (1984a). The control of firing pattern in nigral dopamine neurons: burst firing. J Neurosci 4, 2877–2890. [DOI] [PMC free article] [PubMed] [Google Scholar]
- Grace AA & Bunney BS (1984b). The control of firing pattern in nigral dopamine neurons: single spike firing. J Neurosci 4, 2866–2876. [DOI] [PMC free article] [PubMed] [Google Scholar]
- Gutierrez‐Arenas O, Eriksson O & Kotaleski JH (2014). Segregation and crosstalk of D1 receptor‐mediated activation of ERK in striatal medium spiny neurons upon acute administration of psychostimulants. PLoS Comput Biol 10, e1003445. [DOI] [PMC free article] [PubMed] [Google Scholar]
- Hart AS, Rutledge RB, Glimcher PW & Phillips PE (2014). Phasic dopamine release in the rat nucleus accumbens symmetrically encodes a reward prediction error term. J Neurosci 34, 698–704. [DOI] [PMC free article] [PubMed] [Google Scholar]
- Heien ML, Khan AS, Ariansen JL, Cheer JF, Phillips PE, Wassum KM & Wightman RM (2005). Real‐time measurement of dopamine fluctuations after cocaine in the brain of behaving rats. Proc Natl Acad Sci USA 102, 10023–10028. [DOI] [PMC free article] [PubMed] [Google Scholar]
- Hemmings HCJ, Greengard P, Tung HY & Cohen P (1984). DARPP‐32, a dopamine‐regulated neuronal phosphoprotein, is a potent inhibitor of protein phosphatase‐1. Nature 310, 503–505. [DOI] [PubMed] [Google Scholar]
- Hernandez‐Lopez S, Tkatch T, Perez‐Garci E, Galarraga E, Bargas J, Hamm H & Surmeier DJ (2000). D2 dopamine receptors in striatal medium spiny neurons reduce L‐type Ca2+ currents and excitability via a novel PLCβ1–IP3–calcineurin‐signaling cascade. J Neurosci 20, 8987–8995. [DOI] [PMC free article] [PubMed] [Google Scholar]
- Higley MJ & Sabatini BL (2010). Competitive regulation of synaptic Ca2+ influx by D2 dopamine and A2A adenosine receptors. Nat Neurosci 13, 958–966. [DOI] [PMC free article] [PubMed] [Google Scholar]
- Huang HB, Horiuchi A, Watanabe T, Shih SR, Tsay HJ, Li HC, Greengard P & Nairn AC (1999). Characterization of the inhibition of protein phosphatase‐1 by DARPP‐32 and inhibitor‐2. J Biol Chem 274, 7870–7878. [DOI] [PubMed] [Google Scholar]
- Hulme EC & Trevethick MA (2010). Ligand binding assays at equilibrium: validation and interpretation. Br J Pharmacol 161, 1219–1237. [DOI] [PMC free article] [PubMed] [Google Scholar]
- Janssen MJ, Ade KK, Fu Z & Vicini S (2009). Dopamine modulation of GABA tonic conductance in striatal output neurons. J Neurosci 29, 5116–5126. [DOI] [PMC free article] [PubMed] [Google Scholar]
- Kelly MP, Adamowicz W, Bove S, Hartman AJ, Mariga A, Pathak G, Reinhart V, Romegialli A & Kleiman RJ (2014). Select 3ʹ,5ʹ‐cyclic nucleotide phosphodiesterases exhibit altered expression in the aged rodent brain. Cell Signal 26, 383–397. [DOI] [PubMed] [Google Scholar]
- Kenakin T (2013). New concepts in pharmacological efficacy at 7TM receptors: IUPHAR Review 2. Br J Pharmacol 168, 554–575. [DOI] [PMC free article] [PubMed] [Google Scholar]
- Khan ZU, Mrzljak L, Gutierrez A, de la Calle A & Goldman‐Rakic PS (1998). Prominence of the dopamine D2 short isoform in dopaminergic pathways. Proc Natl Acad Sci USA 95, 7731–7736. [DOI] [PMC free article] [PubMed] [Google Scholar]
- Kharkwal G, Radl D, Lewis R & Borrelli E (2016). Dopamine D2 receptors in striatal output neurons enable the psychomotor effects of cocaine. Proc Natl Acad Sci USA. [DOI] [PMC free article] [PubMed] [Google Scholar]
- Kheirbek MA, Beeler JA, Ishikawa Y & Zhuang X (2008). A cAMP pathway underlying reward prediction in associative learning. J Neurosci 28, 11401–11408. [DOI] [PMC free article] [PubMed] [Google Scholar]
- Kim OJ, Gardner BR, Williams DB, Marinec PS, Cabrera DM, Peters JD, Mak CC, Kim KM & Sibley DR (2004). The role of phosphorylation in D1 dopamine receptor desensitization: evidence for a novel mechanism of arrestin association. J Biol Chem 279, 7999–8010. [DOI] [PMC free article] [PubMed] [Google Scholar]
- Kimple AJ, Bosch DE, Giguère PM & Siderovski DP (2011). Regulators of G‐protein signaling and their Gα substrates: promises and challenges in their use as drug discovery targets. Pharmacol Rev 63, 728–749. [DOI] [PMC free article] [PubMed] [Google Scholar]
- Klotz KN, Camaioni E, Volpini R, Kachler S, Vittori S & Cristalli G (1999). 2‐Substituted N‐ethylcarboxamidoadenosine derivatives as high‐affinity agonists at human A3 adenosine receptors. Naunyn Schmiedebergs Arch Pharmacol 360, 103–108. [DOI] [PubMed] [Google Scholar]
- Kozorovitskiy Y, Peixoto R, Wang W, Saunders A & Sabatini BL (2015). Neuromodulation of excitatory synaptogenesis in striatal development. Elife 4, [DOI] [PMC free article] [PubMed] [Google Scholar]
- Kreitzer AC (2009). Physiology and pharmacology of striatal neurons. Annu Rev Neurosci 32, 127–147. [DOI] [PubMed] [Google Scholar]
- Kulagina NV, Zigmond MJ & Michael AC (2001). Glutamate regulates the spontaneous and evoked release of dopamine in the rat striatum. Neuroscience 102, 121–128. [DOI] [PubMed] [Google Scholar]
- Lee TH, Gee KR, Davidson C & Ellinwood EH (2002). Direct, real‐time assessment of dopamine release autoinhibition in the rat caudate‐putamen. Neuroscience 112, 647–654. [DOI] [PubMed] [Google Scholar]
- Li L, Gervasi N & Girault JA (2015). Dendritic geometry shapes neuronal cAMP signalling to the nucleus. Nat Commun 6, 6319. [DOI] [PMC free article] [PubMed] [Google Scholar]
- Lovinger DM (2010). Neurotransmitter roles in synaptic modulation, plasticity and learning in the dorsal striatum. Neuropharmacology 58, 951–961. [DOI] [PMC free article] [PubMed] [Google Scholar]
- Maiellaro I, Lohse MJ, Kittel RJ & Calebiro D (2016). cAMP signals in Drosophila motor neurons are confined to single synaptic boutons. Cell Rep 17, 1238–1246. [DOI] [PMC free article] [PubMed] [Google Scholar]
- Marcott PF, Mamaligas AA & Ford CP (2014). Phasic dopamine release drives rapid activation of striatal D2‐receptors. Neuron 84, 164–176. [DOI] [PMC free article] [PubMed] [Google Scholar]
- Matsumoto M & Hikosaka O (2009). Two types of dopamine neuron distinctly convey positive and negative motivational signals. Nature 459, 837–841. [DOI] [PMC free article] [PubMed] [Google Scholar]
- Mirenowicz J & Schultz W (1996). Preferential activation of midbrain dopamine neurons by appetitive rather than aversive stimuli. Nature 379, 449–451. [DOI] [PubMed] [Google Scholar]
- Monsma FJ, McVittie LD, Gerfen CR, Mahan LC & Sibley DR (1989). Multiple D2 dopamine receptors produced by alternative RNA splicing. Nature 342, 926–929. [DOI] [PubMed] [Google Scholar]
- Nair AG, Bhalla US & Hellgren Kotaleski J (2016). Role of DARPP‐32 and ARPP‐21 in the emergence of temporal constraints on striatal calcium and dopamine integration. PLoS Comput Biol 12, e1005080. [DOI] [PMC free article] [PubMed] [Google Scholar]
- Nair AG, Gutierrez‐Arenas O, Eriksson O, Vincent P & Hellgren‐Kotaleski J (2015). Sensing positive versus negative reward signals through adenylyl cyclase‐coupled GPCRs in direct and indirect pathway striatal medium spiny neurons. J Neurosci 35, 14017–14030. [DOI] [PMC free article] [PubMed] [Google Scholar]
- Nambu A (2008). Seven problems on the basal ganglia. Curr Opin Neurobiol 18, 595–604. [DOI] [PubMed] [Google Scholar]
- Nelson AB & Kreitzer AC (2014). Reassessing models of basal ganglia function and dysfunction. Annu Rev Neurosci 37, 117–135. [DOI] [PMC free article] [PubMed] [Google Scholar]
- Neves SR, Tsokas P, Sarkar A, Grace EA, Rangamani P, Taubenfeld SM, Alberini CM, Schaff JC, Blitzer RD, Moraru II & Iyengar R (2008). Cell shape and negative links in regulatory motifs together control spatial information flow in signaling networks. Cell 133, 666–680. [DOI] [PMC free article] [PubMed] [Google Scholar]
- Nguyen MD, Lee ST, Ross AE, Ryals M, Choudhry VI & Venton BJ (2014). Characterization of spontaneous, transient adenosine release in the caudate‐putamen and prefrontal cortex. PLoS One 9, e87165. [DOI] [PMC free article] [PubMed] [Google Scholar]
- Nguyen QT, Tsai PS & Kleinfeld D (2006). MPScope: a versatile software suite for multiphoton microscopy. J Neurosci Methods 156, 351–359. [DOI] [PubMed] [Google Scholar]
- Nicholson C (2005). Factors governing diffusing molecular signals in brain extracellular space. J Neural Transm (Vienna) 112, 29–44. [DOI] [PubMed] [Google Scholar]
- Nishi A, Bibb JA, Matsuyama S, Hamada M, Higashi H, Nairn AC & Greengard P (2002). Regulation of DARPP‐32 dephosphorylation at PKA‐ and Cdk5‐sites by NMDA and AMPA receptors: distinct roles of calcineurin and protein phosphatase‐2A. J Neurochem 81, 832–841. [DOI] [PubMed] [Google Scholar]
- Nishi A, Bibb JA, Snyder GL, Higashi H, Nairn AC & Greengard P (2000). Amplification of dopaminergic signaling by a positive feedback loop. Proc Natl Acad Sci USA 97, 12840–12845. [DOI] [PMC free article] [PubMed] [Google Scholar]
- Nishi A, Kuroiwa M, Miller DB, O'Callaghan JP, Bateup HS, Shuto T, Sotogaku N, Fukuda T, Heintz N, Greengard P & Snyder GL (2008). Distinct roles of PDE4 and PDE10A in the regulation of cAMP/PKA signaling in the striatum. J Neurosci 28, 10460–10471. [DOI] [PMC free article] [PubMed] [Google Scholar]
- Nishi A, Snyder GL & Greengard P (1997). Bidirectional regulation of DARPP‐32 phosphorylation by dopamine. J Neurosci 17, 8147–8155. [DOI] [PMC free article] [PubMed] [Google Scholar]
- Nishi A, Watanabe Y, Higashi H, Tanaka M, Nairn AC & Greengard P (2005). Glutamate regulation of DARPP‐32 phosphorylation in neostriatal neurons involves activation of multiple signaling cascades. Proc Natl Acad Sci USA 102, 1199–1204. [DOI] [PMC free article] [PubMed] [Google Scholar]
- Paladini CA & Roeper J (2014). Generating bursts (and pauses) in the dopamine midbrain neurons. Neuroscience 282, 109–121. [DOI] [PubMed] [Google Scholar]
- Pascoli V, Besnard A, Hervé D, Pagès C, Heck N, Girault JA, Caboche J & Vanhoutte P (2011). Cyclic adenosine monophosphate‐independent tyrosine phosphorylation of NR2B mediates cocaine‐induced extracellular signal‐regulated kinase activation. Biol Psychiatry 69, 218–227. [DOI] [PubMed] [Google Scholar]
- Pascoli V, Cahill E, Bellivier F, Caboche J & Vanhoutte P (2014). Extracellular signal‐regulated protein kinases 1 and 2 activation by addictive drugs: a signal toward pathological adaptation. Biol Psychiatry 76, 917–926. [DOI] [PubMed] [Google Scholar]
- Polito M, Guiot E, Gangarossa G, Longueville S, Doulazmi M, Valjent E, Hervé D, Girault JA, Paupardin‐Tritsch D, Castro LR & Vincent P (2015). Selective effects of PDE10A inhibitors on striatopallidal neurons require phosphatase inhibition by DARPP‐32. eNeuro 2, 1–15. [DOI] [PMC free article] [PubMed] [Google Scholar]
- Polito M, Klarenbeek J, Jalink K, Paupardin‐Tritsch D, Vincent P & Castro LR (2013). The NO/cGMP pathway inhibits transient cAMP signals through the activation of PDE2 in striatal neurons. Front Cell Neurosci 7, 211. [DOI] [PMC free article] [PubMed] [Google Scholar]
- Polito M, Vincent P & Guiot E (2014). Biosensor imaging in brain slice preparations In 1071, ed. Zhang J, pp. 175–194. Humana Press, New York. [DOI] [PubMed] [Google Scholar]
- Reynolds JN, Hyland BI & Wickens JR (2001). A cellular mechanism of reward‐related learning. Nature 413, 67–70. [DOI] [PubMed] [Google Scholar]
- Richfield EK, Penney JB & Young AB (1989). Anatomical and affinity state comparisons between dopamine D1 and D2 receptors in the rat central nervous system. Neuroscience 30, 767–777. [DOI] [PubMed] [Google Scholar]
- Ross EM & Wilkie TM (2000). GTPase‐activating proteins for heterotrimeric G proteins: regulators of G protein signaling (RGS) and RGS‐like proteins. Annu Rev Biochem 69, 795–827. [DOI] [PubMed] [Google Scholar]
- Schoffelmeer AN, Hogenboom F, Mulder AH, Ronken E, Stoof JC & Drukarch B (1994). Dopamine displays an identical apparent affinity towards functional dopamine D1 and D2 receptors in rat striatal slices: possible implications for the regulatory role of D2 receptors. Synapse 17, 190–195. [DOI] [PubMed] [Google Scholar]
- Scholich K, Mullenix JB, Wittpoth C, Poppleton HM, Pierre SC, Lindorfer MA, Garrison JC & Patel TB (1999). Facilitation of signal onset and termination by adenylyl cyclase. Science 283, 1328–1331. [DOI] [PubMed] [Google Scholar]
- Schultz W (2002). Getting formal with dopamine and reward. Neuron 36, 241–263. [DOI] [PubMed] [Google Scholar]
- Schultz W (2010). Dopamine signals for reward value and risk: basic and recent data. Behav Brain Funct 6, 24. [DOI] [PMC free article] [PubMed] [Google Scholar]
- Schultz W & Romo R (1987). Responses of nigrostriatal dopamine neurons to high‐intensity somatosensory stimulation in the anesthetized monkey. J Neurophysiol 57, 201–217. [DOI] [PubMed] [Google Scholar]
- Shen W, Flajolet M, Greengard P & Surmeier DJ (2008). Dichotomous dopaminergic control of striatal synaptic plasticity. Science 321, 848–851. [DOI] [PMC free article] [PubMed] [Google Scholar]
- Sims RE & Dale N (2014). Activity‐dependent adenosine release may be linked to activation of Na+‐K+ ATPase: an in vitro rat study. PLoS One 9, e87481. [DOI] [PMC free article] [PubMed] [Google Scholar]
- Skinbjerg M, Sibley DR, Javitch JA & Abi‐Dargham A (2012). Imaging the high‐affinity state of the dopamine D2 receptor in vivo: fact or fiction? Biochem Pharmacol 83, 193–198. [DOI] [PMC free article] [PubMed] [Google Scholar]
- Sokoloff P, Giros B, Martres MP, Bouthenet ML & Schwartz JC (1990). Molecular cloning and characterization of a novel dopamine receptor (D3) as a target for neuroleptics. Nature 347, 146–151. [DOI] [PubMed] [Google Scholar]
- Sokoloff P & Le Foll B (2017). The dopamine D3 receptor, a quarter century later. Eur J Neurosci 45, 2–19. [DOI] [PubMed] [Google Scholar]
- Surmeier DJ, Carrillo‐Reid L & Bargas J (2011). Dopaminergic modulation of striatal neurons, circuits, and assemblies. Neuroscience 198, 3–18. [DOI] [PMC free article] [PubMed] [Google Scholar]
- Surmeier DJ, Ding J, Day M, Wang Z & Shen W (2007). D1 and D2 dopamine‐receptor modulation of striatal glutamatergic signaling in striatal medium spiny neurons. Trends Neurosci 30, 228–235. [DOI] [PubMed] [Google Scholar]
- Swapna I, Bondy B & Morikawa H (2016). Differential dopamine regulation of Ca2+ signaling and its timing dependence in the nucleus accumbens. Cell Rep 15, 563–573. [DOI] [PMC free article] [PubMed] [Google Scholar]
- Tanaka SC, Schweighofer N, Asahi S, Shishida K, Okamoto Y, Yamawaki S & Doya K (2007). Serotonin differentially regulates short‐ and long‐term prediction of rewards in the ventral and dorsal striatum. PLoS One 2, e1333. [DOI] [PMC free article] [PubMed] [Google Scholar]
- Threlfell S, Clements MA, Khodai T, Pienaar IS, Exley R, Wess J & Cragg SJ (2010). Striatal muscarinic receptors promote activity dependence of dopamine transmission via distinct receptor subtypes on cholinergic interneurons in ventral versus dorsal striatum. J Neurosci 30, 3398–3408. [DOI] [PMC free article] [PubMed] [Google Scholar]
- Threlfell S, Lalic T, Platt NJ, Jennings KA, Deisseroth K & Cragg SJ (2012). Striatal dopamine release is triggered by synchronized activity in cholinergic interneurons. Neuron 75, 58–64. [DOI] [PubMed] [Google Scholar]
- Threlfell S & West AR (2013). Review: Modulation of striatal neuron activity by cyclic nucleotide signaling and phosphodiesterase inhibition. Basal Ganglia 3, 137–146. [DOI] [PMC free article] [PubMed] [Google Scholar]
- Usiello A, Baik JH, Rougé‐Pont F, Picetti R, Dierich A, LeMeur M, Piazza PV & Borrelli E (2000). Distinct functions of the two isoforms of dopamine D2 receptors. Nature 408, 199–203. [DOI] [PubMed] [Google Scholar]
- Valjent E, Bertran‐Gonzalez J, Herve D, Fisone G & Girault JA (2009). Looking BAC at striatal signaling: cell‐specific analysis in new transgenic mice. Trends Neurosci 32, 538–547. [DOI] [PubMed] [Google Scholar]
- Vidi PA, Chemel BR, Hu CD & Watts VJ (2008). Ligand‐dependent oligomerization of dopamine D2 and adenosine A2A receptors in living neuronal cells. Mol Pharmacol 74, 544–551. [DOI] [PubMed] [Google Scholar]
- Waelbroeck I (1999). Kinetics versus equilibrium: the importance of GTP in GPCR activation. Trends Pharmacol Sci 20, 477–481. [DOI] [PubMed] [Google Scholar]
- Watts VJ & Neve KA (1996). Sensitization of endogenous and recombinant adenylate cyclase by activation of D2 dopamine receptors. Mol Pharmacol 50, 966–976. [PubMed] [Google Scholar]
- Watts VJ, Wiens BL, Cumbay MG, Vu MN, Neve RL & Neve KA (1998). Selective activation of Galphao by D2L dopamine receptors in NS20Y neuroblastoma cells. J Neurosci 18, 8692–8699. [DOI] [PMC free article] [PubMed] [Google Scholar]
- Weiss S, Sebben M, Garcia‐Sainz JA & Bockaert J (1985). D2‐dopamine receptor‐mediated inhibition of cyclic AMP formation in striatal neurons in primary culture. Mol Pharmacol 27, 595–599. [PubMed] [Google Scholar]
- West AR & Grace AA (2002). Opposite influences of endogenous dopamine D1 and D2 receptor activation on activity states and electrophysiological properties of striatal neurons: studies combining in vivo intracellular recordings and reverse microdialysis. J Neurosci 22, 294–304. [DOI] [PMC free article] [PubMed] [Google Scholar]
- Xie K, Masuho I, Brand C, Dessauer CW & Martemyanov KA (2012). The complex of G protein regulator RGS9‐2 and Gβ(5) controls sensitization and signaling kinetics of type 5 adenylyl cyclase in the striatum. Sci Signal 5, ra63. [DOI] [PMC free article] [PubMed] [Google Scholar]
- Yagishita S, Hayashi‐Takagi A, Ellis‐Davies GC, Urakubo H, Ishii S & Kasai H (2014). A critical time window for dopamine actions on the structural plasticity of dendritic spines. Science 345, 1616–1620. [DOI] [PMC free article] [PubMed] [Google Scholar]
Associated Data
This section collects any data citations, data availability statements, or supplementary materials included in this article.
Supplementary Materials
Disclaimer: Supporting information has been peer‐reviewed but not copyedited.
Video S1. Time‐course of changes in cAMP in D1 and D2 MSNs.
Video S2. Time‐course of changes in PKA‐dependent phosphorylation level in D1 and D2 MSNs.