

Abstract
Fertilization triggers assembly of higher‐order chromatin structure from a condensed maternal and a naïve paternal genome to generate a totipotent embryo. Chromatin loops and domains have been detected in mouse zygotes by single‐nucleus Hi‐C (snHi‐C), but not bulk Hi‐C. It is therefore unclear when and how embryonic chromatin conformations are assembled. Here, we investigated whether a mechanism of cohesin‐dependent loop extrusion generates higher‐order chromatin structures within the one‐cell embryo. Using snHi‐C of mouse knockout embryos, we demonstrate that the zygotic genome folds into loops and domains that critically depend on Scc1‐cohesin and that are regulated in size and linear density by Wapl. Remarkably, we discovered distinct effects on maternal and paternal chromatin loop sizes, likely reflecting differences in loop extrusion dynamics and epigenetic reprogramming. Dynamic polymer models of chromosomes reproduce changes in snHi‐C, suggesting a mechanism where cohesin locally compacts chromatin by active loop extrusion, whose processivity is controlled by Wapl. Our simulations and experimental data provide evidence that cohesin‐dependent loop extrusion organizes mammalian genomes over multiple scales from the one‐cell embryo onward.
Keywords: chromatin structure, cohesin, loop extrusion, reprogramming, zygote
Subject Categories: Cell Cycle; Chromatin, Epigenetics, Genomics & Functional Genomics; Development & Differentiation
Introduction
Chromatin is assembled and reprogrammed to totipotency in the one‐cell zygote that has the potential to generate a new organism. The chromatin template upon which higher‐order structure is built in the embryo is different for the maternal and paternal genomes at the time of fertilization. The maternal genome is inherited from the meiosis II egg in which chromosomes are condensed in a mitotic‐like state. In contrast, the paternal genome is contributed from compacted sperm chromatin that is extensively remodeled upon fertilization, as protamines are evicted and naïve nucleosomal chromatin is established (Rodman et al, 1981). The two genomes are reprogrammed as separate nuclei with distinct epigenetic signatures at the zygote stage (Mayer et al, 2000; Oswald et al, 2000; van der Heijden et al, 2005; Torres‐Padilla et al, 2006; Ladstätter & Tachibana‐Konwalski, 2016). With the exception of imprinted loci, differences in chromatin states are presumably eventually equalized to facilitate the major zygotic genome activation (ZGA), which occurs at the two‐cell stage in mice (Aoki et al, 1997; Hamatani et al, 2004; Inoue et al, 2017). The establishment of zygotic genome architecture is therefore likely important for transcriptional onset and embryonic development.
Higher‐order chromatin structures including chromatin loops, topologically associating domains (TADs), and compartmentalization of active and inactive chromatin are established during embryonic development (Du et al, 2017; Flyamer et al, 2017; Hug et al, 2017; Ke et al, 2017). Using single‐nucleus high‐resolution chromosome conformation capture (snHi‐C), we previously identified the presence of loops and TADs in mouse zygotes and oocytes (Flyamer et al, 2017) by averaging contact maps over the positions of annotated TADs and loops (Rao et al, 2014). In contrast, bulk Hi‐C of mouse zygotes detected only weak or obscure domain structures that strengthened during preimplantation development (Du et al, 2017; Ke et al, 2017). However, it is not clear whether these bulk Hi‐C approaches would detect the TADs and loops that are expected to form in interphase germinal vesicle‐stage meiosis I oocytes (Flyamer et al, 2017). A combination of biological and technical factors, including smaller cell numbers used to analyze zygotes compared to blastocysts and different analyses of TAD aggregation data, may limit the detection of higher‐order chromatin structures by bulk Hi‐C (Du et al, 2017; Ke et al, 2017). Interestingly, TADs or loops are not detected in the rapidly dividing nuclei in early Drosophila embryos (Hug et al, 2017), or in metaphase II oocytes with condensed chromosomes (Du et al, 2017; Ke et al, 2017). Mitotic chromosomes in HeLa cells also lack TADs and loops, suggesting that this feature is not specific to meiosis II oocytes (Naumova et al, 2013). Therefore, which higher‐order chromatin structures are assembled in mammalian zygotes remains unresolved and the mechanisms that establish these structures in embryos are not known.
Studies in other cell types are beginning to provide insights into possible mechanisms that lead to the establishment of higher‐order chromatin structures. An early stepping‐stone toward understanding chromatin structure was the unexpected finding that the cohesin complex, known to be essential for sister chromatid cohesion, is expressed in post‐mitotic cells (Wendt et al, 2008). Cohesin is a tripartite ring consisting of Scc1‐Smc3‐Smc1. The cohesin ring is loaded onto chromatin by a loading complex composed of Nipbl/Scc2 and Mau2/Scc4 and is released from chromosomes by Wapl (Ciosk et al, 2000; Gandhi et al, 2006; Kueng et al, 2006; Tedeschi et al, 2013). Mutations in Nipbl cause Cornelia de Lange syndrome (CdLS), which is characterized by gene expression defects and altered chromatin compaction but no obvious defects in sister chromatid cohesion (Krantz et al, 2004; Tonkin et al, 2004; Musio et al, 2006; Deardorff et al, 2007; Nolen et al, 2013). Therefore, the idea emerged that cohesin may have roles beyond holding sister chromatids together. The discovery that cohesin colocalizes with CTCF and mediates its transcriptional insulation led to the conceptual advance that cohesin may hold DNA together not only between sister chromosomes but also in cis, within chromatids (Parelho et al, 2008; Wendt et al, 2008). This is supported by the finding that depletion of Wapl leads to an increased residence time of chromosome‐bound cohesin; moreover, it causes the formation of prophase‐like chromosomes with cohesin‐enriched axial structures termed “vermicelli” in G0 cells and affects chromosome condensation (Lopez‐Serra et al, 2013; Tedeschi et al, 2013). This discovery suggested that cohesin organizes intra‐chromatid loops in interphase.
Chromosome conformation capture (3C)‐based methods described interphase TAD structures with cohesin and CTCF enrichment at the boundaries (Dixon et al, 2012; Nora et al, 2012; Rao et al, 2014; Vietri Rudan et al, 2015). These observations led to the testable prediction that cohesin is required for TAD formation. Cohesin depletion approaches including HRV protease‐mediated cleavage, siRNA knockdown, or conditional genetic knockout in cycling and differentiated cells had only minor effects on chromatin structure (Seitan et al, 2013; Sofueva et al, 2013; Zuin et al, 2014), suggesting either that cohesin is not essential for TAD formation or that protein depletion was inefficient. However, it was recently shown that auxin‐inducible cohesin degradation leads to loss of TADs and loops in cancer cell lines (Rao et al, 2017; Wutz et al, 2017). Genetically knocking out the cohesin loading complex subunits Nipbl in post‐mitotic liver cells and Mau2 in HAP1 cells also diminished the strength of TADs and loops (Haarhuis et al, 2017; Schwarzer et al, 2017).
A mechanism explaining the formation of TADs and loops is provided by the loop extrusion model. In this model (Sanborn et al, 2015; Fudenberg et al, 2016), dynamic chromatin loops are created in cis by loop‐extruding factors (LEFs). When a LEF binds to chromatin, it starts to translocate along the fiber in both directions, connecting successively further points, thus extruding a loop (Fig 1A). Translocation of loop extruders is hindered by boundary elements often located at TAD boundaries. Individual extruded loops are stochastic and can neither be visible in population Hi‐C nor distinguished from other contacts in snHi‐C. Loop extrusion, however, leads to enrichment of contacts within TADs and recapitulates peaks of contact frequency commonly referred to as loops (Fig 1B). Cohesin is hypothesized to act as a loop extruder in interphase, while CTCF is likely the most prominent boundary element in mammalian cells (Sanborn et al, 2015; Fudenberg et al, 2016; Hansen et al, 2017; Nora et al, 2017).
Figure 1. Relationship between single‐cell and population Hi‐C maps in light of the loop extrusion model.
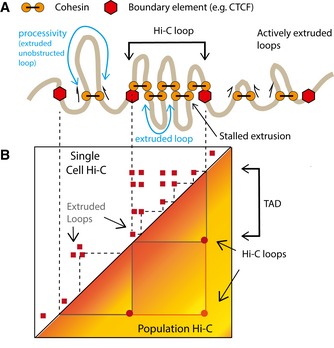
- A schematic illustration for the loop extrusion mechanism. The model posits that cohesin (the LEF) processively extrudes chromatin loops and is hindered by other cohesins or boundary elements such as CTCF.
- We illustrate the distinction between cohesin‐extruded loops which result in variable contacts in single‐cell maps and Hi‐C loops which represent a population‐average picture of extruded loops stalled at boundary elements. TADs in population Hi‐C maps are generated by cohesin‐extruded loops.
Here, we provide evidence that cohesin‐dependent loop extrusion organizes higher‐order chromatin structures of mammalian zygotic genomes. We show that cohesin is essential for chromatin loops and TADs but not compartments and other large‐scale zygote‐specific structures in one‐cell embryos. We find that inactivating cohesin release by Wapl depletion exacerbates differences in loop strengths between the maternal and paternal genomes that may be related to reprogramming. Remarkably, simulations indicate that most differences in global organization between the two zygotic genomes can be driven by changes in cohesin density and loop extrusion processivity. We further discovered that cohesin limits inter‐chromosomal interactions by compacting chromatin; simulations indicate that this effect is due to altering the effective surface of chromosomes. We propose that cohesin‐dependent loop extrusion organizes chromatin at multiple genomic scales from the mammalian one‐cell embryo onward.
Results
Loops, TADs, and compartments are formed as early as in one‐cell embryos
Using snHi‐C, we recently found that mouse zygotic genomes are organized into chromatin loops, TADs, and compartments as early as G1 phase (Flyamer et al, 2017; Fig 2A). However, bulk Hi‐C of zygotes detected few or obscure TAD structures until around the eight‐cell stage (Du et al, 2017; Ke et al, 2017). To attempt to resolve this conflict, we re‐analyzed these recent data (Du et al, 2017; Ke et al, 2017).
Figure 2. Zygotic chromatin is organized into loops, TADs, and compartments that change during the first cell cycle.
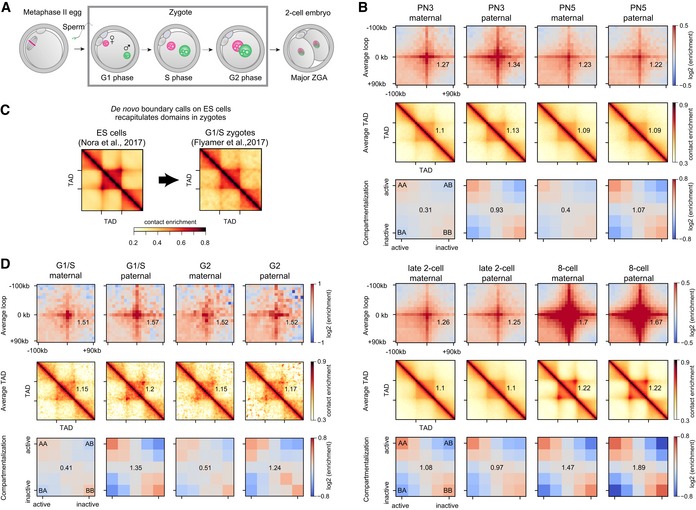
- Embryonic development from fertilization of the metaphase II egg by sperm, to zygote formation and division, to the two‐cell embryo. Maternal and paternal genomes form separate nuclei in the zygote. The major zygotic genome activation (ZGA) occurs in the two‐cell mouse embryo.
- Average chromatin loops, TADs, and compartments are detectable in maternal and paternal chromatin from the one‐cell embryo onward; data re‐analyzed from Du et al (2017). Zygotic pronuclear stage 3 (PN3) and stage 5 correspond to S phase and G2 phase, respectively. The average strength of each feature is shown inset into each corresponding panel (see Materials and Methods).
- We de novo annotated TAD boundaries (see Materials and Methods) in mouse ES cells (Nora et al, 2017) and show that TADs in wild‐type zygotes are detected (Flyamer et al, 2017). To further verify that TAD detection in zygotes is insensitive to the choice of annotated boundaries, see Fig EV1.
- The strength of average loops, TADs, and compartments becomes more similar between the maternal and paternal genomes as the zygotic cell cycle progresses (G1/S: Flyamer et al, 2017; G2: this work; n(maternal) = 18 and n(paternal) = 13 nuclei, based on two independent experiments using five and six females). The average strength of each feature is shown inset into each corresponding panel (see Materials and Methods).
Source data are available online for this figure.
Loop and TAD locations are generally conserved across cell types (Dixon et al, 2012; Rao et al, 2014) but are unknown in zygotes. Therefore, to uncover higher‐order chromatin organization in zygotes, we used a list of loop loci identified in CH12‐LX cells (Rao et al, 2014). For Hi‐C data on low numbers of cells (Ulianov et al, 2017), loops and TADs are most visible when averaged over multiple positions (Flyamer et al, 2017) and normalized relative to control regions that are selected from random shifts of loop loci (Appendix Fig S1A). Using our approach, we found that these data support the presence of loops and TADs in eight‐cell, two‐cell, and even one‐cell embryos (Fig 2B; Appendix Fig S1B) and are in agreement with previous findings that TADs and loops become stronger with progressing development (Du et al, 2017; Ke et al, 2017). To exclude that these results are biased toward TADs called in CH12‐LX cells (Rao et al, 2014), we extended the analysis to include TADs called de novo in a variety of cell types including ES cells (Nora et al, 2017; Figs 2C and EV1). We found that all de novo TAD calls, on over 15 data sets and multiple cell types, resulted in contact enrichments in all of the wild‐type zygote data sets (Figs 2C and EV1; this work, Du et al, 2017; Flyamer et al, 2017; Ke et al, 2017). Notably, contact enrichments were absent in metaphase II oocytes (Du et al, 2017), which, like mitotic cells, harbor condensed chromosomes (see Fig 2A) that presumably lack TADs (Naumova et al, 2013). Further, we discovered that zygotes lacking cohesin also do not form contact enrichments (see below).
Figure EV1. Average TADs called in many cell types show enrichments in zygote Hi‐C and snHi‐C.
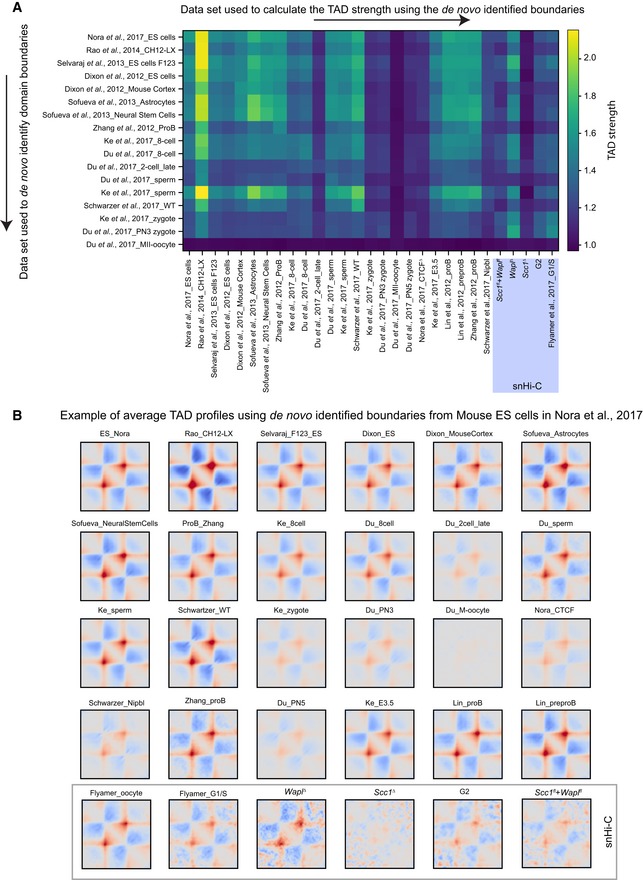
- TAD boundaries were de novo identified in many cell types and Hi‐C data sets using the corner score as described in Schwarzer et al (2017) using the lavaburst software. The de novo identified boundaries were used to generate average TAD profiles (shown in B), and the TAD strength was computed (see Materials and Methods). Notably, all data sets showed enrichments for TADs for all identified boundaries except MII oocytes (Du et al, 2017) which are in mitosis and are not expected to have TADs (Naumova et al, 2013), and our Scc1 ∆ zygotes. All TAD strength analyses for snHi‐C data sets are highlighted (purple box).
Source data are available online for this figure.
In addition to this aggregate averaging analysis, we have visually identified certain genomic regions with TAD structures in heatmaps of bulk Hi‐C zygote data (Fig EV2; Du et al, 2017; Ke et al, 2017), suggesting that this organization can be detected independently of aggregate analysis. Together, these findings strongly support the folding of zygotic genomes into higher‐order chromatin structures.
Figure EV2. TAD‐like structures can be directly seen in zygote population Hi‐C.
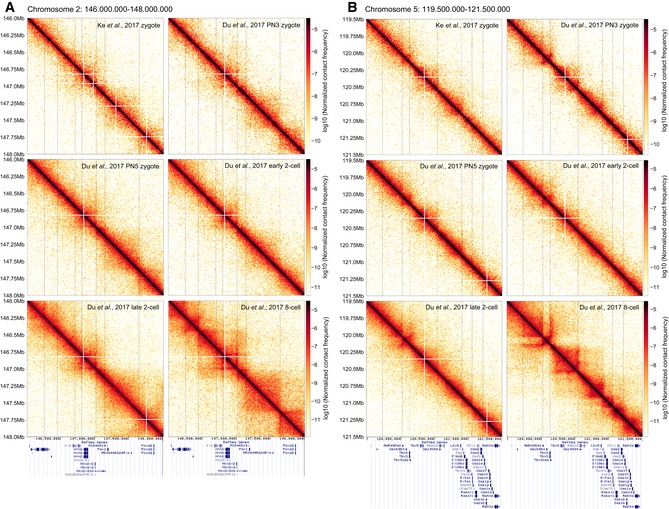
- An example region on chromosome 2 is shown for zygotic, two‐cell, and eight‐cell embryos, illustrating that in bulk Hi‐C data (Du et al, 2017; Ke et al, 2017), it is possible to identify enrichments of contacts resembling TADs and loops. Vertical lines are drawn to guide the eye and compare the locations of boundaries visually identified in the Du et al (2017) eight‐cell data. RefSeq gene annotation from the UCSC Genome Browser is shown below.
- The same as panel (A) but for an example region on chromosome 5.
Zygotic genome architecture changes during the first cell cycle
Higher‐order zygotic chromatin structure is established de novo for paternal chromatin and re‐established after chromosome decondensation for the maternal genome. We noted that loops visually differed in strength between the parental genomes in G1 phase, with stronger loops seen in paternal chromatin (Fig 2B and D). However, these were not significantly different using a conservative statistical test for differences in loop strength (P = 0.28 with Flyamer et al (2017) G1/S data, and P = 0.34 with Du et al (2017) PN3 data; permutation test; Materials and Methods). It is conceivable that loops, TADs, and compartments change during the first cell cycle. To test this, we performed snHi‐C of nuclei isolated from G2‐phase zygotes (Fig 2D; see also Tables EV1 and EV2). We found that zygotic genomes are organized into TADs, loops, and compartments in G2 (Fig 2D), like in G1 phase. However, average loop and TAD strengths had further equalized between the parental genomes by G2 phase (Fig 2B and D; P = 0.88 with our G2 data and P = 0.62 with Du et al (2017) PN5 data; permutation test) and were not significantly different from G1 (P > 0.055, by the permutation test). To probe loops on a finer scale, we separated them into small (100–150 kb), intermediate (150–250 kb), and large (250–500 kb) and computed average loops for each distance. We found that paternal chromatin has higher contact frequency than maternal primarily for small‐ and intermediate‐length loops in G1 (Appendix Fig S1C; P < 0.05, bootstrapping), which could be a consequence of loop formation following protamine–histone exchange on sperm chromatin.
Likewise, compartment strengths differ between the maternal and paternal genomes in G1/S phase (Fig 2B and D), with maternal being much weaker and almost absent. In contrast to average loop and TAD strengths, a difference between maternal and paternal compartmentalization persisted through G2 (Fig 2B and D), consistent with recent reports (Du et al, 2017; Ke et al, 2017). We thus conclude that any initial differences in loop and TADs between zygotic maternal and paternal genomes become less evident by the end of the first cell cycle.
Cohesin is essential for zygotic chromatin folding into loops and domains
To gain insights into the mechanisms that generate zygotic genome architecture, we tested whether the candidate loop‐extruding factor cohesin is required for the formation or maintenance of loops and domains. We used a genetic knockout approach based on (Tg)Zp3‐Cre, which conditionally deletes floxed alleles during the weeks of oocyte growth and generates maternal knockout zygotes after fertilization (Fig 3A). We have previously shown that Scc1 protein is efficiently depleted and sister chromatid cohesion fails to be established in Scc1 ∆(m)/+(p) zygotes (hereafter referred to as Scc1 ∆ according to the maternal allele; see Fig EV3B and Ladstätter & Tachibana‐Konwalski, 2016). Since sister chromatid cohesion is maintained by Rec8‐cohesin in oocytes (Tachibana‐Konwalski et al, 2010; Burkhardt et al, 2016), Scc1 depletion has no effect on chromosome segregation prior to fertilization, and therefore, a clean Scc1‐cohesin knockout zygote is generated.
Figure 3. Conditional genetic knockouts of Scc1 and Wapl reveal cohesin's essential role in the formation of loops and TADs in mouse zygotes.
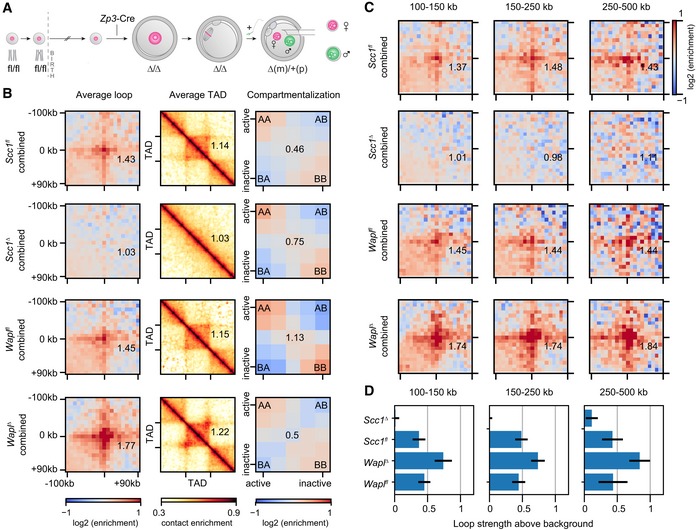
- Generation of conditional genetic knockout oocytes by Zp3‐Cre recombinase in post‐recombination growing‐phase mouse oocytes. Fertilization produces maternal knockout zygotes (maternal (m) and paternal (p) alleles). Maternal and paternal nuclei are extracted from zygotes before being subjected separately to snHi‐C.
- Average loops, TADs, and compartments in control (Wapl fl and Scc1 fl), Scc1 ∆, and Wapl ∆ zygotes. Both maternal and paternal data are shown pooled together. Data are based on n(Wapl fl) = 17, n(Wapl ∆) = 17, n(Scc1 fl) = 30, and n(Scc1 ∆) = 45 nuclei, from at least two independent experiments using two to three females per genotype each.
- Average loops, separated by size for control, Scc1 ∆, and Wapl ∆ zygotes for maternal and paternal data pooled together.
- Loop strengths for heatmaps above, defined as the fractional enrichment above background levels (see Materials and Methods). Error bars displayed are the 95% confidence intervals obtained by bootstrapping pooled single‐cell loops.
Source data are available online for this figure.
Figure EV3. Additional information on conditional knockouts.
- Loop strengths were calculated using the three 60 × 60 kb square regions shown. The average value within the middle box (black) was divided by the average of the combined top‐left and bottom‐right (green) boxes. The resulting number was subtracted by 1 to indicate the fractional increase in loop strength above the background.
- Immunofluorescence staining of Scc1 in in situ fixed Scc1 fl (n = 11) and Scc1 ∆ zygotes (n = 12, from one experiment using two females of each genotype). DNA in magenta; Scc1 in gray/green. Images were adjusted in brightness/contrast in the individual channels using ImageJ. Scale bars: 10 μm. Left: single z‐slice of zygotes. Right: single z‐slice of the maximum cross‐sectional area of maternal and paternal nuclei. Cropped area is indicated.
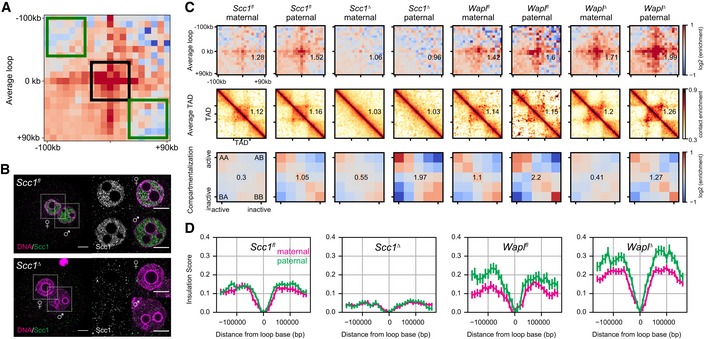
- Loops, TADs, and compartment saddle plots for the Scc1 fl, Wapl fl, Scc1 ∆, and WaplΔ conditions are shown separately for the maternal and paternal data. The average strength of each feature is indicated in each panel. Data shown are based on n(Wapl fl, maternal) = 7, n(Wapl fl, paternal) = 6, n(WaplΔ, maternal) = 8, n(WaplΔ, paternal) = 7, n(Scc1 fl, maternal) = 13, n(Scc1 fl, paternal) = 17, n(Scc1 ∆) = 28, and n(Scc1 ∆) = 17 nuclei, from at least two independent experiments using two to three females per genotype each.
- Insulation scores calculated with a sliding diamond of size 40 kb, with the “zero” position denoting a domain boundary identified previously in CH12‐LX cells (Rao et al, 2014). Distances are reported in base pairs from a domain boundary. The average over all domain boundaries is reported; error bars are the standard error on the mean insulation score.
Source data are available online for this figure.
To test whether Scc1 is essential for TADs and loops in zygotes, we performed snHi‐C (Flyamer et al, 2017) on genetically modified embryos. Both chromatin structures were detectable in control Scc1 fl zygotes (Fig 3B). Remarkably, TADs and loops were largely, if not entirely, absent in Scc1 ∆ zygotes, in both maternal and paternal nuclei (Figs 3B and EV3C). In contrast, compartmentalization of active and inactive chromatin from both maternal and paternal genomes was increased over 1.8‐fold in Scc1 ∆ compared to controls (Fig EV3C). We conclude that cohesin is essential for loops and domains and antagonizes compartmentalization, consistent with the notion that independent and possibly competing mechanisms generate these higher‐order chromatin structures (Haarhuis et al, 2017; Nora et al, 2017; Nuebler et al, 2017; Schwarzer et al, 2017; Wutz et al, 2017).
Wapl controls the size of cohesin‐dependent chromatin loops
The loss of loops and domains in the absence of cohesin could either be due to an indirect effect, for example, on gene expression, or reflect a direct requirement for cohesin in loop formation or maintenance. The loop extrusion model predicts that increasing the residence time of cohesin on chromosomes strengthens existing loops and promotes the formation of longer loops in a population of cells (Fudenberg et al, 2016). The residence time of cohesin on chromatin can be increased more than 10‐fold by inactivating cohesin release through Wapl depletion (Tedeschi et al, 2013). To test whether TADs and loops in zygotes are enhanced by inactivating release of chromosomal cohesin, we generated Wapl ∆(m)/+(p) (Wapl ∆) zygotes using the same strategy as described for Scc1 (Fig 3A). The genetic deletion efficiency of Wapl is > 98% (n = 85 mice) (M. da Silva, J. M. Peters, personal communication), though we could not quantify the extent of protein depletion due to lack of Wapl antibodies that recognize the endogenous protein by immunofluorescence. We performed snHi‐C of S/G2‐phase Wapl ∆ zygotes and compared these to control data from Wapl fl zygotes, which are wild‐type for Wapl. Both TADs and loops were stronger in Wapl ∆ compared to control zygotes (Figs 3B and EV3C; see also Tables EV1 and EV2), in agreement with what has been observed in Wapl ∆ HAP1 and Wapl RNAi HeLa cells (Haarhuis et al, 2017; Wutz et al, 2017). Although formally we cannot exclude that these effects are due to changes in gene expression, the most parsimonious explanation is that the effect of cohesin is direct; this accounts for the fact that cohesin depletion results in loss of TADs and loops, and increasing cohesin residence time by Wapl depletion results in stronger TADs and loops. Consistent with this, Nipbl depletion leads to loss of TADs and loops irrespective of changes in gene expression (Schwarzer et al, 2017). We conclude that cohesin release from chromosomes by Wapl is essential for regulating TADs and other local chromatin structures.
In addition to an effect on loops and TADs, we also observe that in the absence of Wapl, compartments became weaker than in controls by over 1.7‐fold in both paternal and maternal genomes (Figs 3A and EV3C). These observations lend further support to the idea that cohesin antagonizes compartmentalization, and are consistent with data and simulations in recent work (Haarhuis et al, 2017; Nuebler et al, 2017).
We next tested whether inactivating cohesin release from chromosomes causes changes to average strengths of loops. We found that loops are stronger in pooled Wapl ∆ zygote data compared to controls for all tested genomic distances (Fig 3C and D; P < 0.05, by bootstrapping). Interestingly, unlike for controls in which loop strength was invariant with increasing distance, Wapl ∆ zygotes displayed increasing loop strength from short to large distances with up to 80% enrichment of contacts above background levels (Fig 3D). These results are consistent with the loop extrusion mechanism and suggest that in wild‐type cells, Wapl limits the extent of loop extrusion by releasing cohesin from chromosomes, impeding the amount of chromatin‐associated cohesin and its processivity. Altogether, we conclude that cohesin directly regulates loop and domain formation or maintenance in the one‐cell embryo.
Cohesin organizes chromosomes at the sub‐megabase scale
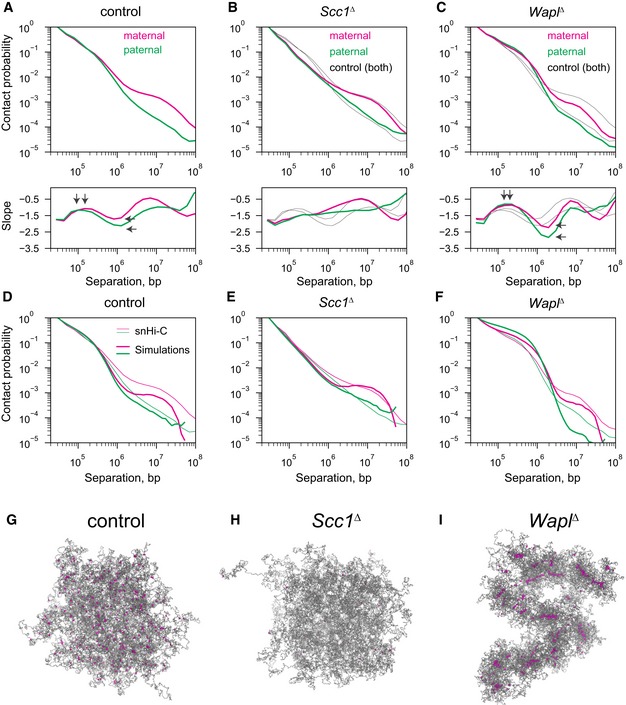
To further investigate how cohesin shapes genome architecture, we studied the genome‐wide contact probability, Pc(s), for chromatin loci separated by genomic distances, s. Consistent with our previous observations of wild‐type zygotes (Flyamer et al, 2017), control cells have a Pc(s) curve that changes slowly below 500 kb, reflecting local chromatin compaction; it changes steeply at or after 500 kb in both maternal and paternal chromatin and exhibits another plateau near 10 Mb in maternal chromatin, likely reflecting long‐range chromatin interactions remaining from compaction to the mitotic state (Fig 4A; Appendix Fig S2; see also Tables EV1 and EV2; Naumova et al, 2013; Flyamer et al, 2017). Interestingly, the Pc(s) curve of Scc1 ∆ zygotes lost the shallow < 1 Mb region and followed a power law of s−1.5, up to 1 Mb in both maternal and paternal genomes; the power law stretched up to 10 Mb in paternal chromatin (Fig 4B; Appendix Fig S2). This indicates that in the absence of cohesin, zygotic chromatin resembles a three‐dimensional random walk as previously observed in yeast (Tjong et al, 2012; Halverson et al, 2014; Mizuguchi et al, 2014). Conversely, in Wapl ∆ zygotes, the contact probability was enriched and more shallow up to ~300 kb further than in controls (Fig 4C). Contact probability features at > 10 Mb remain largely unchanged in both Scc1 ∆ and Wapl ∆ Pc(s) curves. Therefore, differences in long‐range interactions (> 10 Mb) between maternal and paternal chromatin are cohesin‐independent. Thus, we conclude that cohesin is directly involved in shaping the Pc(s) curve up to ~1 Mb, and its effect is a deviation in contact probability above the s−1.5 power law in mouse zygotic chromatin.
Figure 4. Differences in genome‐wide contact probability, Pc(s), for chromatin loci separated by genomic distances, s, between conditions.
-
A–CExperimental Pc(s) for maternal and paternal chromatin for Scc1 control, Scc1 ∆, and Wapl ∆ conditions. Black solid lines in (B and C) show the control curves as a reference to guide the eye. Slopes of the log(Pc(s)) curves for each condition are shown in the subpanel below each Pc(s) plot. Vertical arrows on the slope subpanels indicate the maximum slope, which is used to infer the average size of cohesin‐extruded loops; this analysis indicates that the average extruded loop size is approximately 60–70 kb in control zygotes and increases in the Wapl ∆ condition to over 120 kb. Horizontal arrows on the slope panels indicate the minimum slope, which can indicate cohesin linear density on the chromatin; notably, neither maternal nor paternal Scc1 ∆ zygotes have a minimum slope suggesting very low cohesin density, whereas minima exist in both control and Wapl ∆ conditions. Data are based on n(Wapl fl, maternal) = 7, n(Wapl fl, paternal) = 6, n(Wapl ∆ , maternal) = 8, n(Wapl ∆ , paternal) = 7, n(Scc1fl, maternal) = 13, n(Scc1 fl, paternal) = 17, n(Scc1 ∆, maternal) = 28, and n(Scc1 ∆, paternal) = 17 nuclei, from at least two independent experiments using two to three females per genotype each.
-
D–FSimulated chromatin Pc(s) for the control, Scc1 ∆, and Wapl ∆ conditions. Simulation Pc(s) curves shown in thick lines and experimental Pc(s) curves in thin lines.
-
G–IRepresentative images of the simulated paternal chromatin fiber used for the Pc(s) calculations in panels (D–F). The chromatin fiber is colored in gray, and the locations of the cohesins are colored in purple.
Source data are available online for this figure.
Average extruded loop sizes can be derived from Pc(s) curves and simulations
To help elucidate the mechanism of loop formation by cohesin, we developed a new method for analysis of Pc(s) curves aiming to derive sizes of extruded loops and linear density of cohesin. We developed and tested this method using polymer simulations of loop extrusion, where sizes of loops and linear density of extruders are either set or can be directly measured. Our analysis shows that average loop sizes and cohesin density can be found by studying the derivative of the Pc(s) curve in log–log space, that is, the slope of log(Pc(s)) (Fig EV4A): The location of the maximum of the derivative curve (i.e., position of the smallest slope) closely matches the average length of extruded loops, and the depth of the local minimum at higher values of s increases with the linear density of loop‐extruding cohesin in simulated chromatin (Fig EV4A). Note that sizes of extruded loops are smaller than the processivity of each cohesin, defined as the loop size extruded by unobstructed cohesin, suggesting some degree of crowding of cohesins on DNA (Appendix Fig S3), as expected theoretically (Fudenberg et al, 2016; Goloborodko et al, 2016) and illustrated schematically (Fig 1). We validate this approach using recent population Hi‐C data for Wapl ∆ and control HAP1 cells (Haarhuis et al, 2017; Fig EV4B). We demonstrate that a twofold increase in cohesin density in Wapl ∆ can be inferred from the Pc(s) curves, which matches experimentally measured values (Fig EV4A and B; see fig 4E in Haarhuis et al, 2017); moreover, we infer that the average size of an extruded cohesin loop in the HAP1 cells is ~120 kb in controls and ~300 kb in the Wapl ∆ condition.
Figure EV4. Genome‐wide contact probability, Pc(s), for chromatin loci separated by genomic distances, s, underlying maternal WaplΔ simulation.
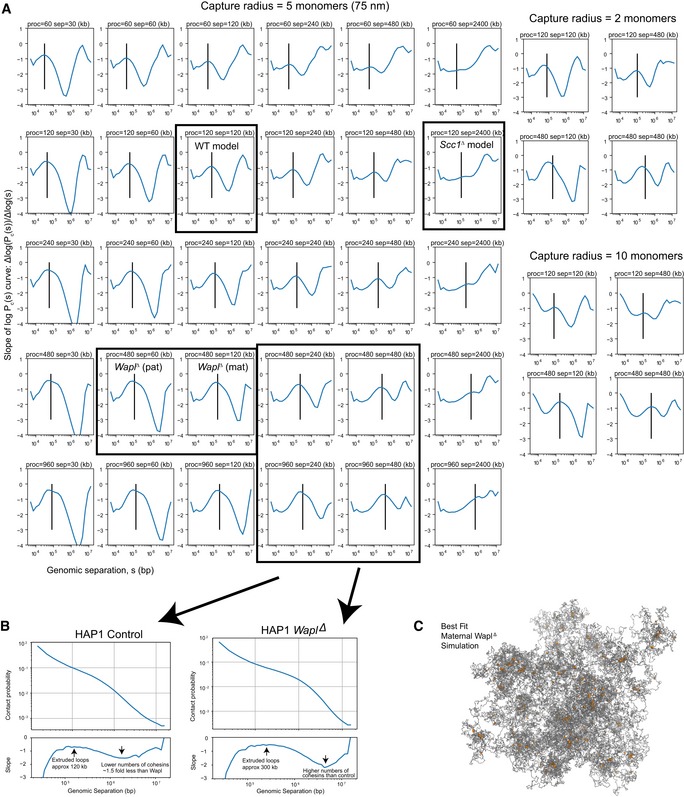
- Slopes of Pc(s) curves as a function of genomic separation for polymer models of N = 30,000 monomers with loop extrusion. The rows show different loop extrusion processivities (proc), and columns show different linear separations (sep) between cohesins; the latter is related to the number of cohesins via the relation: separations = (chromosome length)/(number of bound cohesins). The vertical line on each plot indicates the average extruded loop length. All Pc(s) plots in the left six rows/columns were calculated for a Hi‐C contact radius of 5 monomers (75 nm). Plots on the right are a subset of plots on the left, for contact radius of 2 monomers (30 nm) and 10 monomers (150 nm), indicating that the inferred average extruded loop length does not vary significantly with the choice of Hi‐C capture radius. Note that average extruded loop length is different from processivity, especially in a dense regime where processivity is greater than separation; due to stalling of cohesins when encountering each other and at simulated TAD boundaries, the average loop length then becomes less than processivity; see Goloborodko et al (2016) for details.
- The analysis of the slope of log(Pc(s)) applied on recently published WaplΔ Hi‐C data (see Haarhuis et al, 2017). Consistently with experimental FRAP data (Haarhuis et al, 2017), we find that in WaplΔ conditions, the processivity, which is linearly related to the chromatin‐bound lifetime of cohesin, is increased > 2 above control conditions. Similarly, we find that the number of bound cohesins is > 1 but less than twofold enriched above controls in WaplΔ; this is consistent with quantitative immunofluorescence data, showing a 1.5‐fold enrichment for cohesins in WaplΔ versus controls (Haarhuis et al, 2017).
- A representative image of the maternal WaplΔ simulation. The chromatin fiber is colored in gray, and the locations of the cohesins are colored in orange, indicating that some cohesin vermicelli is visibly formed.
Source data are available online for this figure.
We note that the extruded loops with the average size < 300 kb are different from peaks of Hi‐C contact frequency, also referred to as “loops”, that are typically formed by CTCF‐rich TAD boundaries located up to 1 Mb from each other. Such peaks of interactions between boundaries also arise in simulations; they rarely represent a single boundary‐to‐boundary loop and are typically formed by a collection of much smaller cohesin‐extruded loops that have bumped into each other and have stopped at TAD boundaries (Fig 1A). Due to the stochastic nature of cohesin loading and extrusion, the location of individual extruded loops formed by stalled cohesin varies from cell to cell and is not visible as an enrichment in Hi‐C maps (Fig 1B). These loops, however, bring two boundaries closer to each other, and since boundary locations are set genomically, enrichment on interactions between boundaries becomes visible as peaks in Hi‐C maps (here referred to as “Hi‐C loops”). In all, this new method for analysis of Pc(s) curves provides a framework for the interpretation of genome‐wide contact probability and is complementary to identification of contact frequency peaks (“Hi‐C loops”) visible in Hi‐C maps.
Loop extrusion leads to differences in compaction of maternal and paternal chromatin
Interpreting our zygote data using the Pc(s) curve analysis, we estimated that loop extrusion by cohesin results in an average extruded loop size of 60–70 kb in control G1 zygotes (Fig 4A). In contrast, in Wapl ∆ zygotes, the length of loops extruded by cohesin was doubled to 120 kb, whereas no loops could be detected in Scc1∆ zygote data (Fig 4B and C). As a complementary approach, we performed polymer simulations at a range of cohesin density and processivity parameters and found values that provide the best agreement between simulations and experimental data, as measured by agreement of the Pc(s) curves (Fig 4D–F): We obtain 74 kb as the average size of extruded loops for control zygotes (both maternal and paternal), 111 kb for paternal Wapl ∆ zygotic chromatin, and 165 kb for maternal Wapl ∆ zygotic chromatin. In addition, the best‐matching models provide estimates for the processivity and linear density of cohesin in these cells: For control zygotes, we obtain a processivity of 120 kb and density of one cohesin per 120 kb (assuming one cohesin per loop extrusion complex). For Wapl ∆ zygotes, we require a much higher processivity of 480 kb in both maternal and paternal zygotes and a linear density of one cohesin per 120 kb in maternal and 60 kb in paternal chromosomes. We conclude that Wapl is mostly regulating cohesin processivity, as changes in linear density may be limited by the available number of cohesin complexes per nucleus.
To examine how Hi‐C loops differ between the Wapl maternal and paternal genomes, we quantified their strength (Appendix Fig S1C) as done in Figs 2 and 3. We found that Hi‐C loop strengths generally increased in the case of both maternal and paternal genomes. Analyzing the insulation in Wapl ∆ zygotes (see Materials and Methods) also showed stronger insulation at TAD/loop borders in paternal chromatin (Fig EV3D). The stronger Hi‐C loops, stronger insulation, and higher cohesin density may all result from higher cohesin loading rate and reflect the transcriptionally permissive state specific for paternal chromatin (Adenot et al, 1997), suggesting that higher transcription leads to loading of additional cohesins, whose effects are exacerbated in Wapl ∆ where cohesin unloading is suppressed. This also suggests that transcription is not required for loop extrusion per se, as the maternal genome is thought to be transcriptionally inactive.
Next, we used microscopy to test whether these differences in loops between maternal and paternal chromatin lead to changes in chromatin compaction in Wapl ∆ zygotes. To monitor chromatin compaction, we expressed Scc1‐EGFP in Wapl ∆/∆ and Wapl fl/fl oocytes, performed in vitro fertilization, and imaged zygotes by time‐lapse microscopy (Appendix Fig S4A). Chromatin in Wapl ∆ zygotes is expected to form “vermicelli”, prophase‐like chromosomes with cohesin‐enriched axial structures that can be detected by visualization of Scc1 (Lopez‐Serra et al, 2013; Tedeschi et al, 2013). Scc1‐EGFP formed a uniform diffuse pattern in the nuclei of control zygotes (Appendix Fig S4B). In contrast, Scc1‐EGFP showed a non‐homogeneous distribution in maternal and paternal nuclei of Wapl ∆ zygotes (Appendix Fig S4C). This distribution might reflect vermicelli that are obscured due to the presence of endogenous Scc1 within cohesin complexes, leading to a high background of free Scc1‐EGFP. To ensure that all cohesin contains Scc1‐EGFP, we expressed Scc1‐EGFP in Scc1 ∆/∆ Wapl ∆/∆ oocytes (Fig 5A–C; Movies EV1 and EV2; Appendix Fig S5A and B). Indeed, this approach increased the detection of vermicelli as worm‐like structures in both nuclei of Scc1 ∆ Wapl ∆ zygotes (Fig 5B and C; Movie EV2; Appendix Fig S5C). Vermicelli‐like structures were especially evident in maternal nuclei in both Wapl ∆ and Scc1 ∆ Wapl ∆ zygotes. Vermicelli formation occurs prior to the major ZGA (Aoki et al, 1997; Hamatani et al, 2004), consistent with the idea that transcription is not essential for Hi‐C loop formation (Du et al, 2017; Ke et al, 2017). We conclude that inactivation of cohesin release leads to vermicelli formation in maternal and paternal zygotic chromatin.
Figure 5. Live‐cell imaging of vermicelli formation in wild‐type and Scc1 ∆ Wapl ∆ zygotes expressing Scc1‐EGFP and H2B‐mCherry.
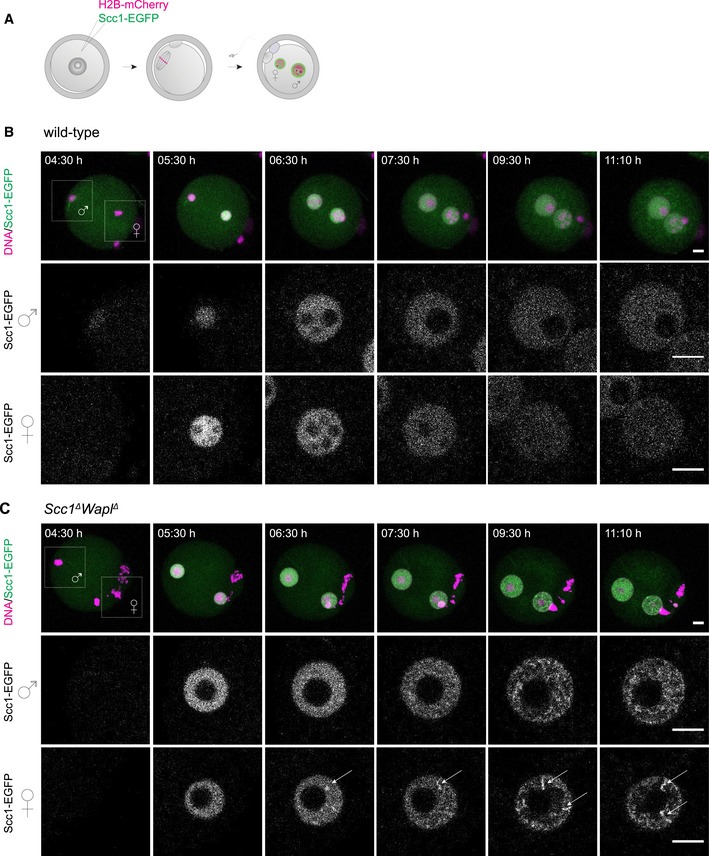
- Germinal vesicle‐stage oocytes were injected with mRNA encoding H2B‐mCherry to mark chromosomes (magenta) and Scc1‐EGFP to label cohesin (green), matured to meiosis II, fertilized in vitro, and followed by time‐lapse microscopy.
- Still images of live wild‐type zygotes expressing Scc1‐EGFP and H2B‐mCherry (n = 4 zygotes, from one experiment using two females). Top row: z‐stack maximum‐intensity projection of zygotes. Middle and bottom row: z‐slices of the cropped areas (top left) showing paternal and maternal nuclei separately. Images were adjusted in brightness/contrast in individual imaging channels in the same manner for z‐stacks and for the single z‐slices. Scale bars: 10 μm. Hours after start of IVF are given.
- Still images of live Scc1 ∆ Wapl ∆ zygotes expressing Scc1‐EGFP and H2B‐mCherry (n = 3 zygotes, from one experiment using two females). Top row: z‐stack maximum‐intensity projection of zygotes. Middle and bottom row: z‐slices of the cropped areas (top left) showing paternal and maternal nuclei separately. Arrows indicate Scc1‐EGFP‐enriched structures. Images were adjusted in brightness/contrast in individual imaging channels in the same manner for z‐stacks and for the single z‐slices. Scale bars: 10 μm. Hours after start of IVF are given.
To quantify maternal and paternal chromatin compaction, we examined DNA morphology at higher resolution in fixed zygotes. Both maternal chromatin and paternal chromatin are compacted into vermicelli‐like structures and are revealed most clearly in individual z‐sections of Wapl ∆ zygotes (Fig 6A and B). We observed a significant change in the coefficient of variation in intensity between control and Wapl ∆ zygotes (Fig 6C; Appendix Fig S6; P‐value = 1.88 × 10⁻⁷). Additional DAPI‐intense structures surrounding the prenucleolar regions were visible specifically in maximum‐intensity projections in the maternal nucleus (n = 25/33 zygotes; Fig 6A and B), indicating a higher degree of compaction in maternal than paternal chromatin. These DAPI‐intense structures likely correspond to the more prominent vermicelli observed in maternal nuclei in time‐lapse movies (Fig 5B and C; Appendix Fig S4C; Movie EV2). Quantification of the texture in images using the gray‐level co‐occurrence matrices revealed that the contrast between pixels is stronger in maternal than paternal nuclei (Fig 6D and Appendix Figs S7 and S8), implying a more structured and less homogeneous nuclear architecture. To study the DAPI‐intense structures, we performed additional segmentation analysis and compared the size distributions of identified objects between conditions and nuclei. The size of DAPI‐intense structures significantly increased in Wapl ∆ zygotes (P‐values: 1.25 × 10⁻¹¹ and 8.23 × 10⁻²⁸ for maternal and paternal nuclei, respectively; Fig 6E). Maternal nuclei contain slightly bigger objects than paternal nuclei (P‐value: 0.00014), which might reflect stronger vermicelli. We suggest that inactivating cohesin release has a differential effect on chromatin compaction of maternal and paternal chromatin.
Figure 6. Distinct maternal and paternal chromatin compaction in Wapl ∆ zygotes.
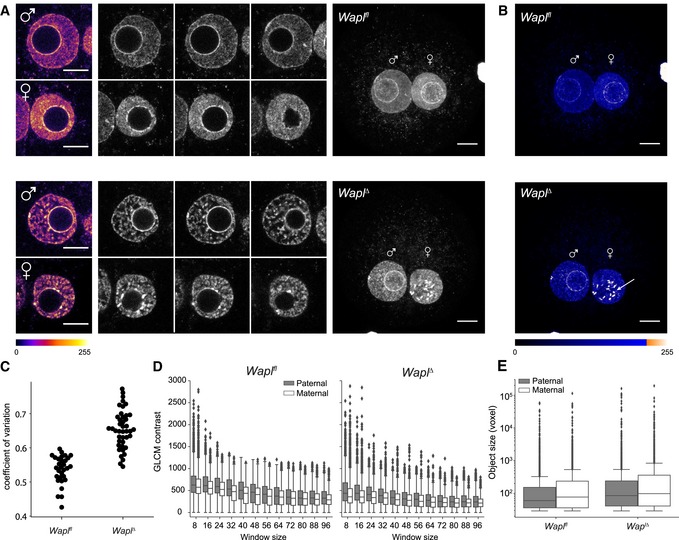
- Representative images of paternal and maternal nuclei stained with DAPI of Wapl fl (n = 15) and Wapl ∆ (n = 33) zygotes (from two independent experiments using two females per genotype; see also Appendix Fig S5). Top: Wapl fl; bottom: Wapl ∆. Left: cropped z‐slices from the middle section of the nucleus in fire lookup table (Image J). Middle: cropped z‐slices of nuclei separated by 3 μm. Right: maximum‐intensity projection (MIP) of zygotes. Settings were adjusted for z‐slices and MIP individually but in the same manner for Wapl fl and Wapl ∆ zygotes. Images were adjusted in brightness/contrast in the individual imaging channels using ImageJ. Scale bars: 10 μm.
- MIP of zygotes seen in (A) with blue ramp lookup table to visualize difference in maternal and paternal vermicelli formation around prenucleolar bodies. Arrow indicates additional DAPI‐intense structures in maternal zygotic nuclei. Images were adjusted in brightness/contrast in the individual imaging channels using ImageJ. Scale bars: 10 μm.
- Coefficient of variation of DAPI intensity for nuclei of Wapl fl (n = 15) and Wapl ∆ (n = 21) zygotes (P‐value = 1.88 × 10⁻⁷, Mann‐Whitney U‐test).
- Boxplots showing gray‐level co‐occurrence matrix (GLCM) contrast (local variation of intensity) in paternal (gray) and maternal (white) nuclei in Wapl fl (n = 15) and Wapl ∆ (n = 13) zygotes with increasing window sizes. Horizontal lines of the boxplots represent the medians, box limits show the first and third quartiles, whiskers extend by 1.5 * interquartile range from the limits of the box. Two outliers (maternal Wapl ∆ window 8) with values 3,242.7 and 4,037.4 are not shown.
- Boxplots showing size of detected bright objects (voxels) inside paternal (gray) and maternal (white) nuclei in Wapl fl (n = 15) and Wapl ∆ (n = 21) zygotes; note the log scale on y‐axis.
Source data are available online for this figure.
To corroborate the major reorganization observed by microscopy and snHi‐C in Wapl ∆ zygotes, we examined our polymer simulations of Wapl ∆ conditions to see whether the 3D organization of cohesins in modeled conformations displayed preferentially “axially enriched” structures (Appendix Fig S3). We found consistently that vermicelli are visible in the paternal Wapl ∆ chromatin simulation, but are not visible in controls (Fig 4G and I); at odds with expectations, maternal chromatin formed weaker vermicelli (Fig EV4C; Appendix Fig S3). This result suggests that some other processes beyond loop extrusion may contribute to formation of vermicelli in maternal zygotes. Nevertheless, both our snHi‐C data and microscopy show that loop formation differs for zygotic maternal and paternal genomes when cohesin release is prevented by Wapl depletion. By regulating cohesin release, Wapl thus maintains interphase chromatin in a less compact state; moreover, it restricts the size of extruded cohesin loops and density of chromatin‐associated cohesin.
Cohesin loop extrusion limits inter‐chromosomal interactions
Population and single‐cell Hi‐C studies have revealed that interactions between non‐sister chromatids (trans‐contacts) are diminished during mitosis (Naumova et al, 2013; Nagano et al, 2017). A possible interpretation is that a more compact, linearly ordered chromosome directly affects the frequency of inter‐chromosomal interactions. To investigate whether vermicelli chromosomes are more mitotic‐like, and to test whether cohesin might play a role in chromosome compaction, we quantified the levels of trans‐contacts, in zygotic chromatin by snHi‐C (Fig 7A; see Materials and Methods; Tables EV1 and EV2). We found inter‐chromosomal contact frequencies of 8% for nuclei in interphase (G1/S or G2), consistent with values reported for mouse ES cells at a similar cell cycle stage (Nagano et al, 2017). Interestingly, Wapl ∆ zygotes had reduced trans interaction fractions, with a mean value of 6% for paternal zygotic chromatin that is closer to values reported for early G1 (Nagano et al, 2017) but not significantly different from controls (P < 0.2, Mann–Whitney U‐test). In contrast, Scc1 ∆ cells showed significantly larger trans interaction fractions as compared to controls (Fig 7A; an over 40% increase, P < 0.02, Mann–Whitney U‐test). These results suggest a possible novel role for chromosomal Scc1‐cohesin in reducing interaction frequencies between non‐sister chromatids.
Figure 7. Influence of cohesin on inter‐chromosomal contacts.
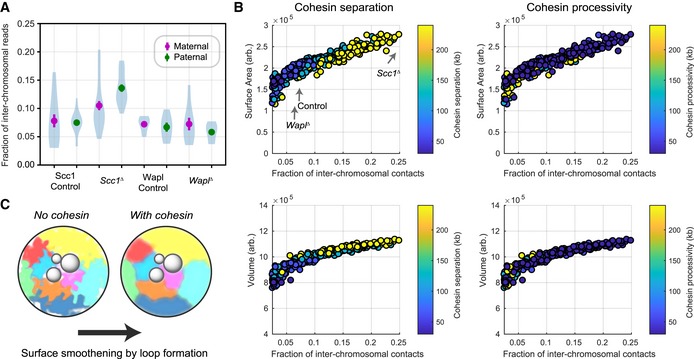
- The number of snHi‐C contacts mapping to regions on distinct chromosomes as a fraction of the total number of mapped contacts is shown for each of the experimental conditions. Error bars are the standard error of the mean. The distribution of values from individual nuclei is shown in blue as a violin plot; the maximum extent of the density distributions reflects the range of the individual data points (n(Wapl fl, maternal) = 7, n(Wapl fl, paternal) = 6, n(Wapl ∆ , maternal) = 8, n(Wapl ∆ , paternal) = 7, n(Scc1 fl, maternal) = 13, n(Scc1 fl, paternal) = 17, n(Scc1 ∆) = 28, and n(Scc1 ∆) = 17 nuclei; data are based on at least two independent experiments using 2–3 females per genotype each).
- Spatial, geometric properties of simulated chromatin undergoing loop extrusion for different loop extrusion parameters. The fraction of inter‐chromosomal contacts was calculated using a Hi‐C cutoff radius of 5 monomers (75 nm). The surface area and volume of the simulated chromatin fiber were calculated from the concave hull, and an effective radius for each monomer equal to the Hi‐C cutoff radius was used (see Materials and Methods).
- A schematic model illustrating that cohesin loop extrusion can modulate the surface area smoothness of chromosomes and reduce the frequency of inter‐chromosomal interactions.
Source data are available online for this figure.
To investigate the mechanism by which cohesin modulates inter‐chromosomal interactions, we turned to polymer simulations of loop extrusion. We tested how varying cohesin processivity and linear density affected absolute numbers of contacts within and between chromosomes (Appendix Fig S9A). We found that an increase in processivity or density of cohesins resulted in an increase in intra‐chromosomal contacts and a decrease in the absolute and relative trans‐chromosomal contacts (Appendix Fig S9A). Thus, simulations suggest that cohesin can regulate frequencies of contacts between chromosomes.
To better understand how loop extrusion that operates at the sub‐megabase scale can affect inter‐chromosomal contacts, we examined the effects of loop extrusion on the sizes of chromosomes and shapes of their surfaces (Figs 7B and 8A). We varied cohesin processivity and linear density and measured their effects on the simulated chromatin volume and surface area defined from the polygon that covers the modeled chromosomes (concave hull; see Materials and Methods). We found that an increase in processivity and linear density of cohesins from Scc1 ∆ to control to Wapl ∆ levels led to a gradual decrease in the number of trans interactions, a decrease in volume, and a decrease in surface area (Figs 7B and 8B); this trend was not sensitive to the choice of simulated Hi‐C capture radius, or chromosome monomer radius for the convex hull measurement (Appendix Fig S9B and C). Interestingly, we found that the chromosome surface area was a good predictor of the fraction of inter‐chromosomal interactions changing over 80% almost linearly from the simulated Wapl ∆ to Scc1 ∆ conditions; however, whereas volume was predictive, it changed by only 40% and was nonlinear (Fig 7B; Appendix Fig S9B).
Figure 8. Effect of loop extrusion on the simulated chromatin surface area, volume, and inter‐chromosomal interactions.
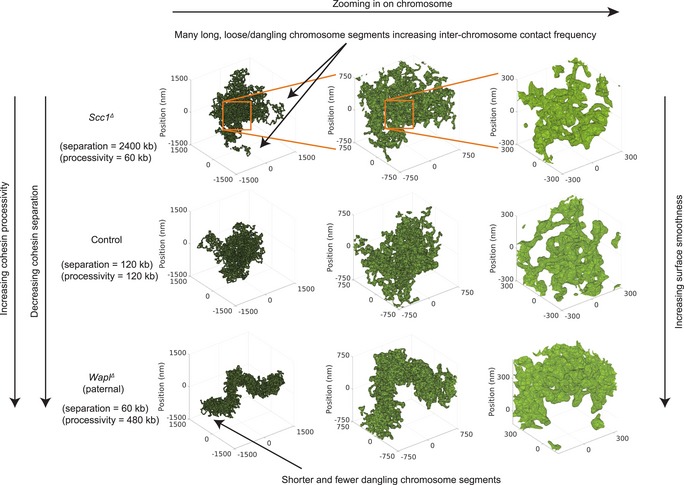
- Representative polymer conformations of simulated chromatin undergoing loop extrusion. The rendered surface is the alpha shape (concave hull polygon) created using spheres centered on chromosome monomers. The monomers have radius 75 nm, which were chosen to be equal to the simulated Hi‐C capture frequency. With increasing cohesin density and processivity, the chromosome compacts and becomes more linearly ordered and the concave hull surface becomes “smoother”.
By visualizing polymer conformations for low and high cohesin densities, we found that a decrease in the number of extruded loops led to a surface roughening, whereas increased compaction by loop extrusion smoothened out the polymer surface, resulting in fewer inter‐chromosomal contacts (Figs 7C and 8A). These simulations demonstrate that loop extrusion operating at < 1‐Mb scale can affect long‐range interactions by modulating the surface area of chromosomes, leading to changes in inter‐chromosomal interaction frequencies. Super‐resolution microscopy of continuously stained chromosomal regions may be able to observe the predicted roughening of chromosomal surfaces upon loss of cohesin.
Discussion
Our data support a direct role of cohesin in the formation or maintenance of chromatin loops and TADs. Cohesin was identified over two decades ago for its role in chromosome segregation, sister chromatid cohesion, and DNA damage repair (Peters et al, 2008). More recent studies have shown that cohesin colocalizes with CTCF and is associated with TADs and chromatin loops (Wendt et al, 2008; Dixon et al, 2012; Nora et al, 2012; Phillips‐Cremins et al, 2013; Rao et al, 2014; Hansen et al, 2017; Nora et al, 2017), which implicated cohesin as a regulator of intra‐chromosomal structure. Since chromatin loops and TADs may have functional roles in gene regulation, such as preventing aberrant expression of genes (Flavahan et al, 2015; Lupiáñez et al, 2015; Franke et al, 2016), it has become a major endeavor to understand to what degree cohesin is involved in shaping chromatin structure. Early studies directly degrading or knocking out cohesin showed only mild effects on chromatin structure (Seitan et al, 2013; Sofueva et al, 2013; Zuin et al, 2014).
We show that genetic deletion of the Scc1 subunit of cohesin in mouse oocytes abolishes formation or maintenance of loops and TADs in the one‐cell embryo. In contrast, chromatin loops are larger on average when cohesin release from chromosomes is prevented by Wapl depletion. Together, these results demonstrate that cohesin is essential for loops and TADs, and show that cohesin directly regulates their structure, consistent with recent studies that were published while this paper was under review. A recent study in a human cancer cell line (Rao et al, 2017) shows loss of loops and TADs upon acute degradation of Scc1/Rad21; similar results using this approach in HeLa cells were obtained in a recent preprint (Wutz et al, 2017). Another study of a HAP1 human cell line (Haarhuis et al, 2017) demonstrates that Wapl deletion leads to higher density of cohesin on DNA and increases contact frequency of distant Hi‐C loops. Finally, a recently published study achieved depletion of chromatin‐associated cohesin by deletion of Nipbl in post‐mitotic liver cells, which led to disappearance of loops and TADs (Schwarzer et al, 2017).
We extend these studies by uniquely obtaining both a decrease and an increase in cohesin, relative to the wild type, in the same biological system. This allowed us to gain insights into the fundamental principles of chromatin organization, developing a single polymer model that was able to reproduce chromosomal phenotypes of the three tested conditions, providing quantitative estimates of characteristics of cohesin‐mediated loop extrusion, and making predictions about the effect of loop extrusion on long‐range interactions by roughening of chromosomal surfaces. Our work also diverges from these reports in that we show cohesin is essential for forming loops and TADs starting from the one‐cell embryo, which was hitherto unclear.
Crucially, our system enabled us to study how cohesin differentially affects the establishment of higher‐order structure in maternal and paternal genomes that undergo reprogramming to totipotency. Interestingly, differences in maternal and paternal chromatin loops became more evident in Wapl ∆ zygotes. As in controls, paternal chromatin loops were stronger and TADs were more insulating than in maternal chromatin. Unlike controls, loop sizes differed by an estimated 60 kb, with longer loops present in the maternal genome. By microscopy, we also observed differences in global chromatin compaction between maternal and paternal genomes in Wapl ∆ zygotes. We speculate that the differences are due to a combination of distinct epigenetic modifications and loop extrusion dynamics.
Our data strongly support a model that cohesin forms loops and TADs by the mechanism of active loop extrusion (Sanborn et al, 2015; Fudenberg et al, 2016), and provide a quantitative rationale for the longer loop lengths in the Wapl ∆ zygotes. Our polymer simulations suggest that the key determinants for global genome organization by cohesins are their density and processivity, which is the product of residence time and extrusion velocity. Longer chromatin loop sizes in Wapl ∆ zygotes are quantitatively consistent with an about fourfold increase in cohesin processivity in the absence of Wapl, which results in an about 50% increase in the sizes of extruded loops as estimated from the derivative of log(Pc(s)). Our present data do not distinguish whether increase in processivity reflects an increase in loop‐extruding speed, residence time, or both, but this is an interesting avenue for future research. Interestingly, sizes of extruded loops are smaller than the processivity since extrusion is obstructed by interactions of boundary elements (with CTCF among them) and other chromatin‐associated cohesins. In support of the model of active loop extrusion, Wang and coworkers recently provided the first direct in vivo evidence that condensins, which are related to cohesins, actively translocate on bacterial chromatin and align flanking chromosomal DNA (Tran et al, 2017; Wang et al, 2017). A recent in vitro study has since demonstrated that eukaryotic yeast condensins are mechanochemical motors that translocate along DNA in an ATP‐dependent fashion (Terakawa et al, 2017). Thus, it is likely that eukaryotic cohesins employ active loop extrusion to form chromatin loops and TADs, but we cannot rule out the possibility that accessory factors aid the extrusion process.
In contrast to our findings, two recent reports of the higher‐order chromatin organization in mammalian embryos suggested that the mammalian zygote genome is largely unstructured (Du et al, 2017; Ke et al, 2017). In both studies, no or obscure TADs were detected in embryos before the eight‐cell stage (Du et al, 2017; Ke et al, 2017), where TADs were detected using insulation scores and directionality index analysis (Dixon et al, 2012; Giorgetti et al, 2016) with a large window size (0.5–1 Mb). We note that nonzero insulation scores or directionality indices do not necessarily reflect the existence of a TAD since these metrics cannot distinguish TADs from compartments without other information; weak compartments in zygotes can affect insulation scores or directionality indices. To further investigate whether TADs and loops exist in zygotes, we re‐analyzed data from these studies. Using known positions of TADs and loops, we identified TADs and loops at all embryonic development stages. To exclude biases introduced by TAD positions used in the analysis, we tested TADs identified in many diverse cell types as well as TADs called de novo in bulk Hi‐C of inner cell mass cells of blastocyst embryos (Du et al, 2017). Our ability to detect TADs in re‐analyses of bulk Hi‐C studies (Du et al, 2017; Ke et al, 2017) can be attributed to the higher statistical power of methods that we employed: Not only did we aggregate TADs from positions called in population Hi‐C data, but we also used observed‐over‐expected maps to correct for Pc(s) specific for the used Hi‐C map and rescaled TADs of different sizes (100 kb–1 Mb), allowing to depict the structure of the TAD body independently of TAD sizes upon averaging. The lack of rescaling of TADs (as well as different normalization) in the original analysis could have led to blurring of signal in aggregate analysis. We further validated our method by visual inspection of Hi‐C maps that showed both regions lacking contact enrichment and other regions containing domain structures. We furthermore show that the structures detected by aggregate analysis depend critically on cohesin, which is in line with its proposed role in loop and TAD formation.
Loops and TADs are weaker in zygotes than for later stage embryos, consistent with previous reports (Du et al, 2017; Ke et al, 2017). There are several possible explanations for this phenomenon, such as weaker or fewer boundary elements, lower rate of cohesin loading, or lower cohesin processivity. The difference in processivity is unlikely as our analysis suggests a similar processivity in paternal zygotic chromatin and HAP1 cells. On the other hand, we show both TAD and loop strengths are visually greater in the early G1 paternal zygotic genome, but these differences disappear in G2 as both genomes approach the major ZGA. We thus suggest that the weaker structural features seen in the zygotic genome arise due to either paucity of boundary elements for cohesin loop extrusion or lower amounts of chromatin‐associated cohesin.
Unexpectedly, we discovered that cohesin‐dependent chromosome compaction reduces inter‐chromosomal interactions in interphase. We therefore propose a model in which the surface roughness of chromosomes affects inter‐chromosomal interactions and absence of cohesin leads to more interdigitation between chromosomes. We speculate as to what might be the functional consequences of increased inter‐chromosomal interactions due to interphase chromosome decompaction. Given that topoisomerases cannot distinguish between DNA strands in cis and in trans, it is conceivable that increased number of trans interactions could lead to catenations that can be damaging during chromosome segregation. We therefore propose that the ancestral role of cohesin in forming intra‐chromosomal loops during interphase could help promote proper chromosome segregation during cell division.
Our model of cohesin as a chromatin surface area regulator also raises important new points. If the active formation of loops can reduce inter‐chromosomal interactions, then it is conceivable that loop formation creates local neighborhoods on the chromatin fiber that also reduce the frequency of interactions with more distal segments of chromatin on the same chromosome. We speculate that the formation of loops can have important implications for reducing spurious enhancer–promoter looping interactions by reducing interdigitation between distant regions of the same chromosome.
In all, our work establishes which higher‐order chromatin structures are built shortly after fertilization in the mammalian zygote. The differences in maternal and paternal loops generated by cohesin‐dependent loop extrusion provide an entry point to understanding how the two genomes change from a transcriptionally silent and terminally differentiated state to a transcriptionally active and totipotent embryonic state.
Materials and Methods
Mice
The care and use of the mice were carried out in agreement with the authorizing committee according to the Austrian Animal Welfare law and the guidelines of the International Guiding Principles for Biomedical Research Involving Animals (CIOMS, the Council for International Organizations of Medical Sciences). Mice were kept at a daily cycle of 14‐h light and 10‐h dark with access to food ad libitum. All mice were bred in the IMBA animal facility. Scc1 fl/fl mice were bred on a mixed background (B6, 129, Sv). Wapl fl/fl mice were bred on a primarily C57BL/6J background. Scc1 fl/fl Wapl fl/fl mice were bred on the same mixed background as Scc1 fl/fl mice. Experimental mice were obtained by mating of homozygous floxed females to homozygous floxed males carrying Tg(Zp3‐Cre) (Lewandoski et al, 1997; Lan et al, 2004). To obtain zygotes, B6CBAF1 stud males were mated to Scc1 fl/fl Tg(Zp3‐Cre), while C57BL/6J stud males were used for mating Wapl fl/fl Tg(Zp3‐Cre) females. Sperm for in vitro fertilization of Scc1 fl/fl Wapl fl/fl Tg(Zp3‐Cre) oocytes was obtained from B6CBAF1 stud males, sperm for in vitro fertilization of Wapl fl/fl Tg(Zp3Cre) oocytes was obtained from C57BL/6J stud males.
No statistical methods were used to estimate sample size. No randomization or blinding was used.
Zygote collection
To obtain zygotes, 3‐ to 5‐week‐old female mice were superovulated by intraperitoneal injection of PMSG (pregnant mare's serum gonadotropin; 5 IU, Folligon, Intervet or 5 IU, Prospecbio) followed by hCG (human chorionic gonadotropin; 5 IU, Chorulon, Intervet) injection 48 h later. Females were mated to wild‐type stud males overnight. The following morning, zygotes were released from the ampullae and treated with hyaluronidase to remove cumulus cells.
Single‐nucleus Hi‐C
Single‐nucleus Hi‐C was carried out as described before (Flyamer et al, 2017). After pronuclear extraction, Scc1 fl/fl Tg(Zp3‐Cre) pronuclei used in the experiments were fixed around 19–22 h post‐hCG injection (corresponding to about 7–10 h post‐fertilization) and therefore are expected to be in G1/S phase of the cell cycle. Wapl fl/fl Tg(Zp3‐Cre) were fixed later around 23–27.5 h post‐hCG injection (corresponding to about 11–15.5 h post‐fertilization) and are expected to be in S/G2 phase of the cell cycle. To obtain G2‐phase data, zygotes were fixed 27 h post‐hCG injection (corresponding to about 15 h post‐fertilization) and lysed, and pronuclei were separated into different wells after SDS lysis according to their size. No blinding or randomization was used for handling of the cells.
Briefly, after pronuclei were isolated, they were fixed in 2% formaldehyde for 15 min and then lysed on ice in lysis buffer (10 mM Tris–HCl pH 8.0, 10 mM NaCl, 0.5% (v/v) NP‐40 substitute (Sigma), 1% (v/v) Triton X‐100 (Sigma), 1× Halt™ Protease Inhibitor Cocktail (Thermo Scientific)) for at least 15 min. The pronuclei were washed once through PBS and 1× NEB3 buffer (NEB) with 0.6% SDS, in which they were then incubated at 37°C for 2 h with shaking in humidified atmosphere. Pronuclei were washed once in 1× DpnII buffer (NEB) with 2× BSA (NEB), and then, chromatin was digested overnight in 9 μl of the same solution but with 5 U DpnII (NEB). The nuclei were then washed once through PBS, then through 1× T4 ligase buffer (50 mM Tris–HCl, 10 mM MgCl2, 1 mM ATP, 10 mM DTT, pH 7.5). The nuclei were incubated in the same buffer but with 5U T4 DNA ligase (Thermo Scientific) at 16°C at 50 rpm for 4.5 h, and then for 30 min at room temperature. Whole‐genome amplification was performed using illustra GenomiPhi v2 DNA amplification kit (GE Healthcare) with decrosslinking nuclei at 65°C overnight in sample buffer. High molecular weight DNA was purified using AMPure XP beads (Beckman Coulter), and 1 μg was used to prepare Illumina libraries for sequencing (by VBCF NGS Unit, csf.ac.at) after sonicating to ~300–1,300 bp. Libraries were sequenced on HiSeq 2500 v4 with 125‐bp paired‐end reads (at VBCF) or on NextSeq high‐output lane with 75‐bp paired‐end reads (at Wellcome Trust Clinical Research Facility, Edinburgh), between 10 and 24 cells per lane.
DNA and Scc1 staining
After zygote collection, the cells were fixed in 4% PFA for 30 min, before permeabilization in 0.2% Triton X‐100/PBS (PBSTX) for 30 min. Cells were then blocked in 10% goat serum (Dako) in PBSTX either at 4°C overnight or for several hours at 4°C followed by incubation at room temperature. Cells were incubated overnight at 4°C in primary antibody (anti‐Scc1, Millipore #05‐908, 1:250). After washing in blocking solution for at least 30 min, incubation with the secondary antibody (anti‐mouse IgG (H + L), Thermo Fisher Scientific #A‐11001, 1:500) was carried out for 1 h at room temperature. Another set of washing steps in 0.2% PBSTX was followed by a quick PBS wash and mounting of the cells in Vectashield containing DAPI (Vector Labs) using imaging spacers (Sigma‐Aldrich). In situ fixed zygotes were imaged on a confocal microscope (LSM780, Zeiss, ZEN black) using a 63×, 1.4NA oil objective. The presence of DNA compaction reminiscent of vermicelli in Wapl zygotes was classified using ImageJ and 3D visualization by Imaris (8.1.2). Brightness and contrast of images presented were adjusted using ImageJ software. No blinding or randomization was used for handling of the cells. Samples were excluded from the analysis if cells were not fertilized or in the wrong cell cycle phase (PN stage).
Antibodies
Anti‐Rad21 (anti‐Scc1, 1:250, Millipore, Cat# 05‐908; RRID: AB_417383); and goat anti‐mouse IgG (H + L) cross‐adsorbed secondary antibody (1:500, Alexa Fluor 488, Thermo Fisher Scientific, Cat# A‐11001; RRID: AB_2534069).
Live‐cell imaging of Scc1‐EGFP
In vitro fertilization after in vitro maturation was performed as described before (Ladstätter & Tachibana‐Konwalski, 2016). Oocytes from 2‐ to 5‐month‐old females were isolated by puncturing of ovaries with hypodermic needles in the presence of 0.2 mM IBMX, 20% FBS (Gibco), and 6 mg/ml fetuin (Sigma‐Aldrich). After microinjection of oocytes with H2B‐mCherry (187 ng/μl) and Scc1‐EGFP (260 ng/μl), oocytes were cultured for 1–1.5 h and then released from IBMX inhibition by washing in M16. Following in vitro maturation in the incubator (low‐oxygen conditions: 5% CO2, 5% O2, 90% N2; 37°C), cells were scored for extrusion of the first polar body and MII eggs were in vitro fertilized 10.5–12 h post‐release from IBMX inhibition. The sperm was obtained from the cauda epididymis and vas deferens of B6CBAF1 stud males and was capacitated in fertilization medium (Cook) in a tilted cell culture dish for at least 30 min. Motile sperm from the surface of the dish was used for in vitro fertilization of the in vitro maturated eggs. After 3–3.5 h, zygotes were washed in M16 and imaged. Live‐cell imaging of zygotes microinjected with fluorescent fusion proteins was performed on a confocal microscope (LSM 800, Zeiss; ZEN blue) equipped with an incubation chamber suited for live‐cell imaging (5% CO2, 37°C). Zygotes were kept in ~3 μl cleavage medium (Research Vitro Cleave; Cooks Austria GmbH) under mineral oil (Sigma‐Aldrich or Millipore) for the duration of the imaging. Movies were taken using a 63×, 1.20NA water immersion objective, taking 25 z‐slices (48 μm) every 10 min. Brightness and contrast of images presented were adjusted using ImageJ software. No blinding or randomization was used for handling of the cells. Samples were excluded from the analysis if cells were not fertilized.
snHi‐C data analysis
snHi‐C data were processed similarly as in Flyamer et al (2017), and detailed information of single‐cell and pooled data is given in Tables EV1 and EV2. Briefly, reads were mapped to the mm9 genome using hiclib (which applies iterative mapping with bowtie2) and then filtered. These data were then converted into Cooler files with heatmaps at different resolutions for downstream analysis.
We applied the same methods for quantification of different features of spatial organization of the genome as done previously (Flyamer et al, 2017). Briefly, we used GC content as a proxy for A/B compartmentalization signal and constructed 5 × 5 percentile‐binned matrices to quantify strength of compartment segregation (also called “saddle plots” for compartments). These 5 × 5 matrices were then iteratively corrected (Imakaev et al, 2012). For average analysis of TADs, we used published TAD coordinates (Rao et al, 2014) for the CH12‐LX mouse cell line. We averaged Hi‐C maps of all TADs and their neighboring regions, chosen to be of the same length as the TAD, after rescaling each TAD to a 90 × 90 matrix. For visualization, the contact probability of these matrices was rescaled to follow a shallow power law with distance (−0.25 scaling) (see Appendix Fig S1A). Similarly, we analyzed loops by summing up snHi‐C contact frequencies for loop coordinates identified in Rao et al (2014) for CH12‐LX mouse cells. By averaging 20 × 20 matrices surrounding the loops and dividing the final result by similarly averaged control matrices, we removed the effects of distance dependence (see Appendix Fig S1A). Control loop matrices were obtained by averaging 20 × 20 matrices centered on the locations of randomly shifted positions of known loops; shifts ranged from 100 to 1,100 kb with 100 shifts for each loop. For display and visual consistency with the loop strength quantification, we set the background levels of interaction to 1; the background is defined as the green boxes in Fig EV3A described below.
For the quantification of loop strength, we divided the average signal in the middle 6 × 6 submatrix by the average signal in top‐left and bottom‐right (at the same distance from the main diagonal) 6 × 6 submatrices (see Fig EV3A). To obtain the 95% confidence intervals on the loop strengths, we applied bootstrapping: Using the pooled single‐cell data, we randomly sampled N loops with replacement (where N equals the total number of loops used in the original samples) and calculated the loop strengths from this random sample. We performed this procedure 10,000 times for each condition, using the sorted set of 10,000 strength values to obtain the confidence intervals. To test for significant differences between mean loop strengths between any two conditions, we used a permutation test. We calculated the mean loop strength for each pair of conditions being tested. Then, we calculated differences in mean loop strengths for data where the labels on replicates have been randomly permuted. We repeated the random permutation procedure 1,000 times and calculated P‐values based on how frequently the “true” difference in loop strength was less than the difference in permuted data loop strengths.
Topologically Associating Domain strength was quantified using Pc(s) normalized snHi‐C data (see Appendix Fig S1A, bottom‐left panel). In python notation, if M is the 90 × 90 TAD numpy array (where numpy is np) and L = 90 is the length of the matrix, then TAD_strength = box1/box2, where:
Compartment saddle plot strength was quantified by the formula: log(AA*BB/(AB*BA)), where AA, AB, BA, and BB represent the four corners of the iteratively corrected saddle plot matrix.
To calculate the insulation score, we computed the sum of read counts within a sliding 40‐kb‐by‐40‐kb diamond. The diamond was positioned such that the “tip” touched the main axis of the snHi‐C map corresponding to a “self‐interaction”. Since snHi‐C maps are not iteratively corrected, we normalized all insulation profiles by the score of the minimum insulation and then subtracted 1. This way, the insulation/domain boundary is at 0 and has a minimum of 0.
Contact probability (Pc(s)) curves were computed from 10‐kb binned snHi‐C data. We divided the linear genomic separations into logarithmic bins with a factor of 1.3. Data within these log‐spaced bins (at distance, s) were averaged to produce the value of Pc(s). In Fig 3, both Pc(s) curves and their log‐space slopes are shown following a Gaussian smoothing (using the scipy.ndimage.filters.gaussian_smoothing1d function with radius 0.8). Both the y‐axis (i.e., log(Pc(s)) and the x‐axis (i.e., log(s)) were smoothed.
De novo TAD boundary calling
Topologically Associating Domain boundaries were called de novo on multiple cell types using the corner score as described in Schwarzer et al (2017) using default parameters. Hi‐C data for this analysis were processed using hiclib as described (Imakaev et al, 2012), and files were converted to Cool format.
Sorting maternal and paternal cells
As described previously (Flyamer et al, 2017), it is possible to distinguish maternally and paternally derived chromatin based on the shape of the Pc(s) curve in single cells. Maternal chromatin has a characteristic plateau/flattening of the Pc(s) at 10–30 Mb. Due to the similar pronucleus sizes of the Scc1 control data which made them difficult to sort post‐lysis, we opted to sort maternal and paternal pronuclei in silico. We chose a separate cutoff value for Pc(s) for G1‐phase (Scc1 controls and knockout) and G2‐phase cells (G2, Wapl controls and knockout) that was used to designate maternal or paternal chromatin as the Pc(s) curve changes through the cell cycle. First, we normalized all Pc(s) curves to 1 at 9 kb for all conditions. For G1 cells, all Pc(s) curves with a value above 1 × 10⁻⁴ at 15 Mb were designated maternal. For G2 cells, all Pc(s) curves with a value above 2.5 × 10⁻⁵ at 20 Mb were designated maternal. Cells in which the pronuclei were stuck together after lysis were given the tag “both” and were not assigned a maternal/paternal value in silico, but were used in the “combined” data analyses of Fig 2. We further filtered out bad data using the cutoff of Pc(s) < 10−1 at 30 kb; these cells were excluded from all analyses.
Analysis of Du et al (2017) data
Preprocessed, mapped valid pair files were obtained from GEO accession number GSE82185. These files were directly converted to the Cooler format (https://github.com/mirnylab/cooler) without any further filtering or processing using csort and cload functions. Averaging analysis for loops, TADs, and compartments was performed as described previously (Flyamer et al, 2017) and is summarized in the above section.
Analyses of Ke et al (2017) data
FASTQ files were downloaded from BioProject, identifier PRJCA000241 (http://bigd.big.ac.cn/bioproject/browse/PRJCA000241). Data were mapped to the mm9 genome and converted to Cooler format using distiller (https://github.com/mirnylab/distiller-nf). Averaging analyses for loops, TADs, and compartments were performed as described previously (Flyamer et al, 2017).
Polymer simulations
Polymer simulations of loop extrusion were performed as in Flyamer et al (2017), but using updates to the simulation engine (Fudenberg & Imakaev, 2017). The simulation engine is built using the openmm‐polymer package which relies on OpenMM 7 (Eastman et al, 2017). Parameters for simulations were as follows: 2,000 MD steps per loop extrusion step. Simulations were performed using either N = 30,000 monomers or N = 100,000 monomers. Simulations were initialized using a fractal globule or a mitotic chromosome model, as described in Flyamer et al (2017). Bidirectional TAD boundaries were placed at monomers 0, 1,200, 1,500, 2,000, 2,900, 3,900, 4,300, 4,800, 5,600, 6,100, 6,500, 7,600, 8,300, 8,900, and 9,500 and at positions shifted by multiples of 10,000 (10,000, 11,200, 11,500, 12,000, … 20,000, 21,200, 21,500, 22,000…). TAD boundaries were implemented as monomers that pause the loop‐extruding factor (LEF) translocation with probability 99.5%. That would delay translocation of a LEF by on average 200 loop extrusion steps. All simulations were performed in periodic boundary conditions at a given density. For each simulation, we simulated 4,000 steps of loop extrusion dynamics, starting with a random placement of LEFs at the beginning of a simulation.
We performed two types of simulations. A parameter sweep for processivity–separation values was performed for a system of 30,000 monomers for all pairwise combinations of the values of processivity of 60, 120, 240, 480, and 960 kb and the values of separation of 30, 60, 120, 240, 480, and 2,400 kb. The largest value of separation was to simulate 20‐fold depletion of LEFs relative to the wildtype model value of 120 kb (Fudenberg et al, 2016). All simulations here were initialized with a 30,000 monomer fragment of a mitotic chromosome model. We used a density of 0.02 for these simulations.
A more complete simulation was performed using a system of 100,000 monomers, initialized from a mitotic chromosome model, or from a fractal globule for maternal and paternal chromosomes, respectively. Particular values of parameters were chosen based on the parameter sweep. We chose values of processivity and separation of 120 kb for the control conditions model, the same values as used in Fudenberg et al (2016). For the model of Scc1Δ, we reduced the number of cohesins 20‐fold, which corresponds to increasing separation to 2,400 kb. For the model of WaplΔ of maternal chromatin, we increased processivity fourfold, but kept the separation at 120 kb. For WaplΔ of paternal chromatin, we best matched the difference in Pc(s) in the s = 100–500 kb region by decreasing the processivity twofold, but increasing separation by twofold as compared to maternal. Additionally, to reflect the larger paternal pronuclear volume, we decreased the density of simulations twofold, to 0.01.
We calculated Pc(s) and simulated contact maps using a contact radius of 5 monomers. Both Pc(s) curves and their log‐space slopes are shown following a Gaussian smoothing (using the scipy.ndimage.filters.gaussian_smoothing1d function with radius 0.8). Both the y‐axis (i.e., log(Pc(s)) and the x‐axis (i.e., log(s)) were smoothed.
Data and software availability
The snHi‐C data have been deposited on NCBI GEO under the accession number GSE100569. Polymer simulation code is available in the “examples” directory of the openmm‐polymer library (https://bitbucket.org/mirnylab/openmm-polymer); analysis code of polymer configurations, including the surface area and volume measurements, will be made available upon publication. snHi‐C data processing code has been released as an example for the hiclib package (https://bitbucket.org/mirnylab/hiclib).
Author contributions
JG and HBB contributed equally to the study. KT conceived the project. JG supervised by KT performed snHi‐C and imaging experiments. HBB supervised by LAM developed and performed snHi‐C data analysis and simulations. MI performed simulations. IMF performed image analysis. SL provided novel mouse strains and imaging reagents. J‐MP provided a novel mouse strain. HBB, JG, MI, and IMF prepared the figures. HBB, JG, MI, IMF, WAB, LAM, and KT wrote the manuscript with input from all authors.
Conflict of interest
The authors declare that they have no conflict of interest.
Supporting information
Appendix
Expanded View Figures PDF
Table EV1
Table EV2
Movie EV1
Movie EV2
Source Data for Expanded View and Appendix
Review Process File
Source Data for Figure 2
Source Data for Figure 3
Source Data for Figure 4
Source Data for Figure 6
Source Data for Figure 7
Acknowledgements
We thank M. Coelho Correia da Silva and M. H. Idarraga‐Amado for providing conditional Wapl mice and reagents, and A. Hirsch, K. Klien, and N. Laumann‐Lipp for technical assistance with pronuclear extractions. We are grateful to J. Nuebler for discussions and suggestions for simulations and sharing codes, and to A. Goloborodko for suggesting the derivative‐based analyses of Pc(s) curves. Illumina sequencing was performed at the VBCF NGS Unit (http://www.vbcf.ac.at) and Edinburgh Wellcome Trust Clinical Research Facility (WTCRF). We thank the staff of Vienna Biocenter BioOptics facility for assistance with imaging and analysis. J.G. is an associated student of the DK Chromosome Dynamics (W1238‐B20) supported by the Austrian Science Fund (FWF) and the European Research Council. H.B.B. is grateful for support by the Natural Sciences and Engineering Research Council of Canada, PGS‐D. I.M.F. is grateful for support from the Darwin Trust of Edinburgh. W.A.B. is supported by the UK Medical Research Council. This work was funded by the Austrian Academy of Sciences and by the ERC‐StG‐336460 ChromHeritance grant to K.T.‐K. The work in the Mirny Laboratory is supported by R01 GM114190, U54 DK107980 from the National Institute of Health, and 1504942 from the National Science Foundation.
See also: G Wutz et al (December 2017) and JHI Haarhuis & BD Rowland (December 2017)
Contributor Information
Leonid A Mirny, Email: leonid@mit.edu.
Kikuë Tachibana, Email: kikue.tachibana@imba.oeaw.ac.at.
References
- Adenot PG, Mercier Y, Renard JP, Thompson EM (1997) Differential H4 acetylation of paternal and maternal chromatin precedes DNA replication and differential transcriptional activity in pronuclei of 1‐cell mouse embryos. Development 124: 4615–4625 [DOI] [PubMed] [Google Scholar]
- Aoki F, Worrad DM, Schultz RM (1997) Regulation of transcriptional activity during the first and second cell cycles in the preimplantation mouse embryo. Dev Biol 181: 296–307 [DOI] [PubMed] [Google Scholar]
- Burkhardt S, Borsos M, Szydlowska A, Godwin J, Williams SA, Cohen PE, Hirota T, Saitou M, Tachibana‐Konwalski K (2016) Chromosome cohesion established by Rec8‐cohesin in fetal oocytes is maintained without detectable turnover in oocytes arrested for months in mice. Curr Biol 26: 678–685 [DOI] [PMC free article] [PubMed] [Google Scholar]
- Ciosk R, Shirayama M, Shevchenko A, Tanaka T, Toth A, Shevchenko A, Nasmyth K (2000) Cohesin's binding to chromosomes depends on a separate complex consisting of Scc2 and Scc4 proteins. Mol Cell 5: 243–254 [DOI] [PubMed] [Google Scholar]
- Deardorff MA, Kaur M, Yaeger D, Rampuria A, Korolev S, Pie J, Gil‐Rodríguez C, Arnedo M, Loeys B, Kline AD, Wilson M, Lillquist K, Siu V, Ramos FJ, Musio A, Jackson LS, Dorsett D, Krantz ID (2007) Mutations in cohesin complex members SMC3 and SMC1A cause a mild variant of cornelia de lange syndrome with predominant mental retardation. Am J Hum Genet 80: 485–494 [DOI] [PMC free article] [PubMed] [Google Scholar]
- Dixon JR, Selvaraj S, Yue F, Kim A, Li Y, Shen Y, Hu M, Liu JS, Ren B (2012) Topological domains in mammalian genomes identified by analysis of chromatin interactions. Nature 485: 376–380 [DOI] [PMC free article] [PubMed] [Google Scholar]
- Du Z, Zheng H, Huang B, Ma R, Wu J, Zhang X, He J, Xiang Y, Wang Q, Li Y, Ma J, Zhang X, Zhang K, Wang Y, Zhang MQ, Gao J, Dixon JR, Wang X, Zeng J, Xie W (2017) Allelic reprogramming of 3D chromatin architecture during early mammalian development. Nature 547: 232–235 [DOI] [PubMed] [Google Scholar]
- Eastman P, Swails J, Chodera JD, McGibbon RT, Zhao Y, Beauchamp KA, Wang L‐P, Simmonett AC, Harrigan MP, Stern CD, Wiewiora RP, Brooks BR, Pande VS (2017) OpenMM 7: rapid development of high performance algorithms for molecular dynamics. PLoS Comput Biol 13: e1005659 [DOI] [PMC free article] [PubMed] [Google Scholar]
- Flavahan WA, Drier Y, Liau BB, Gillespie SM, Venteicher AS, Stemmer‐Rachamimov AO, Suvà ML, Bernstein BE (2015) Insulator dysfunction and oncogene activation in IDH mutant gliomas. Nature 529: 110–114 [DOI] [PMC free article] [PubMed] [Google Scholar]
- Flyamer IM, Gassler J, Imakaev M, Brandão HB, Ulianov SV, Abdennur N, Razin SV, Mirny LA, Tachibana‐Konwalski K (2017) Single‐nucleus Hi‐C reveals unique chromatin reorganization at oocyte‐to‐zygote transition. Nature 544: 110–114 [DOI] [PMC free article] [PubMed] [Google Scholar]
- Franke M, Ibrahim DM, Andrey G, Schwarzer W, Heinrich V, Schöpflin R, Kraft K, Kempfer R, Jerković I, Chan W‐L, Spielmann M, Timmermann B, Wittler L, Kurth I, Cambiaso P, Zuffardi O, Houge G, Lambie L, Brancati F, Pombo A et al (2016) Formation of new chromatin domains determines pathogenicity of genomic duplications. Nature 538: 265–269 [DOI] [PubMed] [Google Scholar]
- Fudenberg G, Imakaev M, Lu C, Goloborodko A, Abdennur N, Mirny LA (2016) Formation of chromosomal domains by loop extrusion. Cell Rep 15: 2038–2049 [DOI] [PMC free article] [PubMed] [Google Scholar]
- Fudenberg G, Imakaev M (2017) FISH‐ing for captured contacts: towards reconciling FISH and 3C. Nat Methods 14: 673–678 [DOI] [PMC free article] [PubMed] [Google Scholar]
- Gandhi R, Gillespie PJ, Hirano T (2006) Human wapl is a cohesin‐binding protein that promotes sister‐chromatid resolution in mitotic prophase. Curr Biol 16: 2406–2417 [DOI] [PMC free article] [PubMed] [Google Scholar]
- Giorgetti L, Lajoie BR, Carter AC, Attia M, Zhan Y, Xu J, Chen CJ, Kaplan N, Chang HY, Heard E, Dekker J (2016) Structural organization of the inactive X chromosome in the mouse. Nature 535: 575–579 [DOI] [PMC free article] [PubMed] [Google Scholar]
- Goloborodko A, Marko JF, Mirny LA (2016) Chromosome compaction by active loop extrusion. Biophys J 110: 2162–2168 [DOI] [PMC free article] [PubMed] [Google Scholar]
- Haarhuis JHI, van der Weide RH, Blomen VA, Yáñez‐Cuna JO, Amendola M, van Ruiten MS, Krijger PHL, Teunissen H, Medema RH, van Steensel B, Brummelkamp TR, de Wit E, Rowland BD (2017) The cohesin release factor WAPL restricts chromatin loop extension. Cell 169: 693–707 [DOI] [PMC free article] [PubMed] [Google Scholar]
- Halverson JD, Smrek J, Kremer K, Grosberg AY (2014) From a melt of rings to chromosome territories: the role of topological constraints in genome folding. Rep Prog Phys 77: 22601 [DOI] [PubMed] [Google Scholar]
- Hamatani T, Carter MG, Sharov AA, Ko MSH (2004) Dynamics of global gene expression changes during mouse preimplantation development. Dev Cell 6: 117–131 [DOI] [PubMed] [Google Scholar]
- Hansen AS, Pustova I, Cattoglio C, Tjian R, Darzacq X (2017) CTCF and cohesin regulate chromatin loop stability with distinct dynamics. Elife 6: e25776 [DOI] [PMC free article] [PubMed] [Google Scholar]
- van der Heijden GW, Dieker JW, Derijck AAHA, Muller S, Berden JHM, Braat DDM, van der Vlag J, de Boer P (2005) Asymmetry in histone H3 variants and lysine methylation between paternal and maternal chromatin of the early mouse zygote. Mech Dev 122: 1008–1022 [DOI] [PubMed] [Google Scholar]
- Hug CB, Grimaldi AG, Kruse K, Vaquerizas JM (2017) Chromatin architecture emerges during zygotic genome activation independent of transcription. Cell 169: 216–228 [DOI] [PubMed] [Google Scholar]
- Imakaev M, Fudenberg G, McCord RP, Naumova N, Goloborodko A, Lajoie BR, Dekker J, Mirny LA (2012) Iterative correction of Hi‐C data reveals hallmarks of chromosome organization. Nat Methods 9: 999–1003 [DOI] [PMC free article] [PubMed] [Google Scholar]
- Inoue A, Jiang L, Lu F, Suzuki T, Zhang Y (2017) Maternal H3K27me3 controls DNA methylation‐independent imprinting. Nature 547: 419–424 [DOI] [PMC free article] [PubMed] [Google Scholar]
- Ke Y, Xu Y, Chen X, Feng S, Liu Z, Sun Y, Yao X, Li F, Zhu W, Gao L, Chen H, Du Z, Xie W, Xu X, Huang X, Liu J (2017) 3D chromatin structures of mature gametes and structural reprogramming during mammalian embryogenesis. Cell 170: 367–381 [DOI] [PubMed] [Google Scholar]
- Krantz ID, McCallum J, DeScipio C, Kaur M, Gillis LA, Yaeger D, Jukofsky L, Wasserman N, Bottani A, Morris CA, Nowaczyk MJM, Toriello H, Bamshad MJ, Carey JC, Rappaport E, Kawauchi S, Lander AD, Calof AL, Li H, Devoto M et al (2004) Cornelia de Lange syndrome is caused by mutations in NIPBL, the human homolog of Drosophila melanogaster Nipped‐B. Nat Genet 36: 631–635 [DOI] [PMC free article] [PubMed] [Google Scholar]
- Kueng S, Hegemann B, Peters BH, Lipp JJ, Schleiffer A, Mechtler K, Peters J‐M (2006) Wapl controls the dynamic association of cohesin with chromatin. Cell 127: 955–967 [DOI] [PubMed] [Google Scholar]
- Ladstätter S, Tachibana‐Konwalski K (2016) A surveillance mechanism ensures repair of DNA lesions during zygotic reprogramming. Cell 167: 1774–1787 [DOI] [PMC free article] [PubMed] [Google Scholar]
- Lan Z‐J, Xu X, Cooney AJ (2004) Differential oocyte‐specific expression of Cre recombinase activity in GDF‐9‐iCre, Zp3cre, and Msx2Cre transgenic mice 1. Biol Reprod 71: 1469–1474 [DOI] [PubMed] [Google Scholar]
- Lewandoski M, Wassarman KM, Martin GR (1997) Zp3–cre, a transgenic mouse line for the activation or inactivation of loxP‐flanked target genes specifically in the female germ line. Curr Biol 7: 148–151 [DOI] [PubMed] [Google Scholar]
- Lopez‐Serra L, Lengronne A, Borges V, Kelly G, Uhlmann F (2013) Budding yeast Wapl controls sister chromatid cohesion maintenance and chromosome condensation. Curr Biol 23: 64–69 [DOI] [PubMed] [Google Scholar]
- Lupiáñez DG, Kraft K, Heinrich V, Krawitz P, Brancati F, Klopocki E, Horn D, Kayserili H, Opitz JM, Laxova R, Santos‐Simarro F, Gilbert‐Dussardier B, Wittler L, Borschiwer M, Haas SA, Osterwalder M, Franke M, Timmermann B, Hecht J, Spielmann M et al (2015) Disruptions of topological chromatin domains cause pathogenic rewiring of gene‐enhancer interactions. Cell 161: 1012–1025 [DOI] [PMC free article] [PubMed] [Google Scholar]
- Mayer W, Niveleau A, Walter J, Fundele R, Haaf T (2000) Demethylation of the zygotic paternal genome. Nature 403: 501–502 [DOI] [PubMed] [Google Scholar]
- Mizuguchi T, Fudenberg G, Mehta S, Belton J‐M, Taneja N, Folco HD, FitzGerald P, Dekker J, Mirny L, Barrowman J, Grewal SIS (2014) Cohesin‐dependent globules and heterochromatin shape 3D genome architecture in S. pombe. Nature 516: 432–435 [DOI] [PMC free article] [PubMed] [Google Scholar]
- Musio A, Selicorni A, Focarelli ML, Gervasini C, Milani D, Russo S, Vezzoni P, Larizza L (2006) X‐linked cornelia de lange syndrome owing to SMC1L1 mutations. Nat Genet 38: 528–530 [DOI] [PubMed] [Google Scholar]
- Nagano T, Lubling Y, Várnai C, Dudley C, Leung W, Baran Y, Mendelson Cohen N, Wingett S, Fraser P, Tanay A (2017) Cell‐cycle dynamics of chromosomal organization at single‐cell resolution. Nature 547: 61–67 [DOI] [PMC free article] [PubMed] [Google Scholar]
- Naumova N, Imakaev M, Fudenberg G, Zhan Y, Lajoie BR, Mirny LA, Dekker J (2013) Organization of the mitotic chromosome. Science 342: 948–953 [DOI] [PMC free article] [PubMed] [Google Scholar]
- Nolen LD, Boyle S, Ansari M, Pritchard E, Bickmore WA (2013) Regional chromatin decompaction in Cornelia de Lange syndrome associated with NIPBL disruption can be uncoupled from cohesin and CTCF. Hum Mol Genet 22: 4180–4193 [DOI] [PMC free article] [PubMed] [Google Scholar]
- Nora EP, Lajoie BR, Schulz EG, Giorgetti L, Okamoto I, Servant N, Piolot T, van Berkum NL, Meisig J, Sedat J, Gribnau J, Barillot E, Blüthgen N, Dekker J, Heard E (2012) Spatial partitioning of the regulatory landscape of the X‐inactivation centre. Nature 485: 381–385 [DOI] [PMC free article] [PubMed] [Google Scholar]
- Nora EP, Goloborodko A, Valton A‐L, Gibcus JH, Uebersohn A, Abdennur N, Dekker J, Mirny LA, Bruneau BG (2017) Targeted degradation of CTCF decouples local insulation of chromosome domains from genomic compartmentalization. Cell 169: 930–944 [DOI] [PMC free article] [PubMed] [Google Scholar]
- Nuebler J, Fudenberg G, Imakaev M, Abdennur N, Mirny L (2017) Chromatin organization by an interplay of loop extrusion and compartmental segregation. BioRxiv https://doi.org/10.1101/196261 [PREPRINT] [DOI] [PMC free article] [PubMed] [Google Scholar]
- Oswald J, Engemann S, Lane N, Mayer W (2000) Active demethylation of the paternal genome in the mouse zygote. Curr Biol 10: 475–478. [DOI] [PubMed] [Google Scholar]
- Parelho V, Hadjur S, Spivakov M, Leleu M, Sauer S, Gregson HC, Jarmuz A, Canzonetta C, Webster Z, Nesterova T, Cobb BS, Yokomori K, Dillon N, Aragon L, Fisher AG, Merkenschlager M (2008) Cohesins functionally associate with CTCF on mammalian chromosome arms. Cell 132: 422–433 [DOI] [PubMed] [Google Scholar]
- Peters J‐M, Tedeschi A, Schmitz J (2008) The cohesin complex and its roles in chromosome biology. Genes Dev 22: 3089–3114 [DOI] [PubMed] [Google Scholar]
- Phillips‐Cremins JE, Sauria MEG, Sanyal A, Gerasimova TI, Lajoie BR, Bell JSK, Ong C‐T, Hookway TA, Guo C, Sun Y, Bland MJ, Wagstaff W, Dalton S, McDevitt TC, Sen R, Dekker J, Taylor J, Corces VG (2013) Architectural protein subclasses shape 3D organization of genomes during lineage commitment. Cell 153: 1281–1295 [DOI] [PMC free article] [PubMed] [Google Scholar]
- Rao SSP, Huntley MH, Durand NC, Stamenova EK, Bochkov ID, Robinson JT, Sanborn AL, Machol I, Omer AD, Lander ES, Aiden EL (2014) A 3D map of the human genome at kilobase resolution reveals principles of chromatin looping. Cell 159: 1665–1680 [DOI] [PMC free article] [PubMed] [Google Scholar]
- Rao SSP, Huang S‐C, Glenn St Hilaire B, Engreitz JM, Perez EM, Kieffer‐Kwon K‐R, Sanborn AL, Johnstone SE, Bascom GD, Bochkov ID, Huang X, Shamim MS, Shin J, Turner D, Ye Z, Omer AD, Robinson JT, Schlick T, Bernstein BE, Casellas R et al (2017) Cohesin loss eliminates all loop domains. Cell 171: 305–320 [DOI] [PMC free article] [PubMed] [Google Scholar]
- Rodman TC, Pruslin FH, Hoffmann HP, Allfrey VG (1981) Turnover of basic chromosomal proteins in fertilized eggs: a cytoimmunochemical study of events in vivo . J Cell Biol 90: 351–361 [DOI] [PMC free article] [PubMed] [Google Scholar]
- Sanborn AL, Rao SSP, Huang S‐C, Durand NC, Huntley MH, Jewett AI, Bochkov ID, Chinnappan D, Cutkosky A, Li J, Geeting KP, Gnirke A, Melnikov A, McKenna D, Stamenova EK, Lander ES, Aiden EL (2015) Chromatin extrusion explains key features of loop and domain formation in wild‐type and engineered genomes. Proc Natl Acad Sci 112: 201518552 [DOI] [PMC free article] [PubMed] [Google Scholar]
- Schwarzer W, Abdennur N, Goloborodko A, Pekowska A, Fudenberg G, Loe‐Mie Y, Fonseca NA, Huber W, Haering C, Mirny L, Spitz F (2017) Two independent modes of chromatin organization revealed by cohesin removal. Nature 551: 51–56 [DOI] [PMC free article] [PubMed] [Google Scholar]
- Seitan VC, Faure AJ, Zhan Y, McCord RP, Lajoie BR, Ing‐Simmons E, Lenhard B, Giorgetti L, Heard E, Fisher AG, Flicek P, Dekker J, Merkenschlager M (2013) Cohesin‐based chromatin interactions enable regulated gene expression within preexisting architectural compartments. Genome Res 23: 2066–2077 [DOI] [PMC free article] [PubMed] [Google Scholar]
- Sofueva S, Yaffe E, Chan W‐C, Georgopoulou D, Vietri Rudan M, Mira‐Bontenbal H, Pollard SM, Schroth GP, Tanay A, Hadjur S (2013) Cohesin‐mediated interactions organize chromosomal domain architecture. EMBO J 32: 3119–3129 [DOI] [PMC free article] [PubMed] [Google Scholar]
- Tachibana‐Konwalski K, Godwin J, van der Weyden L, Champion L, Kudo NR, Adams DJ, Nasmyth K (2010) Rec8‐containing cohesin maintains bivalents without turnover during the growing phase of mouse oocytes. Genes Dev 24: 2505–2516 [DOI] [PMC free article] [PubMed] [Google Scholar]
- Tedeschi A, Wutz G, Huet S, Jaritz M, Wuensche A, Schirghuber E, Davidson IF, Tang W, Cisneros DA, Bhaskara V, Nishiyama T, Vaziri A, Wutz A, Ellenberg J, Peters J‐M (2013) Wapl is an essential regulator of chromatin structure and chromosome segregation. Nature 501: 564–568 [DOI] [PMC free article] [PubMed] [Google Scholar]
- Terakawa T, Bisht S, Eeftens JM, Dekker C, Haering CH, Greene EC (2017) The condensin complex is a mechanochemical motor that translocates along DNA. Science 358: 672–676 [DOI] [PMC free article] [PubMed] [Google Scholar]
- Tjong H, Gong K, Chen L, Alber F (2012) Physical tethering and volume exclusion determine higher‐order genome organization in budding yeast. Genome Res 22: 1295–1305 [DOI] [PMC free article] [PubMed] [Google Scholar]
- Tonkin ET, Wang T‐J, Lisgo S, Bamshad MJ, Strachan T (2004) NIPBL, encoding a homolog of fungal Scc2‐type sister chromatid cohesion proteins and fly Nipped‐B, is mutated in Cornelia de Lange syndrome. Nat Genet 36: 636–641 [DOI] [PubMed] [Google Scholar]
- Torres‐Padilla M‐E, Bannister AJ, Hurd PJ, Kouzarides T, Zernicka‐Goetz M (2006) Dynamic distribution of the replacement histone variant H3.3 in the mouse oocyte and preimplantation embryos. Int J Dev Biol 50: 455–461 [DOI] [PubMed] [Google Scholar]
- Tran NT, Laub MT, Le TBK (2017) SMC progressively aligns chromosomal arms in caulobacter crescentus but is antagonized by convergent transcription. Cell Rep 20: 2057–2071 [DOI] [PMC free article] [PubMed] [Google Scholar]
- Ulianov SV, Tachibana‐Konwalski K, Razin SV (2017) Single‐cell Hi‐C bridges microscopy and genome‐wide sequencing approaches to study 3D chromatin organization. BioEssays 39: 1700104 [DOI] [PubMed] [Google Scholar]
- Vietri Rudan M, Barrington C, Henderson S, Ernst C, Odom DT, Tanay A, Hadjur S (2015) Comparative Hi‐C reveals that CTCF underlies evolution of chromosomal domain architecture. Cell Rep 10: 1297–1309 [DOI] [PMC free article] [PubMed] [Google Scholar]
- Wang X, Brandão HB, Le TBK, Laub MT, Rudner DZ (2017) Bacillus subtilis SMC complexes juxtapose chromosome arms as they travel from origin to terminus. Science 355: 524–527 [DOI] [PMC free article] [PubMed] [Google Scholar]
- Wendt KS, Yoshida K, Itoh T, Bando M, Koch B, Schirghuber E, Tsutsumi S, Nagae G, Ishihara K, Mishiro T, Yahata K, Imamoto F, Aburatani H, Nakao M, Imamoto N, Maeshima K, Shirahige K, Peters J‐M (2008) Cohesin mediates transcriptional insulation by CCCTC‐binding factor. Nature 451: 796–801 [DOI] [PubMed] [Google Scholar]
- Wutz G, Varnai C, Nagasaka K, Cisneros DA, Stocsits R, Tang W, Schoenfelder S, Jessberger G, Muhar M, Hossain JM, Walther N, Koch B, Kueblbeck M, Ellenberg J, Zuber J, Fraser P, Peters J‐M (2017) CTCF, WAPL, and PDS5 proteins control the formation of TADs and loops by cohesin. EMBO J 36: 3573–3599 [DOI] [PMC free article] [PubMed] [Google Scholar]
- Zuin J, Dixon JR, van der Reijden MIJA, Ye Z, Kolovos P, Brouwer RWW, van de Corput MPC, van de Werken HJG, Knoch TA, van IJcken WFJ, Grosveld FG, Ren B, Wendt KS (2014) Cohesin and CTCF differentially affect chromatin architecture and gene expression in human cells. Proc Natl Acad Sci 111: 996–1001. [DOI] [PMC free article] [PubMed] [Google Scholar]
Associated Data
This section collects any data citations, data availability statements, or supplementary materials included in this article.
Supplementary Materials
Appendix
Expanded View Figures PDF
Table EV1
Table EV2
Movie EV1
Movie EV2
Source Data for Expanded View and Appendix
Review Process File
Source Data for Figure 2
Source Data for Figure 3
Source Data for Figure 4
Source Data for Figure 6
Source Data for Figure 7