

Abstract
Background
The immune profile of sarcomatoid renal cell carcinoma (RCC) (sRCC), including PD-L1 and PD-1 status, has not been well characterized.
Methods
PD-L1, PD-1, CD4, and CD8 immunohistochemical digital analysis was performed on nephrectomy specimens of 118 sRCC and 92 non-sarcomatoid clear cell RCC (ccRCC) patients. Clinical characteristics of the population were compared between sRCC and ccRCC. Overall survival was estimated and was compared between PD-L1–positive and PD-L1–negative groups as well as tumor infiltrating lymphocytes (TIL)–high and TIL–low groups.
Results
The PD-L1 H-score of sRCC (mean, 3.7; range, 0–192.1) was significantly higher than that of grade 4 ccRCC (P=0.001), and 41.3% of sRCC showed PD-L1 H-score≥10. PD-1–positive cell density was significantly higher in sRCC than in ccRCC within the tumor and at the invasive front. Intratumoral CD8-positive cell density was significantly higher in sRCC than in ccRCC. 41% in sarcomatoid component of sRCC and 8% in epithelioid component of sRCC had an adaptive immune resistance (PD-L1 positive and TIL positive) phenotype, while only 1% in pure epithelioid RCC had Type I phenotype.
Conclusions
sRCC showed higher PD-L1 expression and higher PD-1 and CD8–positive cell density than grade 4 ccRCC. Our results indicate a notable immunosuppressive environment in sRCC. Despite advances in the treatment of advanced-stage RCC, sRCC still has a poor prognosis. In this work, we describe highly immunosuppressive characteristics of sRCC compared with an appropriate ccRCC control. Our results suggest PD-1/PD-L1 blockade therapy as a potential therapeutic approach for sRCC.
Keywords: renal cell carcinoma, sarcomatoid renal cell carcinoma, PD-L1, PD-1, immunotherapy
INTRODUCTION
Although the advent of targeted therapies has significantly improved survival in patients with metastatic renal cell carcinoma (RCC) in the past decade, the efficacy of these new drugs is limited in patients with sarcomatoid RCC (sRCC), as these patients experience the worst outcomes of all patients with RCC1–3.
Programmed cell death 1 (PD-1) and programmed cell death ligand 1 (PD-L1) are promising targets for novel immunotherapeutic approaches and their marker status carries potential prognostic value in ccRCC4, 5. Previous work identified a robust clear cell RCC (ccRCC) subtype with overexpression of genes related to the immune response, including high expression of PD-1, PD-L1, and PD-L2, frequently showed sarcomatoid dedifferentiation and inflammation histologically6. In addition, PD-L1 induces epithelial-mesenchymal transition in RCC7 and sRCC is considered a good example of epithelial-mesenchymal transition both morphologically and immunohistochemically8. Two studies evaluated PD-L1 expression in sRCC with clear cell epithelioid component (cc-sRCC) and found it to be significantly higher than in non-sarcomatoid ccRCC9, 10. Furthermore, 50% of sRCCs showed co-expression of PD-1/PD-L1, while only 3% of non-sarcomatoid ccRCCs showed PD-1/PD-L1 co-expression9. Therefore, sRCC may represent a promising disease subset for immune checkpoint blockade therapy. However, given the rarity of sRCC, these tissue-based studies have been small and PD-1 and PD-L1 expression in sRCC have not been adequately compared with those in high-grade non-sarcomatoid RCC.
Our study objectives were to: 1) examine PD-L1 expression as well as tumor infiltrating lymphocytes (TILs) status including PD-1 expression in a large series of patients with sRCC, and 2) to compare the marker status between sRCC (sarcomatoid and epithelioid components), non-sarcomatoid ccRCC, and subtypes of sRCC including cc-sRCC and non-cc-sRCC (sarcomatoid and epithelioid components).
PATIENTS AND METHODS
Patient and sample data collection
We identified 118 patients with sRCC treated surgically at The University of Texas MD Anderson Cancer Center from 2000 through 2012. Patients who received neoadjuvant therapy (N=21) and cases with digital analysis failure (N=3) were excluded from the study. The total number of patients with sRCC included in this study was 94. An additional cohort of 92 patients with non-sarcomatoid ccRCC, including 20 with grade 4, 58 with grade 3, and 14 with grade 2 disease, was evaluated for comparison. The study design is illustrated in Supplementary Figure 1. This study was approved by the institutional review board at The University of Texas MD Anderson Cancer Center.
Formalin-fixed paraffin-embedded blocks from all cases were retrieved from the Pathology department and all HE tumor slides from all cases were re-reviewed by two dedicated genitourinary pathologists (KS and FK) to confirm the diagnosis of sRCC and to document the histology of the epithelioid component, the highest Fuhrman nuclear grade of the epithelioid component, and the percentage of the sarcomatoid component. All HE tumor slides were used to evaluate these parameters. Baseline clinicopathologic characteristics including age at the time of surgery, sex, and tumor size at the time of surgery, TNM stage at the time of surgery, and follow-up data were retrospectively collected from the patients’ medical records (Table 1).
Table 1.
Characteristics of patients with sRCC
| Characteristic | Total, no. (%) (N=94) |
cc-sRCC, no. (%) (N=74) |
Non-cc-sRCC, no. (%) (N=20) |
|
|---|---|---|---|---|
| Median age (range), years | 60 (28–85) | 61 (28–85) | 59 (45–85) | |
| Sex | Male | 50 (53.2) | 39 (52.7) | 11 (55.0) |
| Female | 44 (46.8) | 35 (47.3) | 9 (45.0) | |
| pT category | 1 | 6 (6.4) | 4 (5.4) | 2 (10.0) |
| 2 | 2 (2.1) | 2 (2.7) | 0 (0.0) | |
| 3 | 66 (70.2) | 54 (73.0) | 12 (60.0) | |
| 4 | 20 (21.3) | 14 (18.9) | 6 (30.0) | |
| pN category | 0 | 34 (36.2) | 31 (41.9) | 3 (15.0) |
| 1 | 32 (34.0) | 20 (27.0) | 12 (60.0) | |
| X | 28 (29.8) | 23 (31.1) | 5 (25.0) | |
| M category | 0 | 46 (48.9) | 35 (47.3) | 11 (55.0) |
| 1 | 48 (51.1) | 39 (52.7) | 9 (45.0) | |
| Stage | I | 5 (5.3) | 4 (5.4) | 1 (5.0) |
| II | 1 (1.1) | 1 (1.4) | 0 (0) | |
| III | 29 (30.9) | 22 (29.7) | 7 (35.0) | |
| IV | 59 (62.8) | 47 (63.5) | 12 (60.0) |
Whole section cutting and tissue microarray (TMA) construction
After reviewing all HE tumor slides, a representative slide and the corresponding tumor block were selected for each patient as well as for control pure epithelioid ccRCC cohort. If there is no block which contains both sarcomatoid and epithelioid component, we selected 2 blocks for 1 case for each sarcomatoid and epithelioid component. On the representative slide that included the area of sarcomatoid or epithelioid component, three areas of tumor tissue were marked by a pathologist (FK). From the corresponding paraffin block, five 4-μm-thick sections were cut for each sample. Then, TMAs were constructed by sampling three cores of a 1-mm diameter for each component. Cores were arranged as a 90-core format array into a new paraffin block. TMAs were constructed with the VTA-100 semi-automated tissue arrayer (Veridiam, Oceanside, CA, USA). All the 94 sRCC and 86 ccRCC (20 with grade 4, 57 with grade 3, and 9 with grade 2 were included in the TMA blocks.
Immunohistochemical analysis
Immunohistochemical analysis for expression of PD-L1 (E1L3N, 1:100 dilution; Cell Signaling Technology, Danvers, MA), PD-1 (EPR4877(2), 1:250 dilution; Epitomics, Burlingame, CA), CD4 (4B12, 1:80 dilution; Leica Biosystems, Wetzlar, Germany), and CD8 (C8/144B, 1:25 dilution; Thermo Fisher Scientific, Waltham, MA) was performed. Sections were stained with primary antibodies on a BOND-MAX stainer (Leica Biosystems). The immunohistochemical reaction was detected using the Leica Bond Polymer Refine detection kit (Leica Biosystems), and 3,3′-diaminobenzidine was used as the chromogen. PD-L1 and PD-1 staining was done in whole sections and CD4 and CD8 staining was done in TMA. Cores without at least 50% tumor tissue in the sampled area due to core folding or loss, extensive necrosis, hemorrhage or too little tumor tissue were eliminated. 6% of TMA-arrayed cases for each staining had to be excluded from the study based on this requirement. The total number of TMA-arrayed sRCC cases amenable to image analysis was 88.
For automated image analysis, stained slides were scanned into high-resolution digital images using an Aperio AT Turbo (Leica Biosystems). Image analysis was performed using Aperio Image Toolbox analysis software (Leica Biosystems).
Five 1-mm2 areas within the tumor region from sarcomatoid and epithelioid components from each case were individually chosen by a pathologist (FK) for PD-L1 digital analysis. Tumor PD-L1 expression was evaluated by a semi-quantitative method, the H-score (percentage of positive cells showing membranous staining pattern [0–100] × intensity of the staining [0–3]) (Figure 1). The mean H-score of the five areas was calculated for each case, and mean H-scores were calculated separately for the epithelioid and sarcomatoid components of sRCC. As a quality control measure, two pathologists (FK and KS) manually evaluated PD-L1 tumor positivity, defined as ≥5% tumor cell membrane staining independently9, 10. Cases in which the H-score differed from the results of manual evaluation, owing to diffuse infiltration of PD-L1–stained immune and endothelial cells in the tumor area and cytoplasmic PD-L1 staining of tumor cells, were excluded from the study. For PD-L1 immunohistochemistry, among 94 sRCC cases, digital immunohistochemical analysis was possible in both sarcomatoid and epithelioid components in only 84 cases (66 cc-sRCC cases and 18 non-cc-sRCC cases). PD-L1 expression in either epithelioid or sarcomatoid component, but not both, was calculated in the remaining 10 cases.
Figure 1.
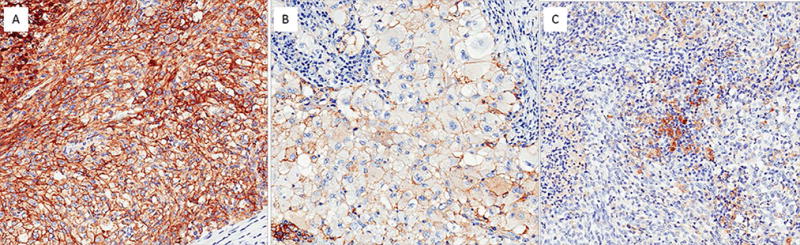
PD-L1 immunohistochemical staining in patients with sRCC. Membranous staining is present in the sarcomatoid tumor component (A) and the epithelioid component (B). (C) In this case, only tumor-infiltrated macrophages and lymphocytes showed weak to moderate cytoplasmic positivity.
Five 1-mm2 areas within the intratumoral region and within the peritumoral region from sarcomatoid and epithelioid components from each case were individually chosen by a pathologist (FK) for PD-1 digital analysis. Histology assessment of each 1 mm2 was performed to ensure that tumor tissue presented in the selected intratumoral region, and only non-malignant cells were included in the peritumoral region as previously described11. The mean number of PD-1–positive immune cells per 1 mm2 within the intratumoral region and within the peritumoral region was calculated for sarcomatoid and epithelioid components separately. Intratumoral region could be evaluated 92 sarcomatoid component and 86 epithelioid component of sRCC, while peritumoral region could be evaluated in about half of the candidate cases (51 sarcomatoid component and 54 epithelioid component of sRCC).
For CD4 and CD8 evaluation, TMA was scored as the median number of counted cells per 1mm2 average of all cores from each case.
Tumor microenvironment categorization was done based on the density of TILs and the expression of PD-L112: type I (adaptive immune resistance), type II (immunological ignorance), type III (intrinsic induction), and type IV (tolerance). Combining tumor PD-L1 expression (H-score ≥10 was considered as positive) with the density of cells expressing CD4 or CD8 using three levels (tertile) divided based on regular values of distribution (moderate and severe density were considered positive)11.
Statistical analysis
Clinical characteristics of the population were compared between epithelioid and sarcomatoid components using a Kruskal-Wallis test. A Wilcoxon signed-rank test was conducted when comparing epithelioid vs. sarcomatoid component based on PD-L1 expression and number of PD-1 (intratumoral region and peritumoral region), CD4, and CD8 positive lymphocytes. Overall survival (OS) was defined as the time from surgery to death. In the absence of an event, end points were censored at last follow-up time. OS was estimated using the Kaplan-Meier product-limit estimator and was compared between PD-L1–positive and PD-L1–negative groups. The correlations between lymphocyte infiltration and PD-L1 expression, lymphocyte infiltration and PD-1 expression, and PD-L1 and PD-1 expression were assessed using Spearman correlation coefficients (i.e., Spearman’s ρ).
An analysis of variance model was created to determine whether there was a difference in expression levels between clear cell groups (epithelioid, sarcomatoid, grade 2, grade 3, and grade 4). If the analysis of variance indicated a difference between these groups, a Tukey-Kramer pairwise comparison test was conducted to determine which groups differed. A P value (two-sided) of <0.05 was considered statistically significant.
Analysis was done with SPSS Statistics 24 (IBM Corp., Armonk, NY). Scatter diagrams are drawn with GraphPad Prism 6 (GraphPad Software Inc., La Jolla, CA).
TCGA data analysis
We studied the alterations of CD274 (PD-L1) and genes that were related to antigen presentation (HLA-A, HLA-B, HLA-C, HLA-G, HLA-DPB1, and TAP1) and T-cell-mediated immunity (CD3D, CD8A, IL2RA, IL7R, IDO1, CD4, CD27, CD28, CCL5, and CCR5), as well as reported genes which are frequently altered in sRCC (TP53, PTEN, RELN, CDKN2A, and NF2) in in Kidney Renal Clear Cell Carcinoma (TCGA, Nature 2013) case set using c-BioPortal (http://cbioportal.org). Frequency of genomic alteration events including mutations, putative copy-number alteration from GISTIC, mRNA expression Z-scores (RNA Seq V2 RSEM) with Z-score thresholds ±2.0, and protein expression (RPPA) with Z-score thresholds ±2.0 were evaluated in the 469 patients with mRNA data (RNA Seq V2).
RESULTS
Patient characteristics
Of the 118 patients with sRCC, 21 patients who received neoadjuvant therapy and three patients whose digitally calculated H-scores differed from manual evaluation results were excluded from the study, leaving 94 patients with sRCC for analysis (Supplementary figure 1). Patient characteristics are summarized in Table 1. The median tumor diameter was 10.8 cm (range, 1.1–27 cm). Seventy-four cases (78.7%) were cc-sRCC (Supplementary table 2). The median follow-up time of the cohort was 11 months (Interquartile range [IQR], 7–27 months). Seventy-six patients (80.9%) died of their disease during the follow-up period. Median follow-up time for survivors was 48 months (IQR, 21–107 months).
PD-L1 expression and survival in sRCC overall
Among the sRCC cases, the median H-score for PD-L1 expression was significantly higher in the sarcomatoid component (3.7; range, 0–192.1) than in the epithelioid component (0.2; range, 0–222.0; P<0.001) (Table 2).
Table 2.
Correlation of PD-L1 expression and clinicopathologic features in patients with sRCC
| Clinicopathologic feature | N | Median PD-L1 H-score (range) | P | |
|---|---|---|---|---|
| All sRCC | ||||
| Epithelioid component | 86 | 0.2 (0–222.0) | <0.001* | |
| Sarcomatoid component | 92 | 3.7 (0–192.1) | ||
| Sex | Male | 48 | 1.4 (0–192.1) | 0.077 |
| Female | 44 | 9.6 (0–151.4) | ||
| Age | <60 years | 47 | 8.3 (0–192.1) | 0.033* |
| ≥60 years | 45 | 1.4 (133.3) | ||
| Tumor size | <10.8 cm | 46 | 9.8 (0–151.4) | 0.439 |
| ≥10.8 cm | 46 | 1.8 (0–192.1) | ||
| Sarcomatoid percentage | <10% | 14 | 5.4 (0–64.4) | 0.615 |
| 10%–30% | 21 | 3.5 (0–57.7) | ||
| ≥30% | 57 | 2.6 (0–192.1) | ||
| Stage | I and II | 6 | 0.7 (0–44.8) | 0.522 |
| III | 28 | 3.9 (0–151.4) | ||
| IV | 58 | 4.5 (0–192.1) | ||
| pT category | 1 and 2 | 8 | 0.7 (0–151.4) | 0.147 |
| 3 | 64 | 5.5 (0–192.1) | ||
| 4 | 20 | 1.0 (0–147.3) | ||
| pN category | 0 | 33 | 1.6 (0–192.1) | 0.589 |
| 1 | 31 | 5.7 (0–151.4) | ||
| X | 28 | 2.2 (0–110.8) | ||
| M category | 0 | 45 | 1.6 (0–151.4) | 0.103 |
| 1 | 47 | 8.3 (0–192.1) | ||
| ccRCC | ||||
| Sarcomatoid cases | <0.001* | |||
| Epithelioid component | 67 | 0.2 (0–222.0) | ||
| Sarcomatoid component | 73 | 1.8 (192.1) | ||
| Non-sarcomatoid cases | ||||
| Grade 4 | 20 | 0.4 (0–39.1) | ||
| Grade 3 | 58 | 0.1 (0–1.6) | ||
| Grade 2 | 14 | 0 (0–0.2) | ||
| Non-cc-sRCC | ||||
| Epithelioid component | 19 | 1.2 (0–129.0) | 0.058 | |
| Sarcomatoid component | 19 | 5.7 (0.1–151.4) |
SD: standard deviation
In the sarcomatoid component of sRCC, higher PD-L1 H-score was associated with younger age (<60 years) at the time of surgery (P=0.033) but not with sex, TNM classification, disease stage, tumor size, or percentage of sarcomatoid component (Table 2).
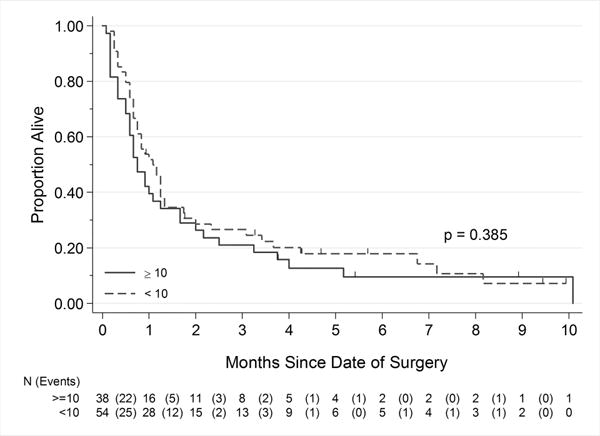
Survival analysis according to PD-L1 expression H-score was performed for 92 sRCC cases with patients with at least 1 year of clinical follow-up (or shorter in case of death). All cases of sRCC with PD-L1 positivity on manual evaluation showed an H-score of ≥10. Using this threshold, 41.3% of sRCC cases were PD-L1 positive, and there was no significant survival difference between PD-L1–positive and PD-L1–negative groups (P=0.385).
PD-L1 expression in cc-sRCC and non-sarcomatoid ccRCC
Among the cc-sRCC cases (N=74), the median PD-L1 H-score in the sarcomatoid component (1.8; range, 0–192.1) was significantly higher than that in the epithelioid component (0.2; range, 0–222.0; P<0.001) (Table 2). In 43.2% of cc-sRCC cases, the PD-L1 H-score was ≥10 in at least one of these components.
In the non-sarcomatoid ccRCC cases (controls), the PD-L1 H-scores in the grade 4, 3, and 2 ccRCCs were significantly lower than that in the sarcomatoid component of cc-sRCC (P=0.001) (Table 2 and Figure 3) and only 2.2% of ccRCCs were PD-L1 positive (10% of grade 4, 0% of grade 3, and 0% of grade 2).
Figure 3.
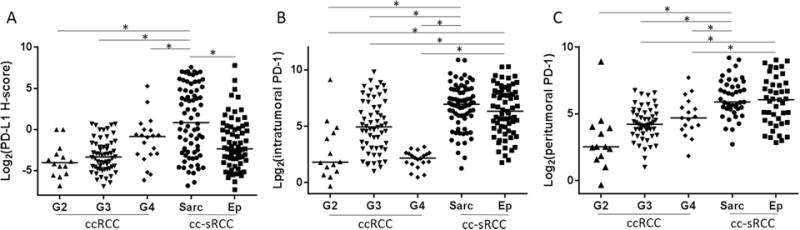
Tumor PD-L1 expression and infiltrating PD-1–positive cells status in clear cell sarcomatoid and non-sarcomatoid ccRCC. (A) PD-L1 expression in the sarcomatoid component of sRCC was significantly higher than in the epithelioid component and in Fuhrman grades 2, 3, and 4 pure epithelioid ccRCC. Although there was no difference in PD-1–positive cell density in the intratumoral region (B) or in the peritumoral region (C) between the sarcomatoid component and the epithelioid component in sRCC, both components had higher PD-1–positive cell density in both areas than Fuhrman grades 2, 3 and 4 pure epithelioid RCC. Sarc; sarcomatoid component, Ep; epithelioid component.
PD-L1 expression in non-cc-sRCC
Among the 20 non-cc-sRCC cases, 11 (55.0%) showed PD-L1 H-scores of ≥10, including three of five chromophobe sRCCs, five of 10 papillary sRCCs, and three of three collecting duct sRCCs.
The median PD-L1 H-score in the sarcomatoid component of non-cc-sRCC was 5.7 (range, 0.1–151.4), while that in the epithelioid component was 1.2 (range, 0–129.0). Although the median H-score of the sarcomatoid component of non-cc-sRCC was higher than that of the epithelioid component, the difference was not statistically significant (P=0.058), likely because of the small patient numbers in this subgroup (Table 2).
PD-1–positive cell density in sRCC and non-sarcomatoid ccRCC in the intratumoral region and peritumoral region
We found that PD-1–positive cell density was significantly higher in sRCC than in non-sarcomatoid ccRCC within the intratumoral region and peritumoral region (Table 3). The sarcomatoid component contained a significantly higher density of PD-1–positive cells than the epithelioid component in the intratumoral region (P=0.039) and cc-sRCC contained a significantly higher density of PD-1–positive cells within the tumor and peritumoral region than did grade 4 non-sarcomatoid ccRCC (Table 3) There was no significant difference in survival between cases with a high density of PD-1–positive cells (PD-1 density higher than the median PD-1 density of sRCCs) and those with a low density of PD-1–positive cells (PD-1 density lower than or equal to the median PD-1 density of sRCCs) in either the peritumoral region or the intratumoral region in multivariable analysis. (Supplementary Table 4).
Table 3.
Correlation of PD-1 expression and clinicopathologic features in patients with sRCC
| Clinicopathologic feature | Peritumoral region
|
Intratumoral region
|
||||
|---|---|---|---|---|---|---|
| N | Median PD-1,/mm2 (range) | P | N | Median PD-1,/mm2 (range) | P | |
| All sRCC | ||||||
| Epithelioid component | 54 | 59.1 (7.2–531.2) | 0.304 | 86 | 51.5 (6–1242.4) | 0.039* |
| Sarcomatoid component | 51 | 59.6 (6.6–593.6) | 92 | 117.7 (2.4–1895.4) | ||
| ccRCC | ||||||
| Sarcomatoid cases | ||||||
| Epithelioid component | 43 | 66.8 (7.2–531.2) | <0.001* | 67 | 80.2 (3.4–1242.4) | <0.001* |
| Sarcomatoid component | 43 | 59.6 (6.6–593.6) | 73 | 123.6 (2.4–1895.4) | ||
| Non-sarcomatoid cases | ||||||
| Grade 4 | 17 | 26.0 (3.6–212.4) | 20 | 24.5 (2.2–178.8) | ||
| Grade 3 | 52 | 18.7 (2.0–108.8) | 58 | 30.8 (2.0–909.4) | ||
| Grade 2 | 13 | 5.8 (0.8–489.6) | 14 | 24.5 (0.8–560.0) | ||
| Non-cc-sRCC | ||||||
| Epithelioid component | 11 | 42.0 (8.8–115.0) | 0.068 | 19 | 22.2 (1.6–422.2) | 0.028* |
| Sarcomatoid component | 8 | 60.3 (12.2–144.2) | 19 | 34.6 (6.8–902.8) | ||
CD4- and CD8-positive cell density in sRCC and non-sarcomatoid ccRCC and type of microenvironment
Tumor infiltrating helper T-cells (CD4+) and cytotoxic T-cells (CD8+) were evaluated. We observed that cc-sRCC, both sarcomatoid (P<0.0001) and epithelioid component (P=0.0139), had significantly higher density of cytotoxic T-cells than non-sarcomatoid ccRCC (Supplementary Figure 2). The patients with high number of CD8+ in epithelioid component (CD8+ density higher than the median CD8+ density of sRCCs) experienced shorter OS in univariate and multivariable analysis (Supplementary Table 4).
When combining PD-L1 expression in tumor cells with the density of tumor infiltrating lymphocytes (density of cells with CD4+ or CD8+), as proposed by Teng et al.12, we classified patients into the four subtypes of tumor’ microenvironment (Supplementary Table 3). This analysis showed that 41% in sarcomatoid component of sRCC and 8% in epithelioid component of sRCC had an adaptive immune resistance (Type I) phenotype, while only 1% in non-sarcomatoid RCC had Type I phenotype. The pattern most frequently observed (sarcomatoid component of sRCC 41%, epithelioid component of sRCC 55%, and non-sarcomatoid ccRCC 54%) was that of tumors with immune tolerance pattern (Type IV) defined as positive TILs without PD-L1 expression in tumor cells. Cases with negative PD-L1 expression and negative TILs defined as tumors with immunologic ignorance pattern (Type II) were found in 17% of sarcomatoid component of sRCC, 35% of epithelioid component of sRCC, and 44% of non-sarcomatoid ccRCC. Tumors with the intrinsic induction patters (Type III, positive PD-L1 and negative TILs) were less frequently detected (sarcomatoid component of sRCC 1%, epithelioid component of sRCC 2%, and non-sarcomatoid ccRCC 1%).
TCGA data analysis
mRNA CD274 upregulation was significantly correlated with mRNA upregulation of some genes related to antigen presentation (HLA-B: P=0.026, HLA-DPB1: P<0.001, TAP1: P<0.001), and chemokine receptor (CCR5: P<0.001). There is no significant correlation between mRNA upregulation of CD274 and gene alteration which was previously described in sRCC (Supplementary Figure 3).
DISCUSSION
In this large tissue-based cohort study of surgically resected sRCC, we found sRCC showed more frequently positive for PD-L1 compared to that of non-sarcomatoid ccRCC. Although sRCC is defined as grade 4 RCC, PD-L1 expression in cc-sRCC was even higher than non-sarcomatoid grade 4 ccRCC. Furthermore, sRCC was associated with a more pronounced cytotoxic T-cell infiltrate and adaptive immune resistant phenotype in its major tumor microenvironment, based on PD-L1 expression and TIL status. These data suggest that cc-sRCC is distinct from non-sarcomatoid ccRCC at the level of immune markers with an inflammatory histology. This could indicate the biological distinctiveness of sRCC, with potential therapeutic implications.
Two recent reports studied PD-1 and PD-L1 expression in sRCC. Joseph et al.9 collected 26 sRCCs and 29 non-sarcomatoid ccRCCs, performed immunohistochemical analysis for PD-1 and PD-L1 in whole sections, and found increased expression of PD-L1 on tumor cells (54% of sRCCs and 17% of non-sarcomatoid ccRCCs; P=0.006) concurrent with PD-1–positive TILs in sRCC (96% of sRCCs and 62% of non-sarcomatoid ccRCCs; P=0.003). For sRCC cases, the authors evaluated only the sarcomatoid component. Shin et al.10 collected 54 cc-sRCCs and 9 papillary sRCCs as well as non-sarcomatoid RCCs, and evaluated their PD-L1, PD-L2, and PD-1 expression using a TMA. They reported that PD-L1 positivity was significantly higher in cc-sRCCs (29.6% of sRCCs and 7.3% of non-sarcomatoid ccRCCs; P<0.001), but not in papillary RCCs. They did not note which component (sarcomatoid or epithelioid) of sRCC was evaluated. The limitations of these 2 prior studies are their relatively small case numbers and the inadequacy of the control cases. In both studies, the sarcomatoid and epithelioid components in sRCC were not separately evaluated. In addition, the control cases were not stratified by histologic grade. Since previous reports suggested that higher PD-L1 expression in the tumor cell membrane was correlated with higher Fuhrman grade4, 15, 16, we believe it is important to compare immune checkpoint marker status between sRCC and high-grade non-sarcomatoid ccRCC specifically. Regarding immunohistochemical evaluation methodologies, both studies counted tumor cytoplasmic stains of PD-L1 as positive. Reported clinical trials generally defined ≥5% of tumor membranous staining as PD-L1 positive17, 18. Thus, the two previous reports might have overestimated the PD-L1–positive rate.
RCC is an immunogenic tumor and prior literature suggests that the presence of specific T-lymphocyte subsets in RCC could be associated with prognostic value. For example, patients with CD45RO+ T-cell rich RCC showed shorter overall survival than patients with CD45RO+ T-cell poor RCC19. Although high intratumoral CD4+ T-cell infiltration and both higher peripheral blood regulatory T-cells count and high intratumoral Foxp3+ regulatory T-cell infiltration were associated with poor prognosis in RCC19–22, the role of CD8+ T-cells in RCC is still controversial; some studies showed CD8+ T-cell infiltration in RCC has no survival impact19, other reports showed that CD8+ T-cell rich RCC is associated with poor survival23, 24, while one study showed that a CD8+ T-cell rich phenotype was observed in renal tumors of long-term surviving patients25. There are also a few literatures described about relationship between PD-L1 expression in RCC tumor cells and TIL fractionation. Higher level of tumor PD-L1 expression was associated with low relative ratios of CD8+ to Foxp3+ T-cells in metastatic RCC26.
In this study, we studied TIL markers in sRCC and found an inflammatory infiltrate-rich histology with PD-L1 expression. We found more frequent PD-1 and CD8+ cell infiltration in sRCC compared with non-sarcomatoid ccRCC, with more sarcomatoid component of sRCC cases classified as Type I (adaptive immune resistance pattern)12, compared to their epithelioid component, ccRCC cases, and reported other tumor types, such as non-small cell lung cancer11 and melanoma27. The tumors with Type I tumor microenvironment are thought to be the group that largely responds to immune checkpoint blockade27, 28 and are most likely to benefit from single–agent anti-PD-1/PD-L1 blockade, as these tumors have evidence of preexisting intratumoral T cells that are turned off by PD-L1 engagement.
Our current study is different from prior studies on this topic as it has a larger number of sRCC cases, and more importantly, adequate non-sarcomatoid ccRCC controls. Specifically, we describe the difference in PD-L1 expression status between cc-sRCC and grade 4 non-sarcomatoid ccRCC, which we believe to be the most adequate control group (given that both are grade 4). Our study is also significant because we evaluated epithelioid and sarcomatoid components separately and we found that PD-1/PD-L1 expression in the epithelioid component of sRCC was significantly higher than that in grade 4 non-sarcomatoid ccRCC. Since the median amount of sarcomatoid component in sRCC tumors is 40%–50% and so might not be sampled by biopsy of a patient with sRCC, our finding is essential to know before considering assaying for PD-L1/PD-1 status based on biopsy specimens. There may be intratumoral heterogeneity in addition to morphologic diversity. Furthermore, our results show a difference in immune marker status between sRCC and non-sarcomatoid grade 4 ccRCC, indicating that cc-sRCC is distinct from non-sarcomatoid ccRCC at the level of immune markers. These data indicate the biologic distinctiveness of sRCC and have potential therapeutic implications for novel immune therapy. This study is also methodologically distinctive, as immunohistochemical results were not only digitally analyzed to secure high reproducibility and quantification, but were concurrently confirmed using manual evaluation with a standard positivity threshold of 5% tumor membranous expression.
The limitation of this study is lack of gene expression data. It would be interesting to study whether PD-L1 protein expression in sRCC is correlated with the expression of CD274 (PD-L1) mRNA and genes related to antigen presentation and T-cell-mediated immunity, as well as gene signature which may be linked to sarcomatoid features. TCGA data revealed that mRNA CD274 upregulation was significantly correlated with mRNA upregulation of HLA genes and chemokine receptor, suggesting a close link between upregulation of PD-L1 and inflammatory tumor microenvironment in ccRCC. Although we could not find any significant correlation between mRNA upregulation of CD274 and gene alteration which was previously described in sRCC29, 30,TCGA is not the ideal setting to study sRCC and contains only a few sRCC cases. In addition, data on sRCC in TCGA were obtained only from the epithelioid component. Further molecular-protein expression correlation studies are needed in sRCC.
In conclusion, sRCC is more frequently positive for PD-L1 and shows higher PD-L1 expression than non-sarcomatoid ccRCC regardless of its epithelioid component histology. cc-sRCC shows higher frequency and stronger expression of PD-L1 than non-sarcomatoid grade 4 ccRCC. Since a large part of sRCC carries an adaptive immune resistance tumor microenvironment, checkpoint blockade could be a particularly promising therapeutic agent for sRCC.
Supplementary Material
Figure 2.
Correlation of PD-L1 expression level and overall survival in the sarcomatoid component of sRCC. A cutoff H-score of ≥10 showed good correlation with manual immunohistochemical evaluation results but not with overall survival
Condensed Abstract.
Sarcomatoid RCC expressed PD-L1 more frequently and contained more TILs including PD-1–positive T-cells than grade 4 clear cell RCC did. Many sarcomatoid RCC carries an adaptive immune resistance phenotype and PD-1/PD-L1 blockade therapy could be a promising therapeutic approach.
Acknowledgments
Financial support: The University of Texas MD Anderson Cancer Center Biostatistics Resource Group is supported in part by the National Institutes of Health through Cancer Center Support Grant P30CA016672.
Footnotes
Conflicts of interest: JAK has acted as a consultant/advisory board member for Pfizer, EMD Serono, Novartis. No conflict of interest related to this work/manuscript.
Author Contributions: Fumi Kawakami: Study concept and design, acquisition of data, analysis and interpretation of data, drafting of the article, and critical revision of the article for important intellectual content. Kanishka Sircar: Study concept and design, acquisition of data and analysis, interpretation of data, and critical revision of the article for important intellectual content. Jaime Rodriguez-Canales: Analysis and interpretation of data. Bryan M. Fellman: Statistical analysis of data and critical revision of the article for important intellectual content. Diana L. Urbauer: Statistical analysis of data. Pheroze Tamboli: Acquisition of data and analysis and interpretation of data. Nizar M. Tannir: Analysis and interpretation of data. Eric Jonasch: Analysis and interpretation of data. Ignacio I. Wistuba: Study concept and design, acquisition of data, and analysis and interpretation of data. Christopher G. Wood: Study concept and design, acquisition of data, and analysis and interpretation of data Jose A. Karam: Study concept and design, acquisition of data, analysis and interpretation of data, critical revision of the article for important intellectual content, obtained funding, and study supervision.
References
- 1.Beuselinck B, Lerut E, Wolter P, et al. Sarcomatoid dedifferentiation in metastatic clear cell renal cell carcinoma and outcome on treatment with anti-vascular endothelial growth factor receptor tyrosine kinase inhibitors: a retrospective analysis. Clin Genitourin Cancer. 2014;12:e205–214. doi: 10.1016/j.clgc.2014.04.004. [DOI] [PubMed] [Google Scholar]
- 2.Golshayan AR, George S, Heng DY, et al. Metastatic sarcomatoid renal cell carcinoma treated with vascular endothelial growth factor-targeted therapy. J Clin Oncol. 2009;27:235–241. doi: 10.1200/JCO.2008.18.0000. [DOI] [PubMed] [Google Scholar]
- 3.Molina AM, Tickoo SK, Ishill N, et al. Sarcomatoid-variant renal cell carcinoma: treatment outcome and survival in advanced disease. Am J Clin Oncol. 2011;34:454–459. doi: 10.1097/COC.0b013e3181f47aa4. [DOI] [PMC free article] [PubMed] [Google Scholar]
- 4.Thompson RH, Kuntz SM, Leibovich BC, et al. Tumor B7-H1 is associated with poor prognosis in renal cell carcinoma patients with long-term follow-up. Cancer Res. 2006;66:3381–3385. doi: 10.1158/0008-5472.CAN-05-4303. [DOI] [PubMed] [Google Scholar]
- 5.Lipson EJ, Sharfman WH, Drake CG, et al. Durable cancer regression off-treatment and effective reinduction therapy with an anti-PD-1 antibody. Clin Cancer Res. 2013;19:462–468. doi: 10.1158/1078-0432.CCR-12-2625. [DOI] [PMC free article] [PubMed] [Google Scholar]
- 6.Beuselinck B, Job S, Becht E, et al. Molecular subtypes of clear cell renal cell carcinoma are associated with sunitinib response in the metastatic setting. Clin Cancer Res. 2015;21:1329–1339. doi: 10.1158/1078-0432.CCR-14-1128. [DOI] [PubMed] [Google Scholar]
- 7.Wang Y, Wang H, Zhao Q, Xia Y, Hu X, Guo J. PD-L1 induces epithelial-to-mesenchymal transition via activating SREBP-1c in renal cell carcinoma. Med Oncol. 2015;32:655. doi: 10.1007/s12032-015-0655-2. [DOI] [PubMed] [Google Scholar]
- 8.Mikami S, Katsube K, Oya M, et al. Expression of Snail and Slug in renal cell carcinoma: E-cadherin repressor Snail is associated with cancer invasion and prognosis. Lab Invest. 2011;91:1443–1458. doi: 10.1038/labinvest.2011.111. [DOI] [PubMed] [Google Scholar]
- 9.Joseph RW, Millis SZ, Carballido EM, et al. PD-1 and PD-L1 Expression in Renal Cell Carcinoma with Sarcomatoid Differentiation. Cancer Immunol Res. 2015 doi: 10.1158/2326-6066.CIR-15-0150. [DOI] [PMC free article] [PubMed] [Google Scholar]
- 10.Shin SJ, Jeon YK, Kim PJ, et al. Clinicopathologic Analysis of PD-L1 and PD-L2 Expression in Renal Cell Carcinoma: Association with Oncogenic Proteins Status. Ann Surg Oncol. 2015 doi: 10.1245/s10434-015-4903-7. [DOI] [PubMed] [Google Scholar]
- 11.Parra ER, Behrens C, Rodriguez-Canales J, et al. Image Analysis-based Assessment of PD-L1 and Tumor-Associated Immune Cells Density Supports Distinct Intratumoral Microenvironment Groups in Non-small Cell Lung Carcinoma Patients. Clin Cancer Res. 2016 doi: 10.1158/1078-0432.CCR-15-2443. [DOI] [PMC free article] [PubMed] [Google Scholar]
- 12.Teng MW, Ngiow SF, Ribas A, Smyth MJ. Classifying Cancers Based on T-cell Infiltration and PD-L1. Cancer Res. 2015;75:2139–2145. doi: 10.1158/0008-5472.CAN-15-0255. [DOI] [PMC free article] [PubMed] [Google Scholar]
- 13.Choueiri TK, Figueroa DJ, Fay AP, et al. Correlation of PD-L1 tumor expression and treatment outcomes in patients with renal cell carcinoma receiving sunitinib or pazopanib: results from COMPARZ, a randomized controlled trial. Clin Cancer Res. 2015;21:1071–1077. doi: 10.1158/1078-0432.CCR-14-1993. [DOI] [PubMed] [Google Scholar]
- 14.Budczies J, Klauschen F, Sinn BV, et al. Cutoff Finder: a comprehensive and straightforward Web application enabling rapid biomarker cutoff optimization. PLoS One. 2012;7:e51862. doi: 10.1371/journal.pone.0051862. [DOI] [PMC free article] [PubMed] [Google Scholar]
- 15.Thompson RH, Gillett MD, Cheville JC, et al. Costimulatory molecule B7-H1 in primary and metastatic clear cell renal cell carcinoma. Cancer. 2005;104:2084–2091. doi: 10.1002/cncr.21470. [DOI] [PubMed] [Google Scholar]
- 16.Thompson RH, Dong H, Kwon ED. Implications of B7-H1 expression in clear cell carcinoma of the kidney for prognostication and therapy. Clin Cancer Res. 2007;13:709s–715s. doi: 10.1158/1078-0432.CCR-06-1868. [DOI] [PubMed] [Google Scholar]
- 17.Brahmer JR, Drake CG, Wollner I, et al. Phase I study of single-agent anti-programmed death-1 (MDX-1106) in refractory solid tumors: safety, clinical activity, pharmacodynamics, and immunologic correlates. J Clin Oncol. 2010;28:3167–3175. doi: 10.1200/JCO.2009.26.7609. [DOI] [PMC free article] [PubMed] [Google Scholar]
- 18.Topalian SL, Hodi FS, Brahmer JR, et al. Safety, activity, and immune correlates of anti-PD-1 antibody in cancer. N Engl J Med. 2012;366:2443–2454. doi: 10.1056/NEJMoa1200690. [DOI] [PMC free article] [PubMed] [Google Scholar]
- 19.Hotta K, Sho M, Fujimoto K, et al. Prognostic significance of CD45RO+ memory T cells in renal cell carcinoma. Br J Cancer. 2011;105:1191–1196. doi: 10.1038/bjc.2011.368. [DOI] [PMC free article] [PubMed] [Google Scholar]
- 20.Griffiths RW, Elkord E, Gilham DE, et al. Frequency of regulatory T cells in renal cell carcinoma patients and investigation of correlation with survival. Cancer Immunol Immunother. 2007;56:1743–1753. doi: 10.1007/s00262-007-0318-z. [DOI] [PMC free article] [PubMed] [Google Scholar]
- 21.Kang MJ, Kim KM, Bae JS, et al. Tumor-infiltrating PD1-Positive Lymphocytes and FoxP3-Positive Regulatory T Cells Predict Distant Metastatic Relapse and Survival of Clear Cell Renal Cell Carcinoma. Transl Oncol. 2013;6:282–289. doi: 10.1593/tlo.13256. [DOI] [PMC free article] [PubMed] [Google Scholar]
- 22.Liotta F, Gacci M, Frosali F, et al. Frequency of regulatory T cells in peripheral blood and in tumour-infiltrating lymphocytes correlates with poor prognosis in renal cell carcinoma. BJU Int. 2011;107:1500–1506. doi: 10.1111/j.1464-410X.2010.09555.x. [DOI] [PubMed] [Google Scholar]
- 23.Nakano O, Sato M, Naito Y, et al. Proliferative activity of intratumoral CD8(+) T-lymphocytes as a prognostic factor in human renal cell carcinoma: clinicopathologic demonstration of antitumor immunity. Cancer Res. 2001;61:5132–5136. [PubMed] [Google Scholar]
- 24.Giraldo NA, Becht E, Pages F, et al. Orchestration and Prognostic Significance of Immune Checkpoints in the Microenvironment of Primary and Metastatic Renal Cell Cancer. Clin Cancer Res. 2015;21:3031–3040. doi: 10.1158/1078-0432.CCR-14-2926. [DOI] [PubMed] [Google Scholar]
- 25.Weiss JM, Gregory Alvord W, Quinones OA, Stauffer JK, Wiltrout RH. CD40 expression in renal cell carcinoma is associated with tumor apoptosis, CD8(+) T cell frequency and patient survival. Hum Immunol. 2014;75:614–620. doi: 10.1016/j.humimm.2014.04.018. [DOI] [PMC free article] [PubMed] [Google Scholar]
- 26.Baine MK, Turcu G, Zito CR, et al. Characterization of tumor infiltrating lymphocytes in paired primary and metastatic renal cell carcinoma specimens. Oncotarget. 2015;6:24990–25002. doi: 10.18632/oncotarget.4572. [DOI] [PMC free article] [PubMed] [Google Scholar]
- 27.Taube JM, Anders RA, Young GD, et al. Colocalization of inflammatory response with B7-h1 expression in human melanocytic lesions supports an adaptive resistance mechanism of immune escape. Sci Transl Med. 2012;4:127ra137. doi: 10.1126/scitranslmed.3003689. [DOI] [PMC free article] [PubMed] [Google Scholar]
- 28.Taube JM, Klein A, Brahmer JR, et al. Association of PD-1, PD-1 ligands, and other features of the tumor immune microenvironment with response to anti-PD-1 therapy. Clin Cancer Res. 2014;20:5064–5074. doi: 10.1158/1078-0432.CCR-13-3271. [DOI] [PMC free article] [PubMed] [Google Scholar]
- 29.Bi M, Zhao S, Said JW, et al. Genomic characterization of sarcomatoid transformation in clear cell renal cell carcinoma. Proc Natl Acad Sci U S A. 2016;113:2170–2175. doi: 10.1073/pnas.1525735113. [DOI] [PMC free article] [PubMed] [Google Scholar]
- 30.Malouf GG, Ali SM, Wang K, et al. Genomic Characterization of Renal Cell Carcinoma with Sarcomatoid Dedifferentiation Pinpoints Recurrent Genomic Alterations. Eur Urol. 2016;70:348–357. doi: 10.1016/j.eururo.2016.01.051. [DOI] [PubMed] [Google Scholar]
Associated Data
This section collects any data citations, data availability statements, or supplementary materials included in this article.