

Abstract
Nucleotide excision repair (NER) in mammalian cells requires the xeroderma pigmentosum group A protein (XPA) as a core factor. Remarkably, XPA and other NER proteins have been detected by chromatin immunoprecipitation at some active promoters, and NER deficiency is reported to influence the activated transcription of selected genes. However, the global influence of XPA on transcription in human cells has not been determined. We analyzed the human transcriptome by RNA sequencing (RNA-Seq). We first confirmed that XPA is confined to the cell nucleus even in the absence of external DNA damage, in contrast to previous reports that XPA is normally resident in the cytoplasm and is imported following DNA damage. We then analyzed four genetically matched human cell line pairs deficient or proficient in XPA. Of the ∼14,000 genes transcribed in each cell line, 325 genes (2%) had a significant XPA-dependent directional change in gene expression that was common to all four pairs (with a false discovery rate of 0.05). These genes were enriched in pathways for the maintenance of mitochondria. Only 27 common genes were different by more than 1.5-fold. The most significant hits were AKR1C1 and AKR1C2, involved in steroid hormone metabolism. AKR1C2 protein was lower in all of the immortalized XPA-deficient cells. Retinoic acid treatment led to modest XPA-dependent activation of some genes with transcription-related functions. We conclude that XPA status does not globally influence human gene transcription. However, XPA significantly influences expression of a small subset of genes important for mitochondrial functions and steroid hormone metabolism. The results may help explain defects in neurological function and sterility in individuals with xeroderma pigmentosum.
Keywords: Nucleotide excision repair, Transcription, Nucleus, DNA repair, DNA damage
1. Introduction
Nucleotide excision repair is the only pathway that mammalian cells have available for the removal of the major DNA lesions arising from ultraviolet (UV) radiation damage. NER also repairs helix-distorting lesions produced by reactive chemicals and other types of radiation. The NER process excises damage within a 24–32 nt oligonucleotide, followed by repair synthesis and ligation to complete repair. About 30 polypeptides are needed for the basal NER process [1–3]. The main pathway of global genomic NER involves distortion recognition by XPC-RAD23B, formation of a pre-incision damage recognition complex including TFIIH, XPA and RPA, and incision of the damaged strand on the 5′ and 3′ sides by the ERCC1-XPF and XPG nucleases respectively.
In eukaryotes, most of the components of the NER machinery have major additional biological functions that are essential for normal viability. This has profound consequences for cells or organisms with mutations in NER genes. The ten subunits of TFIIH form a core initiation factor for basal transcription of all mRNAs, for example, and XPG also has a transcription-related function [4–6]. ERCC1-XPF participates in some homologous recombination reactions and in crosslink repair [7]. Consequently, complete disruption of some NER components is incompatible with cellular survival or embryonic development (for example, TFIIH subunits or RPA), while perinatal lethality occurs following disruption of other components (ERCC1, XPF, XPG). Mutations that partially disable these factors can lead to severe diseases in human beings.
Complete disruption of two major NER factors is tolerated. One of these is XPC, part of a distortion recognition complex. XPC disruption causes xeroderma pigmentosum (XP) in humans, with a relatively less severe phenotype than other complementation groups because a transcription-coupled form of NER remains intact. Nevertheless, even XPC is reported to have an additional function as a component of a transcription complex for specific genes [8].
The other NER factor that can be completely inactivated without impairing cell viability is XPA. This is notable, as XPA is absolutely required for NER. It is a scaffold protein that contacts many of the other NER protein components, and also binds to DNA [9–11] (Fig. 1A). XPA patients or mice without XPA function have no NER activity. Because each of the other NER factors has an identified additional function in cells, it is important to evaluate whether XPA also has a significant biological function other than NER. Broadly, elimination of XPA is compatible with mammalian development, growth, and cellular function. Patients with mutations that completely ablate XPA function are born, develop relatively normally and may live for several decades. Similarly, mice with complete XPA defects are born, develop normally, and have a near-normal lifespan, with a low background of spontaneous tumors occurring later in life [12,13].
Fig. 1. Description of XPA-proficient and deficient cell lines used in the study.
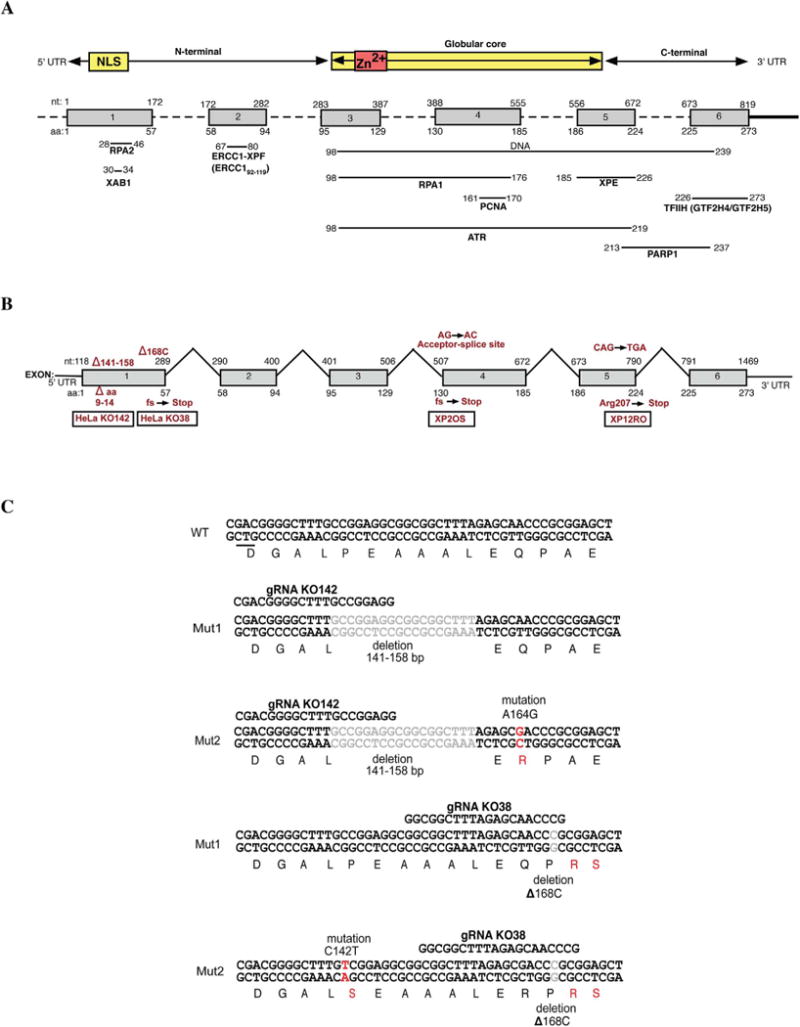
A. Top, human XPA protein showing the location of the central globular core in relation to the six coding exons (gray). The locations of the nuclear localization signal (NLS) and zinc finger (Zn2+) are shown. The bottom part of the panel shows mapped regions of XPA that interact with other proteins. B. The exon-intron structure of the human XPA gene showing the sites of the causative XPA mutation in each XPA-deficient cell line used here. C. Location of CRISPR-Cas9 mutations generated in the XPA gene of HeLa S3 cells. Two mutated HeLa cell lines were obtained using two guide RNAs (gRNA). KO142 had the indicated 18 bp deletion in both alleles, and an A164G mutation leading to a Q16R amino acid change in one allele. KO38 had a deletion of C168 (ΔC168) leading to early termination in both alleles and a C142T mutation leading to a P9S amino acid change in one allele.
XPA patients often succumb to metastatic UV radiation-induced skin tumors. This can be delayed by protection of individuals from sun exposure. However, many XPA patients with loss of XPA function show accelerated neurological deterioration over decades, initially characterized as de Sanctis-Cacchione syndrome [14]. Retention of a small amount of XPA function results in much milder symptoms [15]. A likely explanation for the origin of the neurological impairment is the accumulation of genomic DNA lesions over decades in non-replicating neural cells that can only be repaired by NER [16]. Prime candidates are the cyclopurines induced by reactive oxygen species, which are repaired by NER and cannot be removed by other repair systems [17]. XPA-defective mice, with a much shorter lifespan than humans, do not appear to exhibit these neurological deficits [18].
Nevertheless, a few observations have suggested that XPA may have additional functions beyond NER. Chromatin immunoprecipitation of NER proteins (including XPA) indicates association with the promoters of several tested genes [19]. The basal transcription initiation factor TFIIH is expected to be present at promoters. XPA may be detectable by this method because it binds to TFIIH and associated proteins, or because it binds directly to DNA. One study indicates that XPA depletion affects retinoic acid (RA)-activated transcription of the genes RARB, PPAR, and HMGCS2 [19]. Moreover, a comparison of XPA-proficient and deficient cells by microarray analysis found changes in gene expression associated with XPA status, and indicated that XPA-deficient cells in culture display mitochondrial dysfunction, with defects in pathways of mitophagy [20]. Mitochondrial dysfunction would be expected to impact neural health.
To comprehensively investigate the extent of a possible transcriptional defect in XPA-deficient cells, we examined genome wide expression of transcribed genes by high throughput RNA-Seq analysis.
2. Results
2.1. Validation of pairs of XPA-deficient and proficient cell lines
The purpose of this study was to determine the extent to which XPA expression status influences overall gene expression in cultured cells. We considered it important to use independent, genetically matched pairs of cell lines where one cell line was completely XPA-deficient, and the other was XPA-proficient. Four pairs of cell lines were investigated. Fig. 1B indicates the sites of causative XPA mutations in each of the cell lines. Two pairs include widely used and characterized XPA-deficient cell lines derived from human skin fibroblasts of individuals with xeroderma pigmentosum group A, XP2OS and XP12RO. These were compared to the same cell lines complemented with a plasmid expressing XPA cDNA. In both cases, there is ample evidence that XPA expression fully corrects the UVC radiation sensitivity and NER defect in these fibroblasts [21,22]. As another comparison pair of cell lines, two CRISPR-Cas9 mediated XPA-disrupted HeLa S3 cell lines were generated (Fig. 1C). We reasoned that if any XPA-associated gene expression changes were found in common across several cell lines, they would represent the most biologically significant consequences of XPA expression. The common genetic origin of the paired cell lines was confirmed by short tandem repeat analysis (Table S1).
In three of the XPA mutant cell lines, XPA protein was undetectable by immunofluorescent staining of cells (Fig. 2A) or by immunoblotting of cell extracts (Fig. 2B, C). This is consistent with the known mRNA destabilizing mutations in XP2OS [23] and XP12RO [22] (Fig. 1B). The HeLa KO142 cells encoded an XPA protein with a deletion of six amino acids (residues 9–14) near the N-terminus (Fig. 1B and 1C). This, perhaps surprisingly, destabilizes XPA expression, reducing it to ∼10% of the level in the HeLa cells (Fig. 2B and C). The GTX103168 antibody recognizes the globular core domain of XPA and also detected a reduced level of XPA in HeLa KO142 cells (Fig. 2B). The HeLa KO38 cells had a frameshift mutation causing early termination and complete loss of XPA protein. UV irradiation of paired cell lines confirmed the NER deficiency in the XPA mutant cell lines showing that there is a reduced level of NER in KO142 (Fig. 2D). This is consistent with previous data showing that XPA levels are rate-limiting for NER when reduced sufficiently [24,25]. HeLa KO38 cell extracts were completely deficient in NER and could be complemented by XPA protein (Fig. 2E).
Fig. 2. XPA expression, UVC sensitivity and NER complementation.
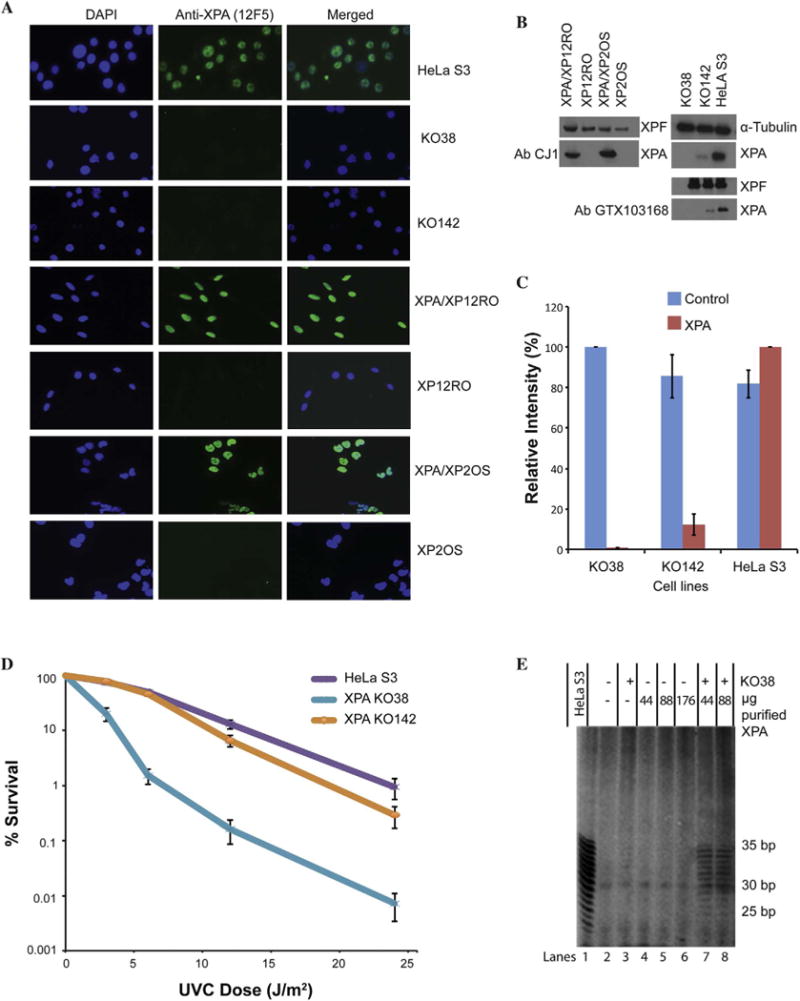
A. Immunofluorescence images using anti-XPA antibody (12F5) and DAPI showing the presence of XPA in all XPA-proficient cell lines and little or no XPA in the deficient cell lines. DAPI (blue) staining of nuclei included for reference. B. Immunoblot of the cell lines with anti-XPA antibodies (CJ1 and GTX103168), as well as alpha-tubulin or XPF antibodies as loading controls. C. Quantification of the immunoblots for the HeLa S3 cell lines shown in (B). The blue bars represent the alpha-tubulin control. The red bars represent the anti-XPA antibody CJ1. D. UVC clonogenic survival for XPA-disrupted cell lines KO38 and KO142 compared to wild type HeLa S3. Each point on the survival curves represents the mean of 3 independent experiments. KO38 is more sensitive to UVC compared to HeLa S3. KO142 has only slightly more sensitivity compared to HeLa S3. E. NER complementation assay. KO38 whole cell extracts complemented with purified XPA protein to produce incision products. 50 ng 1,3-intrastrand d(GpTpG)-cisplatin substrate was incubated with 45 μg whole cell extract protein. Various amounts of purified XPA protein were added to KO38 extracts. NER activity is detected with 44 and 88 μg of purified XPA combined with KO38 extracts. Incision products were observed as a characteristic ladder of bands where complementation was successful (lanes 7 and 8), like the incision products with NER proficient HeLa S3 extract (lane 1).
2.2. XPA is localized in the nucleus of cells and does not require UV irradiation for import
To have a direct influence on transcription, XPA would have to be present in the cell nucleus, where transcription takes place. Although XPA is localized in the nucleus under standard fixation conditions (Fig. 2A), we were concerned about reports that XPA is normally resident in the cytoplasm, and is only recruited to nuclei following UV radiation exposure [26,27]. We note that in those studies, cells were first briefly exposed to wash buffers containing Triton X-100 detergent or the milder fixation agent methanol, or with 0.05% NP-40 detergent. As shown in Fig. 3A (top row), XPA is entirely resident in the nucleus as visualized after paraformaldehyde fixation. However, because XPA is a relatively small protein (31 kDa), it easily leaks out of nuclei into the cytoplasm after only a few seconds’ exposure to a buffer containing 0.05% NP-40 (Fig. 3A, third row).
Fig. 3. XPA is a nuclear protein resistant to leakage from the nucleus during DNA repair.
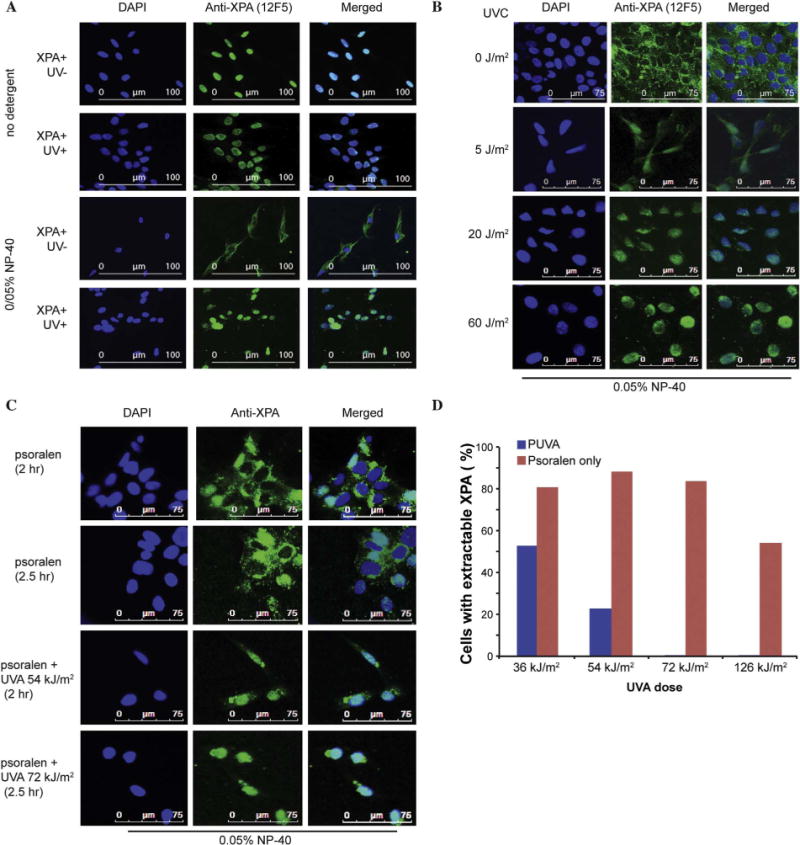
A. Immunofluorescence (IF) staining with 12F5 antibody (green) and DAPI (blue). Cells in the top two panels were stained without exposure to buffer containing detergent. This shows that XPA is localized in the nuclei of complemented XPA/XP12RO cells, regardless of exposure to UVC. The lower two panels show that brief exposure to a buffer containing 0.05% NP-40 causes leakage of XPA into the cytoplasm in untreated cells but not in cells exposed to 20 J/m2 UVC.
B. In XPA/XP12RO cells, the leakage of XPA into the cytoplasm decreases with increasing doses of UVC (0 J/m2–60 J/m2). C. XPA/XP12RO cells were exposed to psoralen with or without UVA radiation (PUVA). The 2 h sample received 54 kJ/m2 (first dose 18 kJ/m2, second dose 36 kJ/m2) and the 2.5 h sample received 72 kJ/m2 (first dose 18 kJ/m2, second dose 54 kJ/m2). All cells were exposed briefly to a buffer containing 0.05% NP-40 before fixation for IF. XPA leaked to the cytoplasm in cells exposed to psoralen alone, but not in PUVA treated cells. D. Quantification showing the% of XPA/XP12RO cells with cytoplasmic XPA following PUVA treatment with increasing total doses of UVA. All cells were exposed briefly to a buffer containing 0.05% NP-40 before fixation for IF. The red bar shows XPA leakage in cells exposed only to psoralen, and the blue bar shows a reduction in leakage following DNA damage induction with increasing UVA doses.
Cells exposed to sufficient DNA damage retained XPA in the nucleus for at least 30 min even after a brief wash in buffer containing NP-40 detergent. A UVC radiation dose of 20 J/m2 was sufficient to retain all detectable XPA in the nucleus (Fig. 3A, fourth row and Fig. 3B). This result is consistent with previous observations that XPA remains chromatin-bound after UV irradiation, but is extractable from chromatin in nondamaged cells [28]. Similarly, we found that photoactivated psoralen lesions could also immobilize XPA in the nucleus, even in cells washed with buffer containing NP-40 (Fig. 3C). Consequently, previous observations suggesting nuclear import of XPA following UV radiation [27] appear to have been misinterpreted. Instead, XPA is always present in nuclei. Fixation in the presence of detergent facilitates nuclear membrane permeabilization, and XPA leaks out readily; DNA damage in the nucleus temporarily restricts such leakage while XPA is engaged in repair. Other examples of misinterpretation of the subcellular localization of proteins arising from the presence of detergent have been noted previously [29,30].
2.3. Influence of XPA status on overall gene transcription
To analyze gene expression, RNA was extracted from a culture of 106 actively growing cells of each pair, and used for next-generation RNA-Seq. Three replicate cultures were grown independently for each cell line, and RNA was extracted from cell pellets for analysis. With an overall mapping rate of 87–96%, about 14,000 genes were analyzed for each pair of cell lines. With a False Discovery Rate (FDR) less than or equal to 0.05, a very high proportion of genes (∼9000 for each pair) were initially identified as differentially expressed between paired XPA-proficient and deficient cell lines (Table 1). However, the expression patterns of these genes for the four pairs of cell lines were very distinct from one another. The ratio of gene expression was calculated for XPA+/XPA− for each cell pair; positive log 2 values were termed “high” and negative log 2 values were termed “low”. We determined the genes that were uniformly “high” or “low” for all four cell pairs. This narrowed the set to 325 genes with expression that is consistently influenced by XPA status at an FDR < 0.05 (Table 1, Fig. 4).
Table 1.
Summary of genes analyzed by high-throughput RNA sequencing (RNA-Seq) and significant XPA-related differences.
| Cell lines (XPA− vs. XPA+) | Genes Analyzed | FDR 0.05 (High + Low) | FC ≥ 1.5 (High + Low) |
|---|---|---|---|
| XP2OS vs. XPA/XP2OS | 14117 | 9526 | 1721 + 2206 |
| XP12RO vs. XPA/XP12RO | 13669 | 10283 | 2750 + 2625 |
| KO38 vs. HeLa S3 | 14564 | 9520 | 1769 + 1701 |
| KO142 vs. HeLa S3 | 13824 | 8364 | 1642 + 1422 |
| Common genes | 12022 | 176 + 149 | 11 + 16 |
The first column shows the number of genes analyzable by RNA-Seq for each XPA-proficient/deficient cell pair. The second column shows the number of genes with differential expression at a False Discovery Rate (FDR) of 0.05. The ratio of gene expression was calculated for XPA+/XPA− for each cell pair; positive log 2 values are termed “high” and negative log 2 values are termed “low”. The third column shows for each cell pair the number of “high” or “low” genes with fold change (FC) of 1.5 or more.
Fig. 4. XPA dependent changes in gene expression pattern.
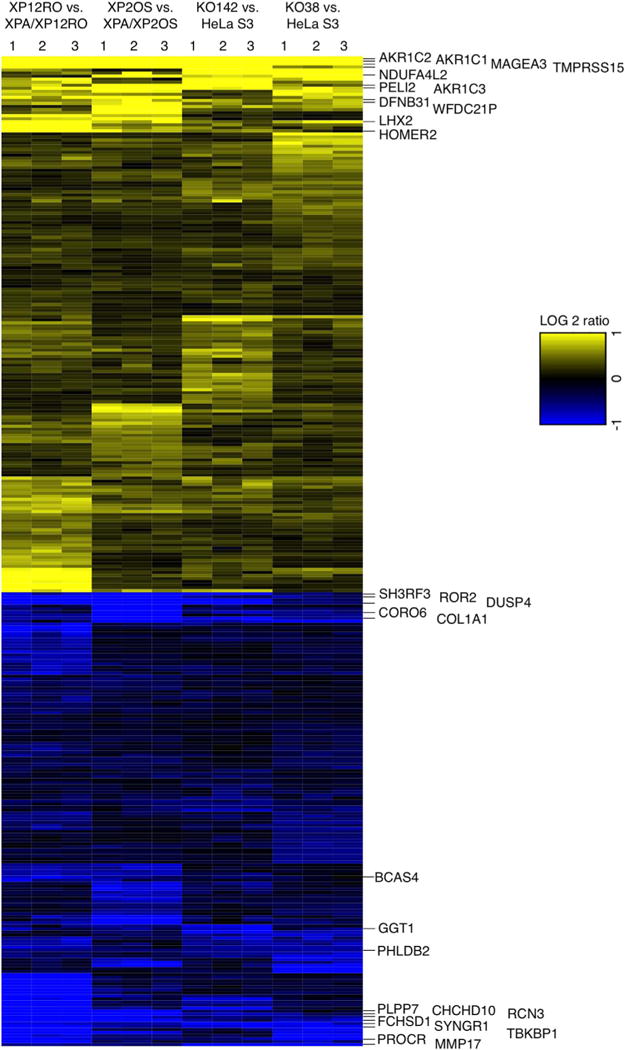
Heatmap of the 325 genes (Table 1) having the same expression pattern, either high (yellow) or low (blue), comparing all four pairs of cell lines, at a cut off level of FDR 0.05. Differential expression of mRNA was obtained from high throughput RNA-Seq data. Three biological replicate experiments were analyzed for each cell line pair and are numbered on the top of the heatmap. The ratio of gene expression was calculated for XPA+/XPA− for each cell pair; positive log 2 values are termed “high” and negative log 2 values are termed “low”. The most differentially over- or under-expressed genes summarized in Table 3 are shown at the right.
2.4. XPA status and expression of genes affecting mitochondria and mitophagy
Because XPA status has been reported to affect mitochondrial function and mitophagy [20,31], we examined gene expression in relevant pathways. To narrow down the analysis, we focused on genes with a fold change (FC) of 1.5 (Table 1) or 2 (Table 2) in each pair of cell lines. Genes listed on the GO consortium for ‘mitophagy’ or ‘mitochondria’ were overlapped with FC2 genes from our experiment. Consistent with the previous reports, mitochondria or mitophagy related GO terms were significantly enriched in the FC2 genes for all four of our datasets (Table 2). This confirms and extends the evidence for an influence of XPA status on gene expression affecting mitochondrial maintenance and regulation of mitophagy.
Table 2.
Gene Ontology (GO) terms for genes for ‘Mitophagy’ or ‘Mitochondria’ overlapping with genes changed by 2 fold or more (FC2) genes in an XPA+ to XP− comparison.
| GO terms for FC2 genes overlapping with GO genes for ‘Mitochondria’ (A) or ‘Mitophagy’ (B) | Fold enrichment
|
|||||||
|---|---|---|---|---|---|---|---|---|
| KO142 vs. HeLa S3
|
KO38 vs. HeLa S3
|
XP12RO vs. XPA/XP12RO
|
XP2OS vs. XPA/XP2OS
|
|||||
| A | B | A | B | A | B | A | B | |
| mitophagy in response to mitochondrial depolarization (GO:0098779) | 27 | > 100 | 21 | > 100 | 25 | > 100 | 28 | > 100 |
| mitochondrion disassembly (GO:0061726) | 22 | > 100 | 17 | > 100 | 20 | 99 | 25 | > 100 |
| organelle disassembly (GO:1903008) | 19 | > 100 | 15 | 95 | 18 | 88 | 22 | 95 |
| mitochondrion organization (GO:0007005) | 14 | 33 | 11 | 29 | 11 | 27 | 15 | 28 |
| macroautophagy (GO:0016236) | 16 | 70 | 11 | 69 | 12 | 60 | 15 | 65 |
| autophagy (GO:0006914) | 12 | 53 | 8.5 | 48 | 9.0 | 42 | 12 | 45 |
| regulation of establishment of protein localization to mitochondrion (GO:1903747) | 24 | – | 29 | – | 22 | – | 26 | – |
| regulation of mitochondrion organization (GO:0010821) | 19 | – | 20 | – | 22 | – | 24 | – |
| xenophagy (GO:0098792) | – | > 100 | – | 69 | – | 86 | – | 93 |
The first column consists of non-redundant GO database terms related to ‘Mitochondria’ or ‘Mitophagy’. In the table, ‘A’ represents ‘Mitochondria’ and ‘B’ represents ‘Mitophagy’, with the corresponding columns showing the fold enrichment of FC2 genes for each cell line pair for the GO terms listed in the first column.
2.5. Classification of the most differentially expressed genes common among all cell pairs
To determine which genes have expression most reproducibly affected by XPA status, we began with the group with at least a 1.5 fold change (FC1.5) in each cell pair. The overlaps in the gene list between the four sets were determined. This narrowed the set to only 27 genes that were differentially expressed at FC1.5 and have a uniform trend of high or low expression among all four pairs of cell lines (Fig. 4, Fig. 5A). Among the most differentially expressed genes were AKR1C1, AKR1C2, and AKR1C3. These genes are adjacent on human chromosome 10p15 (Fig. 5B) and encode members of the aldo/keto reductase superfamily, discussed further below. Another gene more highly expressed in XPA+ cells was NDUFA4L2, which encodes a subunit of an NADH dehydrogenase localized in the mitochondria and important for ATP generation.
Fig. 5. XPA-dependent gene expression including the steroid regulators AKR1C1 and AKR1C2.
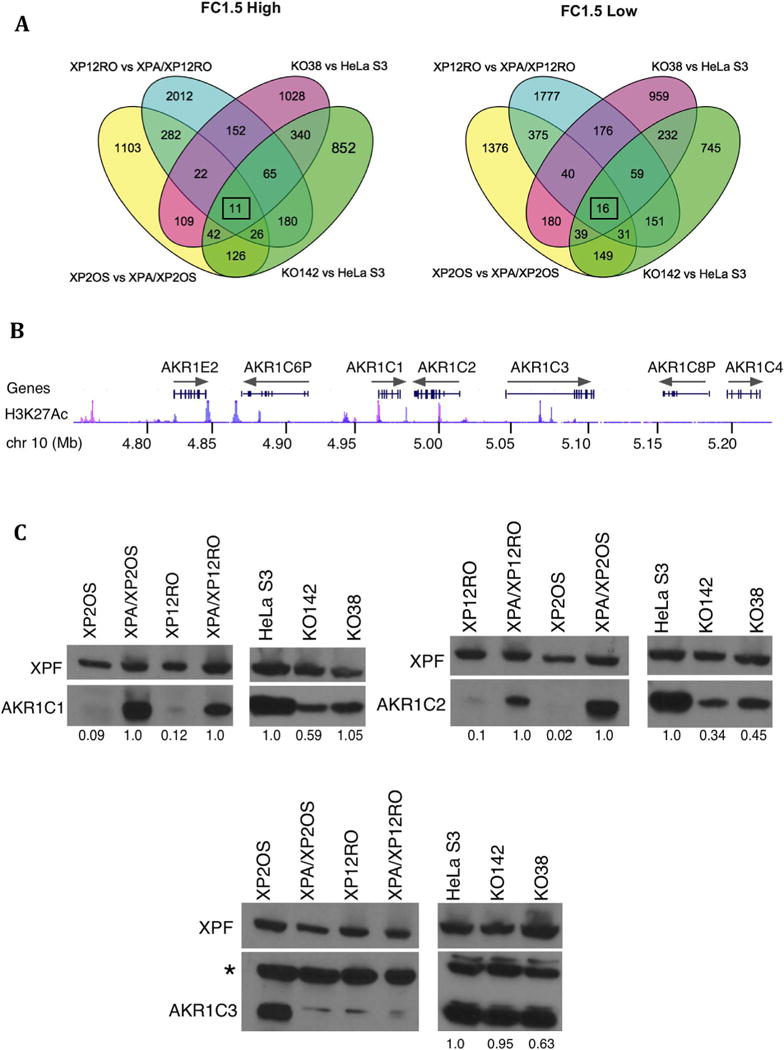
A. Venn diagrams for high expressed genes (left) and low expressed genes (right) in all four pairs of cell lines at a cut off level of FC1.5 or more. Overlaps are shown, with each XPA- and XPA+ cell pair represented in a different color. Only 11 “high” and 16 “low” genes (boxed numbers) overlap between all four comparisons (cf. Table 1). B. Orientation of part of the AKR1C gene cluster on human chromosome 10 p15.1, with nucleotide positions shown, from the GRCh38/hg38 assembly. The H3K27Acetylation track (a histone modification often found near active genes) is shown for the K562 (blue) and NHEK (pink) cell lines, to emphasize that gene activation is different in between cell lines. Direction of transcription is shown by gray arrows.
C. Immunoblot for products of three of the most differentially expressed genes (AKR1C1, AKR1C2 and AKR1C3) in lysates from XPA-proficient and deficient cell lines. An XPF immunoblot serves as a loading reference. AKR1C1 and AKR1C2 protein levels were lower in XPA-deficient cells compared to proficient cells, while AKR1C3 protein level levels do not obviously correlate with expression. The * denotes a nonspecific band detected by the AKR1C3 antibody. The blots were scanned and the AKR1C protein level determined, relative to the respective XPF loading control. The numbers under the blots show this AKR1C/XPF ratio, normalized to 1 for the XPA+ cell line in each pair.
To determine whether the transcriptional differences were reflected at the protein level, we used immunoblotting to analyze AKR1C proteins in the cell pairs. AKR1C2 protein levels were clearly reduced in all of the XPA-cells compared to XPA+ cells, and AKR1C1 protein was lower in three XPA-cell lines of the pairs (Fig. 5C). AKR1C3 protein levels did not correspond well to transcript levels (Fig. 5C).
2.6. More commonalities within fibroblast and HeLa cell pairs
We also analyzed the data to compare the two skin fibroblast pairs to one another (XP12RO and XP2OS) and the two sets of data derived from HeLa cells (KO38 and KO142). Within these pairs, there were many more genes in common that were differentially expressed in an XPA-dependent manner (Table 4). For FC1.5 genes, 803 (341 high + 462 low) genes in fibroblast cell lines and 804 (458 high + 346 low) genes in HeLa knockout cell lines had a similar expression pattern (Table 4), in contrast to the only 27 genes common between all four cell lines at this expression level (Table 1, Fig. 5A).
Table 4.
Number of commonly expressed genes when fibroblasts and HeLa cells are considered separately.
| KO38 vs. HeLa S3 only | KO142 vs. HeLa S3 only | common in HeLa pairs | XP2OS vs. XPA/XP2OS only | XP12RO vs. XPA/XP12RO only | common in fibroblast pairs | |
|---|---|---|---|---|---|---|
| High | 1311 | 1184 | 458 | 1380 | 2409 | 341 |
| Low | 1355 | 1076 | 346 | 1744 | 2163 | 462 |
| Total | 2666 | 2260 | 804 | 3124 | 4572 | 803 |
The ratio of gene expression was calculated for XPA+/XPA− for each cell pair. Positive log 2 values are termed “high” and negative log 2 values are termed “low”. The table shows genes with a fold change of FC1.5 or more. The numbers of commonly expressed genes in the HeLa pairs (804) and the fibroblast cell line pairs (803) are considerably greater than the 27 genes common among all four cell lines listed in Table 2.
2.7. Retinoic acid transactivation affects XPA-dependent transcription related functions
Retinoic acid (RA) transactivation of RARB gene transcription has been suggested to depend on NER integrity [19]. To assess the influence of XPA status, we treated cell pairs with all-trans retinoic acid (RA) or a DMSO control, and assessed the response of the cell lines to retinoic acid treatment. All cell lines, both XPA-proficient and deficient, responded to RA as shown by an increase in the mRNA level of RARB, a direct target gene of RA (Fig. 6A). The transcriptional response of RARB was lower in the HeLa cell lines than in the skin fibroblast lines. RNA-sequencing data from cells treated with retinoic acid or DMSO for 7 h were analyzed. Ingenuity Pathway Analysis was used to compare genes with higher expression (FDR ≤ 0.05) in RA-treated cells compared to controls. For some biological functions, the RA response appeared to be XPA-dependent (Fig. 6B). Thus, XPA proficiency might influence retinoic acid transactivation. However, we found no common gene expression pattern among all four pairs of cell lines. There were 18 common changed genes, comparing RA-treated HeLa S3 with KO38 or KO142 (FC1.5). No genes common to the two fibroblast cell pairs were found in similar conditions. Each cell line responded to retinoic acid treatment in a different manner. Although specific gene expression patterns were different in all four sets of cell lines, common biological functions were represented in each pair of cell lines (Supplemental Fig. 1), with transcription-related functions having the highest dependence on XPA status (Fig. 6B).
Fig. 6. XPA-dependent transcription related functions after retinoic acid transactivation.
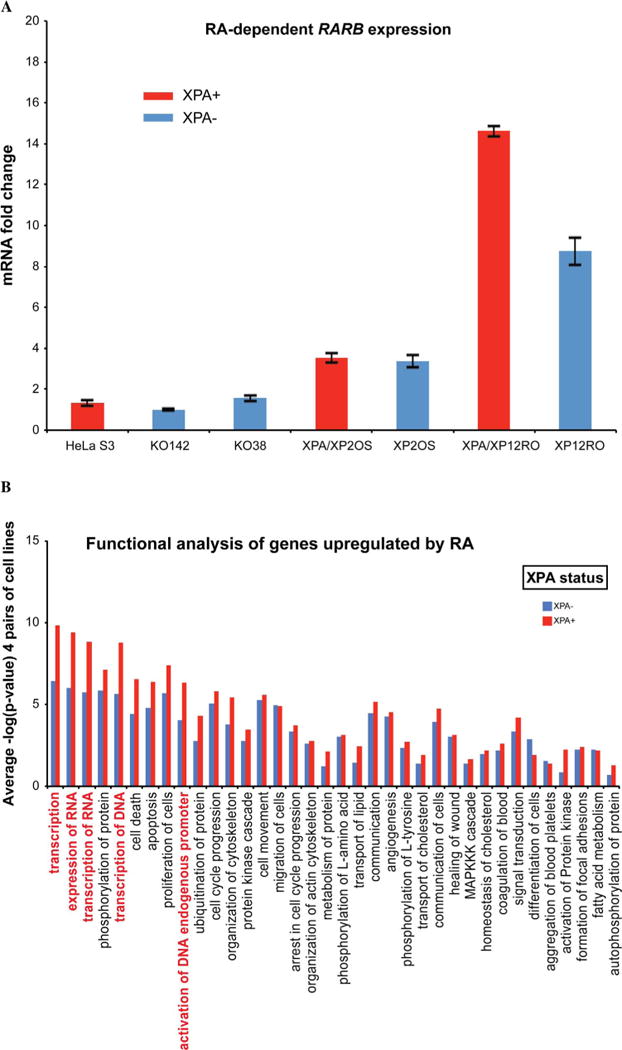
A. Retinoic acid-dependence of RARB expression. qPCR results for XPA-proficient and deficient cell lines showing responses to RA treatment at 7 h. RARB gene expression was analyzed with GAPDH as control. The expression of RARB mRNA in RA treated cells was normalized to the DMSO-only controls. The black bars indicate the range of data in 2 experiments. B. Pathways for genes upregulated by RA treatment. IPA analysis assigned pathways to genes with higher expression (FDR ≤ 0.05) in RA treated cells compared to DMSO controls. The scores are presented as negative log values of p-values. XPA+ cells (red) have higher significant differences than XPA− cells (blue), for some pathways shown on the x-axis. Transcription-related functions are highlighted in red. Mean values of comparisons between the four pairs of cell lines are shown here, and results for individual cell lines are given in Supplemental Fig. 1.
3. Discussion
3.1. Expression of a subset of genes is influenced by XPA status in cell lines
The major purpose of this study was to determine the extent to which XPA status may influence transcriptional activity in human cell lines. We found that XPA does not globally influence gene transcription. However, expression of a relatively small subset of genes is consistently affected by XPA status. These include genes that are necessary for steroid metabolism and for optimal mitochondrial function and integrity.
A plausible explanation for a positive effect of XPA on gene expression is that XPA sometimes participates as part of a transcription factor complex, for this subset of genes. For example, by binding to some DNA promoter regions in concert with the transcription initiation factor TFIIH and other NER proteins [19], it may modulate TFIIH activity for a subset of genes. XPA is a DNA binding protein that might also serve as a component of an enhancer or mediator complex for some genes.
Another, not necessarily exclusive possibility is that the NER defect caused by XPA deficiency gives rise to constitutive DNA damage stress that interferes with transcription of some genes. Persistent sites of DNA damage on templates will interfere with transcription [32]. For individual genes that are more susceptible to DNA damage, this could account for the higher transcription of some genes in XPA-proficient cells. We culture cells in low ambient light or with yellow fluorescent lights, and so UV radiation is unlikely to be a significant source of stress. In contrast, reactive oxygen species are a ubiquitous and constant source of damage. For example, a type of oxidative DNA lesion, the 8,5′-cyclopurine-2′-deoxynucleosides (cyclopurines), is repaired by NER but not by base excision repair [33,34]. These lesions are known to interfere with transcription. Oxidative damage, particularly cyclopurine lesions, has been suggested as an explanation for the neurodegeneration in XP patients, which includes progressive cerebral atrophy, intellectual defects, hearing impairment, abnormal speech, neuropathy, and muscular discoordination of movement [14,17,34–37]. Most neurons are non-replicating and metabolically very active, depending on mitochondria to remain functional. In a study of XP patients from 1971 to 2009, 6 of 10 individuals with XP-A had neurological degeneration, and this was the cause of the death of some XP-A patients [35].
A further consideration is that transcription and NER are competing processes. For example, transcription initiation efficiencies in yeast are reduced when NER is ongoing [38]. In mammalian cells, there is lower NER activity at promoters when core transcription factors are bound to them [39,40]. After UV radiation damage to DNA, NER proteins are delayed in recruitment to promoter sites by several hours [19]. This suggests that NER components are prioritized to repair damaged DNA first before resuming any activity in transcription.
It is significant that the XPA-dependent transcriptional profiles in KO142 and KO48 cells are similar, even though KO142 cells retain about 10% of the XPA protein level found in HeLa cells. The amount of XPA present in the KO142 line is enough to confer near-normal UV sensitivity, consistent with previous findings that XPA is in excess in cells for NER activity [24]. Because complete knockout of XPA or knockdown to 10% has a similar effect on transcription, this suggests that at least part of the influence of XPA on transcription is not directly related to the NER function.
3.2. Defective mitophagy associated with XPA deficiency and relation to neurological deficits
It has been observed that some of the symptoms of xeroderma pigmentosum group A have commonalities with mitochondrial disorders [20]. XPA-defective human cells showed abnormalities in mitochondrial functions including mitochondrial membrane potential, membrane organization, and oxidoreductase activity. XPA was reported to play a role in the regulation of mitochondrial autophagy and mitochondrial functions through NAD+/SIRT1 and PARP [20]. In the present study, we found that genes 1.5 fold or more changed in XPA+ compared to XPA-were indeed significantly represented for many mitochondrial and mitophagy-related GO terms (Table 4).
A direct connection between an increased load of DNA damage and mitochondrial dysfunction is suggested by several observations. In mice, a telomerase defect eventually gives rise to exposed telomeres. This genomic stress is clearly associated with mitochondrial dysfunction, and it is possible that exposed DNA ends induce a signal for disruption of key mitochondrial gene expression [41–44]. Another example is provided by an siRNA screen for factors that reduce sensitivity to a mitochondria-targeted DNA damaging agent [31]. Many DNA repair factors, including XPA, were detected in this screen.
3.3. Relevance of the most significant XPA-regulated genes to steroid and sexual degeneration issues in xeroderma pigmentosum group A
The genes that are uniformly altered with the highest magnitude and significance are AKR1C1 and AKR1C2. These genes are adjacent in the human genome and are transcribed towards one another (Fig. 5B). Such convergent transcription can be toxic, but can be alleviated in some cases by XPA-dependent repair [45,46]. This gene arrangement may help explain the XPA-dependence of transcription in this region. The XPA-dependent “high” genes TMPRSS15, NDUFA4L2 and HOMER2 are also convergently transcribed with adjacent genes. However, some genes with lower expression in XPA proficient cells also have this convergent transcription arrangement.
Both AKR1C gene products are critical for steroid metabolism and some bile metabolism [47–49] and are associated with obesity, sex reversal, hyperphasia and developmental delays [50,51]. AKR1C1 converts progesterone to its inactive form, 20-alpha-dihydroxyprogesterone. AKR1C2 catalyzes the inactivation of the most potent androgen, 5-alpha-dihydrotestosterone, to 5-alpha-androstane-3-alpha,17-beta-diol (3-alpha-diol). Therefore, an imbalance of steroid hormones may be expected in XPA-defective cells. A previous study used microarray analysis to study gene expression changes in several XPA-defective cell lines [20]. We analyzed the most XPA-dependent genes found in those experiments (NCBI GEO dataset GSE55486) and found that AKR1C2 is the only gene that coincides with our list of most changed genes by RNA-Seq analysis. We show here that immortalized XPA-deficient cells have exceptionally low levels of AKR1C2 protein. Degenerating seminiferous tubules and no spermatozoa were detected in 24-month-old Xpa−/− mice [52]. Secondary sexual development is delayed in some XP patients [53]. Consequently, our finding of XPA-dependent expression of the steroid regulator AKR1C2 may be relevant to the sterility and sexual developmental issues observed in mammals.
A few studies have examined the transcriptome in XPA-defective organisms. A whole organism under continuing environmental and aging influences is much more highly challenged than a cell line in culture. In the nematode C. elegans, the xpa-1 mutant is shorter-lived than wild type by several days, and shows signs of increased oxidative stress [54]. A microarray based transcript analysis found changes in 2815 genes at FC ≥ 1.8, comparing wild type to xpa-1. This substantial transcriptional shift did not overlap directly with changes in the proteome [55], which reflected regulation of oxidative stress responses. A lower steady state level of cyclopurines was found in the C. elegans xpa-1 mutant than in the wild-type strain, so this lesion does not appear to be responsible for the increased oxidative stress in the nematode [55].
Microarrays were also used to compare transcriptional expression of total RNA from the livers of mice with defects in Xpa or a double defect in Xpa and Csb [56]. This again represents a biologically very different situation from human cell lines, as the mice are under continuing developmental pressure, showing an upregulation of the IGF1 axis and oxidative stress responses. In single-strain comparisons, 1865 genes were transcriptionally different between wild type and Xpa Csb mice at FC > 1.2, and many fewer at FC > 1.5. This is consistent with our conclusion that despite the high level of stress, only a minority of the transcriptome is altered. Interestingly, one of the significantly upregulated pathways in Xpa Csb was steroid metabolism and biosynthesis. The Akr1c1, c2 and c3 genes were not found as differentially expressed genes in Xpa or Xpa Csb mouse liver [56]. However, expression of one paralog, Akr1c20 was significantly reduced (FC 1.54) in the Xpa Csb mice. This gene is part of a cluster of Akr1c genes on mouse chromosome 13. Overlaps between this mouse data and our short list of consistently altered transcripts in human cell lines (Table 3) include only HOMER2 and PROCR. Expression of the reticulobalbin 3 gene RCN3 was higher in XPA-defective human cells; expression of the related RCN2 mouse gene was correspondingly higher in XPA defective mouse liver. Syngr1 gene expression was higher in XPA-defective human cells; expression of the paralogous mouse Syngr2 was correspondingly higher in XPA-defective mouse liver.
Table 3.
Genes that are the most differentially expressed (FC > 1.5) in common in all four pairs of cell lines.
| Biological Functions | Genes FC > 1.5 | Gene Name | XP12RO vs. XPA/XP12RO | XP2OS vs. XPA/XP2OS | KO38 vs. HeLa S3 | KO142 vs. HeLa S3 |
|---|---|---|---|---|---|---|
| Steroid hormone biosynthesis | AKR1C1 | Aldo-Keto Reductase Family 1, Member C1 | 4.0 | 5.6 | 2.9 | 2.9 |
| Steroid hormone biosynthesis | AKR1C2 | Aldo-Keto Reductase Family 1, Member C2 | 4.4 | 4.3 | 4.1 | 2.9 |
| Proteolysis | TMPRSS15 | Transmembrane Protease, Serine 15 | 3.6 | 3.9 | 1.2 | 10 |
| Unknown | MAGEA3 | Melanoma-Associated Antigen 3 | 4.1 | 3.4 | 1.9 | 5.7 |
| Steroid hormone biosynthesis | AKR1C3 | Aldo-Keto Reductase Family 1, Member C3 | 2.2 | 2.8 | 0.9 | 1.1 |
| Mitochondrial ATP generation | NDUFA4L2 | NADH Dehydrogenase (Ubiquinone) 1 Alpha Subcomplex, 4-Like 2 | 0.7 | 1.4 | 2.9 | 2.8 |
| Immune response | PELI2 | Pellino E3 Ubiquitin Protein Ligase Family Member2 | 0.7 | 1.4 | 0.6 | 2.5 |
| Not clear | WFDC21P | WAP four-disulfide core domain 21, pseudogene [but locus expresses spliced transcripts] | 0.9 | 1.3 | 0.8 | 0.6 |
| GPCR signaling pathway | HOMER2 | Homer Scaffolding Protein 2 | 2.6 | 1.0 | 0.9 | 3.5 |
| Neural crest development | LHX2 | LIM Homeobox 2 | 3.2 | 0.9 | 1.0 | 0.5 |
| Sensory perception of light and sound | DFNB31 | Deafness, Autosomal Recessive 31 | 0.6 | 0.9 | 0.8 | 0.7 |
| GPCR signaling pathway | ROR2 | Receptor Tyrosine Kinase Like Orphan Receptor 2 | −4.4 | −11 | −2.7 | −1.1 |
| Not clear | SH3RF3 | SH3 Domain Containing Ring Finger 3 | −1.2 | −6.4 | −0.6 | −2.7 |
| Mitochondrial organization | CHCHD10 | Coiled-Coil-Helix-Coiled-Coil-Helix Domain Containing 10 | −3.3 | −5.5 | −0.5 | −0.8 |
| Actin binding | CORO6 | Coronin 6 | −0.5 | −5.0 | −0.8 | −0.8 |
| Ca ion binding | RCN3 | Reticulocalbin 3 | −1.7 | −4.4 | −0.6 | −0.5 |
| Negative regulation of myotube differentiation | PLPP7 | Phospholipid Phosphatase 7 (inactive) | −8.1 | −4.1 | −1.6 | −1.9 |
| MAPK regulation | DUSP4 | Dual Specificity Phosphatase 4 | −2.2 | −2.7 | −0.5 | −2.1 |
| Not clear | FCHSD1 | FCH And Double SH3 Domains 1 | −1.3 | −1.8 | −0.8 | −0.5 |
| Collagen | COL1A1 | Collagen Type I Alpha 1 Chain | −0.7 | −1.3 | −0.6 | −1.0 |
| Glutathione metabolism | GGT1 | Gamma-Glutamyltransferase 1 | −0.9 | −0.7 | −0.5 | −1.0 |
| Immune system process | TBKBP1 | TBK1 Binding Protein 1 | −1.9 | −0.7 | −1.1 | −1.1 |
| Not clear | SYNGR1 | Synaptogyrin 1 | −0.9 | −0.7 | −1.0 | −1.3 |
| Proteolysis | MMP17 | Matrix Metallopeptidase 17 | −0.8 | −0.6 | −3.3 | −1.2 |
| Intracellular Transport | BCAS4 | Breast Carcinoma Amplified Sequence 4 | −1.0 | −0.6 | −1.5 | −1.1 |
| Blood coagulation | PROCR | Protein C Receptor | −1.1 | −0.5 | −1.8 | −0.6 |
| Cytoskeleton organization | PHLDB2 | Pleckstrin Homology Like Domain Family B Member 2 | −0.5 | −0.5 | −0.7 | −0.6 |
Gene symbols and names are as assigned by the HUGO Gene Nomenclature Committee (genenames.org). The main biological function was derived from GO annotations and manual curation including cross-checking with PathCards (http://pathcards.genecards.org). The four columns at right give log 2 ratios of the differential expression in four pairs of cell lines. A positive log 2 ratio shows higher expression in XPA+ compared to XPA−, and a negative log 2 ratio shows lower expression.
3.4. Perspectives
Despite these correlations, there are many unanswered questions concerning the mechanism of how XPA affects cellular function. One puzzle is that although mitochondria-related functions are affected, the specific gene transcripts that are changed are different between cell line pairs. We observe here that independent XPA defective mutants, even from the same source, show wide variations in the selection of genes that are transcriptionally altered. The present study shows how important it is to not only have biological replicates for RNA-Seq, but also to investigate cell lines of different genetic background in order to detect significant consequences of a single gene disruption.
4. Experimental procedures
4.1. Cell lines
Four human cell lines deficient in XPA and their complementary XPA-proficient cell lines were used. SV40-immortalized human fibroblast cells from patients deficient in XPA (XP12RO and XP2OS) and XPA-proficient (XPA/XP12RO and XPA/XP2OS) cell lines complemented with XPA cDNA [21,22] were kindly provided by Dr. Masafumi Saijo, Osaka University. The mutations in XP12RO and XP2OS are shown in Fig. 1B. Only 10% of our initial culture of XPA/XPA12RO cells expressed XPA as shown by immunofluorescent staining with 12F5 anti-XPA antibody. To obtain a culture with 100% XPA expression, we reisolated from a single colony and used this “clone 2” of XPA/XP12RO as the XPA-proficient cell line matched with XP12RO. The HeLa S3 cells in these experiments were from banked laboratory stocks of the same cells used for the fractionation and reconstitution of mammalian NER [57]. HeLa S3 cell lines KO142 and KO38 were derived by CRISPR-Cas9 targeting technology by the Gene Editing and Cellular Model Core Facility at the University of Texas MD Anderson Cancer Center (Fig. 1B). XP12RO and XP2OS and the complemented XPA cell lines were grown in DMEM-high glucose (Sigma D5796). HeLa S3, KO142 and KO38 were grown in RPMI-1640 25 mM HEPES (Sigma R4130) medium. All cells were grown in medium containing 10% FBS, 1% penicillin-streptomycin solution at 37 °C and 5% CO2.
4.2. Immunoblotting
Anti-XPA antibodies were rabbit polyclonal CJ1 [58], mouse monoclonal 12F5 [24], and rabbit polyclonal GTX103168 (Cat. No. GTX103168, GeneTex). Other antibodies used were mouse monoclonal to AKR1C1 (Cat. No. GTX53684, GeneTex), rabbit polyclonal to AKR1C2 (Cat. No. 13035, Cell Signalling Technologies Inc.), rabbit polyclonal to AKR1C3 (Cat. No. ABS1172, EMD Millipore), and mouse or rabbit α-tubulin (Sigma Aldrich). Mouse monoclonal 1E4 to XPF was a gift of Dr. Laura Niedernhofer. Cell lysates were prepared by pipetting 106–107 cells in 0.2 ml of lysis buffer (500 mM KCl, 20 mM Tris–HCl [pH 8.0], 5 mM MgCl2, 10% glycerol, 1 mM PMSF, 0.1% Tween 20, 10 mM β-mercaptoethanol) in a 1.5 ml microfuge tube. The suspension was sonicated using a microtip (three times for 15 s with 15 s intervals, amplitude of 1, 137 J) on ice (Misonix, Inc. part No. S-4000). Lysates were then mixed with SDS loading buffer for 3 min at 95 °C before loading onto a 4–20% gradient polyacrylamide gel. Proteins were transferred to a polyvinylidene fluoride membrane for 1 h using ice-temperature Tris-glycine-20% methanol buffer. The blots were blocked with 10% non-fat dairy milk for 2 h at room temperature and washed 3 × 10 min with TBS-T (Tris buffered saline-Tween 20). Membranes were incubated with primary antibodies diluted as follows (CJ1; 1:10,000, 12F5; 1:5000, GTX103168; 1:1000, XPF 1E4; 1:2000, AKR1C1; 1:1000, AKR1C2; 1:500, AKR1C3; 1:1000, α-tubulin; 1:8000). Membranes were incubated overnight at 4 °C, or for 20 min at room temperature for tubulin detection. Membranes were washed 3 × 10 min and incubated with mouse or rabbit IgG secondary antibodies (1:10,000) at room temperature for 2 h, washed and treated with Pierce Western blot signal enhancer (Thermo Scientific Inc.) and then exposed to x-ray film.
4.3. UVC clonogenic survival assay
The UVC clonogenic survival experiments were performed using two 15 W germicidal lamps emitting predominantly 254 nm light adjusted to a fluence of 0.3 J/m2/s. Cells were plated onto 10 cm dishes at densities of 1–5 × 10⁵ cells per plate and incubated overnight prior to treatment. Cells were removed from plate perimeters with sterile cotton swabs. Growth media was aspirated, and the attached cells were rinsed once with sterile phosphate buffered saline without magnesium or calcium (PBS). Plates containing 4 ml of PBS were irradiated with the lids removed. Following exposure, the PBS was aspirated and cells were detached by trypsin-EDTA treatment and passed through a 23 gauge needle. Diluted cells were counted using a Beckman Coulter Particle Counter Z1 Single, and plated, in triplicate, at the appropriate cell number for each dose into 10 cm plates containing 10 ml of growth medium. Following incubation for 12–17 days, colonies were rinsed with PBS, fixed with methanol, stained with 0.5% crystal violet in ethanol, and counted manually. The original plating counts and colony counts were used to determine the plating efficiency and the% survival.
4.4. NER extracts and assays
Whole cell extracts of HeLa S3 and KO38 were prepared as described [59,60]. A protein concentration of at least 20 mg/ml was obtained in each extract. A single 1,3 (dGpTpG) cisplatin intrastrand adduct substrate was prepared and tested in an NER dual incision assay using the end-labelling method [61,62]. Reaction mixtures (10 μl) consisted of 50 ng of Pt-GTG or control substrate, 40–45 μg of whole cell extract protein in buffer with final concentrations of 45 mM HEPES-KOH (pH 7.8), 70 mM KCl, 7.5 mM MgCl2, 0.9 mM DTT, 0.4 mM EDTA, 2 mM ATP, 2.5 μg of creatine phosphokinase, 3.4% glycerol and 18 μg of bovine serum albumin. An oligonucleotide containing a G-overhang was used to detect the dual incision product by incorporating [α- 32P] dCTP. NER dual incision complementation was done using purified XPA protein. For XPA purification, cell growth, induction, and lysis was performed as described [63]. The sonicate was centrifuged at 15,000 × g for 30 min at 4 °C. Supernatant was incubated with HIS Select Nickel Affinity Gel (Sigma) for 3 h at 4 °C. The protein was eluted by gravity flow with buffer containing 50 mM sodium phosphate (pH 8.0), 100 mM KCl, 0.01% Nonidet P-40, 1 mM EDTA, 10% glycerol, and 250 mM imidazole. Fractions were pooled and the buffer was exchanged to 25 mM HEPES-KOH (pH 7.8), 10% glycerol, 0.4 mM EDTA, 1 mM DTT, and 0.5 M KCl.
4.5. Immunofluorescence assay
Cells were washed 3 × 3 min with PBS followed by fixation with 4% formaldehyde for 10 min at room temperature. The fixed cells were washed twice with 0.2% Triton X-100 in PBS at room temperature for 3 min followed by two 3 min washes with PBS. The cells were blocked with 5% goat serum for 30 min at room temperature followed by two 3 min washes with PBS. Incubation with 1:10,000 dilution of anti-XPA antibody 12F5 was done overnight at 4 °C on a shaker. Following a wash with PBS, the sample was incubated with a 1: 2000 dilution of goat anti-mouse Alexa-Fluor 488 labelled IgG at room temperature for 2 h, washed with PBS, incubated 10 min with 1 mg/ml DAPI (4′,6-diamidino-2-phenylindole, dihydrochloride from Molecular Probes) and washed with PBS. The slides were then covered with mounting media and coverslips.
4.6. XPA-extraction immunofluorescence assay
In experiments to observe extraction of XPA from the nucleus into the cytoplasm, cells were exposed to PBS containing 0.05% NP-40 detergent for 10 s twice, and then fixed immediately with 4% formaldehyde for 10 min at room temperature. Fixed cells were washed twice for 3 min with PBS, blocked with 5% goat serum and staining for immunofluorescence was performed as above.
4.7. UVC exposure
40,000 cells were plated on 18 mm × 18 mm coverslips in 35 mm diameter Petri dishes. After overnight incubation, the plates were washed twice with PBS for 3 min and irradiated with 5, 20 or 60 J/m2 UVC. Medium was returned and the cells were incubated for 1 h at 37 °C. Immunofluorescent analysis was carried out as described above.
4.8. Psoralen + UVA (PUVA) treatment
40,000 cells were plated on 18 mm x 18 mm coverslips in 35 mm diameter petri dishes at 37 °C overnight. Cells were washed twice with Hank’s balanced salt solution (HBSS) and incubated with 10 μM of 4′-hydroxymethyl-4,5′-8-trimethylpsoralen (HMT) in HBSS or HBSS alone for 30 min at 37 °C. The cells were exposed to UVA under a bank of 12 Cosmolux UVA 15 W lamps (#10005) with a Mylar filter to exclude UVB and UVC wavelengths below 315 nm. After 30 min exposure at 10 J/m2/s (18 kJ/m2), cells were washed with HBSS to remove free psoralen. A second UVA dose of 18 kJ/m2, 36 kJ/m2, 54 kJ/m2 or 108 kJ/m2 was delivered to the cells on plates on ice. Media was returned to the plates and incubation continued for 1 h at 37 °C. Cells treated with only psoralen were kept in HBSS for the same time as for the corresponding PUVA treatments. Immunofluorescent analysis was performed as described above using the fluorochromes A4 FLUO (blue) for DAPI and GFP FLUO (green) for XPA. The images were acquired with a Leica DMI6000 microscope and objective lenses (magnification/numerical aperture) HCPLAN APO 10X/0.03 or HCX PL FLUOTAR 20X/0.07. Dry imaging medium was used at room temperature. A Leica DFC360 FX camera captured the images using Leica Application Suite X software (version 1.1.0.12420).
4.9. Transactivation
106 fibroblast cells were cultured 24–48 h or until 90% confluent. 2 × 10⁶ cells were treated for different periods with 10 μM all-trans retinoic acid (RA) in dimethyl sulfoxide (DMSO) or with DMSO only as a control. HeLa S3 cells were cultured in RPMI (Thermo Fisher Scientific) media with 10% FBS and 1% penicillin/streptomycin solution. HeLa cell lines were treated with 1 μM RA in DMSO or with DMSO only as a control. The final concentration of DMSO was 0.01% in the cell culture. The fibroblast cells were harvested with a cell scraper, centrifuged (1500 rpm = 485 × g, for 5 min at 4 °C) and washed once with PBS. The pellets were quick-frozen and stored at −80 °C. RNA was extracted from pellets using a QIAGEN RNA isolation kit for a qPCR assay. The qPCR data were analyzed for fold-change in mRNA level of the human RARB gene at different time points. A time point of maximum response was determined to prepare the samples for RNA-Seq analysis. Cells were treated as described above and cell pellets prepared for sequencing.
4.10. Sequencing
Libraries were prepared using the Illumina TruSeq stranded mRNA kit according to the manufacturer’s protocol, except that eight PCR amplification cycles were used. The libraries were loaded on cBot (Illumina, San Diego, CA) at a final concentration of 10 pM to perform cluster generation, followed by 2 × 76 bp paired end sequencing on a HiSeq 2500 instrument (Illumina). A total of 48 libraries (three biological replicates per condition) were sequenced in 6 lanes, generating 16–41 million pairs of reads per sample. Each pair of reads represents a cDNA fragment from the library.
4.11. Mapping
The reads were mapped to the human genome (hg19) using TopHat (version 2.0.10) [64]. The overall mapping rate was 87–96%. Differential Expression: The number of fragments in each gene from the RefSeq database [65] (downloaded from UCSC Genome Browser on July 17, 2015) was enumerated using htseq-count from the HTSeq software package (version 0.6.0) [66]. Genes with less than 10 fragments in all samples were removed before differential expression analysis. The differential expression between conditions was statistically assessed using the R/Bioconductor package DESeq (version 1.18.0, for DMSO vs. DMSO) [67] and edgeR (version 3.8.6, for DMSO vs. RA) [68]. Differential expression of genes with FDR (false discovery rate) ≤ 0.05 was considered significant and a fold change (FC) ≥ 1.5 was used for more rigorous analyses. RNA-Seq data has been deposited to GEO (Gene Expression Omnibus, https://www.ncbi.nlm.nih.gov/geo/), under accession number GSE100855.
4.12. Analysis of sequencing data
Data were curated to identify significant (FDR 0.05) differentially expressed genes in XPA-proficient cells compared to their respective deficient cells, as well as genes with fold change levels > 1.5. Gene set enrichment analysis, pathway analysis and statistical gene enrichment analysis were performed using Gene Ontology (GO) Consortium [69], Gene Set Enrichment Analysis (GSEA) [70] and QIAGEN’s IPA programs using GO as the data source. The term “human” was selected for gene analysis. GO assignments are subject to some uncertainty because only limited inferential data is available for some genes. To help avoid random matches, the Bonferroni correction was used while using GO Consortium software for testing pathway and gene enrichment or over-representation.
Supplementary Material
Acknowledgments
We thank Masafumi Saijo (Osaka University) for cell lines and Laura Niedernhofer (Scripps Florida) for XPF antibody. We appreciate helpful discussions with Renier Velez-Cruz, Yunxiang Mu, Kei-ichi Takata, Junya Tomida, Shelley Reh and Mark Bedford (MD Anderson Cancer Center), and with Walter Chazin and Norie Sugitani (Vanderbilt University). These studies were funded by National Institutes of Health P01 grants CA097175 and CA193124 (RDW) and the Grady F. Saunders Ph.D. Distinguished Research Professorship (RDW). We acknowledge support from the Science Park Next Generation Sequencing core (CPRIT grant numbers RP120348 and RP170002). The Characterized Cell Line Core Facility and Gene Editing and Cellular Model Core Facility were supported by MD Anderson Cancer Center Support Grant P30-CA016672 from the NIH.
Appendix A. Supplementary data
Supplementary data associated with this article can be found, in the online version, at http://dx.doi.org/10.1016/j.dnarep.2017.06.028.
Footnotes
Conflict of interest
The authors declare that they have no conflict of interest with the content of this article.
Author contributions
MM conducted most of the experiments and designed the study together with RDW. MM, KL, YL, and RDW analyzed the data. MM and RDW wrote the paper with assistance from the other authors. MGL cultured and maintained cell lines and also performed the survival assay shown in Fig. 2D. KSB purified XPA protein and developed reagents for the NER assay shown in Fig. 2E. YL and KHL processed the RNA-Seq data for differential expression and helped with gene and biological pathway analysis. All authors reviewed the results, edited, and approved the final version of the manuscript.
References
- 1.Gillet LC, Scharer OD. Molecular mechanisms of mammalian global genome nucleotide excision repair. Chem Rev. 2006;106:253–276. doi: 10.1021/cr040483f. [DOI] [PubMed] [Google Scholar]
- 2.Sugasawa K. Regulation of damage recognition in mammalian global genomic nucleotide excision repair. Mutat Res. 2010;685:29–37. doi: 10.1016/j.mrfmmm.2009.08.004. [DOI] [PubMed] [Google Scholar]
- 3.Araújo SJ, Tirode F, Coin F, Pospiech H, Syväoja JE, Stucki M, Hübscher U, Egly JM, Wood RD. Nucleotide excision repair of DNA with recombinant human proteins: definition of the minimal set of factors, active forms of TFIIH and modulation by CAK. Genes Dev. 2000;14:349–359. doi: 10.1101/gad.14.3.349. [DOI] [PMC free article] [PubMed] [Google Scholar]
- 4.Sarker AH, Tsutakawa SE, Kostek S, Ng C, Shin DS, Peris M, Campeau E, Tainer JA, Nogales E, Cooper PK. Recognition of RNA polymerase II and transcription bubbles by XPG, CSB, and TFIIH: insights for transcription-coupled repair and Cockayne syndrome. Mol Cell. 2005;20:187–198. doi: 10.1016/j.molcel.2005.09.022. [DOI] [PubMed] [Google Scholar]
- 5.Ito S, Kuraoka I, Chymkowitch P, Compe E, Takedachi A, Ishigami C, Coin F, Egly JM, Tanaka K. XPG stabilizes TFIIH, allowing transactivation of nuclear receptors: implications for Cockayne syndrome in XP-G/CS patients. Mol Cell. 2007;26:231–243. doi: 10.1016/j.molcel.2007.03.013. [DOI] [PubMed] [Google Scholar]
- 6.Le May N, Fradin D, Iltis I, Bougneres P, Egly JM. Endonucleases trigger chromatin looping and DNA demethylation for accurate expression of activated genes. Mol Cell. 2012;47:622–632. doi: 10.1016/j.molcel.2012.05.050. [DOI] [PubMed] [Google Scholar]
- 7.Manandhar M, Boulware KS, Wood RD. The ERCC1 and ERCC4 (XPF) genes and gene products. Gene. 2015;569:153–161. doi: 10.1016/j.gene.2015.06.026. [DOI] [PMC free article] [PubMed] [Google Scholar]
- 8.Cattoglio C, Zhang ET, Grubisic I, Chiba K, Fong YW, Tjian R. Functional and mechanistic studies of XPC DNA-repair complex as transcriptional coactivator in embryonic stem cells. Proc Natl Acad Sci U S A. 2015;112:E2317–2326. doi: 10.1073/pnas.1505569112. [DOI] [PMC free article] [PubMed] [Google Scholar]
- 9.Sugitani N, Sivley RM, Perry KE, Capra JA, Chazin WJ. X.P.A. A key scaffold for human nucleotide excision repair. DNA Repair (Amst) 2016;44:123–135. doi: 10.1016/j.dnarep.2016.05.018. [DOI] [PMC free article] [PubMed] [Google Scholar]
- 10.Fadda E. Role of the XPA protein in the NER pathway: a perspective on the function of structural disorder in macromolecular assembly. Comput Struct Biotechnol J. 2016;14:78–85. doi: 10.1016/j.csbj.2015.11.007. [DOI] [PMC free article] [PubMed] [Google Scholar]
- 11.You JS, Wang M, Lee SH. Biochemical analysis of the damage recognition process in nucleotide excision repair. J Biol Chem. 2003;278:7476–7485. doi: 10.1074/jbc.M210603200. [DOI] [PubMed] [Google Scholar]
- 12.van Kreijl CF, McAnulty PA, Beems RB, Vynckier A, van Steeg H, Fransson-Steen R, Alden CL, Forster R, van der Laan JW, Vandenberghe J. Xpa and Xpa/p53+/− knockout mice: overview of available data. Toxicol Pathol. 2001;29(Suppl):117–127. doi: 10.1080/0192623013014189281. [DOI] [PubMed] [Google Scholar]
- 13.Yoshino M, Nakatsu Y, te Riele H, Hirota S, Kitamura Y, Tanaka K. Additive roles of XPA and MSH2 genes in UVB-induced skin tumorigenesis in mice. DNA Repair (Amst) 2002;1:935–940. doi: 10.1016/S1568-7864(02)00144-1. [DOI] [PubMed] [Google Scholar]
- 14.DiGiovanna JJ, Kraemer KH. Shining a light on xeroderma pigmentosum. J Invest Dermatol. 2012;132:785–796. doi: 10.1038/jid.2011.426. [DOI] [PMC free article] [PubMed] [Google Scholar]
- 15.Lehmann AR, McGibbon D, Stefanini M. Xeroderma pigmentosum. Orphanet J Rare Dis. 2011;6:70. doi: 10.1186/1750-1172-6-70. [DOI] [PMC free article] [PubMed] [Google Scholar]
- 16.Robbins JH, Brumback RA, Polinsky RJ, Wirtschafter JD, Tarone RE, Scudiero DA, Otsuka F. Hypersensitivity to DNA-damaging agents in abiotrophies: a new explanation for degeneration of neurons, photoreceptors, and muscle in Alzheimer. Parkinson and Huntington diseases, retinitis pigmentosa, and Duchenne muscular dystrophy. Basic Life Sci. 1985;35:315–344. doi: 10.1007/978-1-4899-2218-2_20. [DOI] [PubMed] [Google Scholar]
- 17.Brooks PJ. The 8 5′-cyclopurine-2′-deoxynucleosides: candidate neurodegenerative DNA lesions in xeroderma pigmentosum, and unique probes of transcription and nucleotide excision repair. DNA Repair (Amst) 2008;7:1168–1179. doi: 10.1016/j.dnarep.2008.03.016. [DOI] [PMC free article] [PubMed] [Google Scholar]
- 18.Wijnhoven SW, Hoogervorst EM, de Waard H, van der Horst GT, van Steeg H. Tissue specific mutagenic and carcinogenic responses in NER defective mouse models. Mutat Res. 2007;614:77–94. doi: 10.1016/j.mrfmmm.2005.12.018. [DOI] [PubMed] [Google Scholar]
- 19.Le May N, Mota-Fernandes D, Velez-Cruz R, Iltis I, Biard D, Egly JM. NER factors are recruited to active promoters and facilitate chromatin modification for transcription in the absence of exogenous genotoxic attack. Mol Cell. 2010;38:54–66. doi: 10.1016/j.molcel.2010.03.004. [DOI] [PubMed] [Google Scholar]
- 20.Fang EF, Scheibye-Knudsen M, Brace LE, Kassahun H, SenGupta T, Nilsen H, Mitchell JR, Croteau DL, Bohr VA. Defective mitophagy in XPA via PARP-1 hyperactivation and NAD(+)/SIRT1 reduction. Cell. 2014;157:882–896. doi: 10.1016/j.cell.2014.03.026. [DOI] [PMC free article] [PubMed] [Google Scholar]
- 21.Levy DD, Saijo M, Tanaka K, Kraemer KH. Expression of a transfected DNA repair gene (XPA) in xeroderma pigmentosum group A cells restores normal DNA repair and mutagenesis of UV-treated plasmids. Carcinogenesis. 1995;16:1557–1563. doi: 10.1093/carcin/16.7.1557. [DOI] [PubMed] [Google Scholar]
- 22.Satokata I, Tanaka K, Miura N, Narita M, Mimaki T, Satoh Y, Kondo S, Okada Y. Three nonsense mutations responsible for group-A xeroderma-pigmen-tosum. Mutat Res. 1992;273:193–202. doi: 10.1016/0921-8777(92)90080-m. [DOI] [PubMed] [Google Scholar]
- 23.Satokata I, Tanaka K, Miura N, Miyamoto I, Satoh Y, Kondo S, Okada Y. Characterization of a splicing mutation in group A xeroderma pigmentosum. Proc Natl Acad Sci U S A. 1990;87:9908–9912. doi: 10.1073/pnas.87.24.9908. [DOI] [PMC free article] [PubMed] [Google Scholar]
- 24.Köberle B, Roginskaya V, Wood RD. XPA protein as a limiting factor for nucleotide excision repair and UV sensitivity in human cells. DNA Repair. 2006;5:641–648. doi: 10.1016/j.dnarep.2005.12.001. [DOI] [PubMed] [Google Scholar]
- 25.Kang TH, Reardon JT, Sancar A. Regulation of nucleotide excision repair activity by transcriptional and post-transcriptional control of the XPA protein. Nucleic Acids Res. 2011;39:3176–3187. doi: 10.1093/nar/gkq1318. [DOI] [PMC free article] [PubMed] [Google Scholar]
- 26.Wu X, Shell SM, Liu Y, Zou Y. ATR-dependent checkpoint modulates XPA nuclear import in response to UV irradiation. Oncogene. 2007;26:757–764. doi: 10.1038/sj.onc.1209828. [DOI] [PMC free article] [PubMed] [Google Scholar]
- 27.Li Z, Musich PR, Cartwright BM, Wang H, Zou Y. UV-induced nuclear import of XPA is mediated by importin-alpha4 in an ATR-dependent manner. PLoS One. 2013;8:e68297. doi: 10.1371/journal.pone.0068297. [DOI] [PMC free article] [PubMed] [Google Scholar]
- 28.Svetlova M, Nikiforov A, Solovjeva L, Pleskach N, Tomilin N, Hanawalt PC. Reduced extractability of the XPA DNA repair protein in ultraviolet light-irradiated mammalian cells. FEBS Lett. 1999;463:49–52. doi: 10.1016/s0014-5793(99)01592-6. [DOI] [PubMed] [Google Scholar]
- 29.Jamur MC, Oliver C. Permeabilization of cell membranes. Methods Mol Biol. 2010;588:63–66. doi: 10.1007/978-1-59745-324-0_9. [DOI] [PubMed] [Google Scholar]
- 30.Feeney RJ, Zieve GW. Nuclear exchange of the U1 and U2 snRNP-specific proteins. J Cell Biol. 1990;110:871–881. doi: 10.1083/jcb.110.4.871. [DOI] [PMC free article] [PubMed] [Google Scholar]
- 31.Wisnovsky S, Jean SR, Kelley SO. Mitochondrial DNA repair and replication proteins revealed by targeted chemical probes. Nat Chem Biol. 2016;12:567–573. doi: 10.1038/nchembio.2102. [DOI] [PubMed] [Google Scholar]
- 32.McKay BC, Cabrita MA. Arresting transcription and sentencing the cell: the consequences of blocked transcription. Mech Ageing Dev. 2013;134:243–252. doi: 10.1016/j.mad.2013.03.003. [DOI] [PubMed] [Google Scholar]
- 33.Brooks PJ, Wise DS, Berry DA, Kosmoski JV, Smerdon MJ, Somers RL, Mackie H, Spoonde AY, Ackerman EJ, Coleman K, Tarone RE, Robbins JH. The oxidative DNA lesion 8 5′-(S)-cyclo-2′-deoxyadenosine is repaired by the nucleotide excision repair pathway and blocks gene expression in mammalian cells. J Biol Chem. 2000;275:22355–22362. doi: 10.1074/jbc.M002259200. [DOI] [PubMed] [Google Scholar]
- 34.Kuraoka I, Bender C, Romieu A, Cadet J, Wood RD, Lindahl T. Removal of oxygen free-radical induced 5’, 8 purine cyclodeoxynucleosides from DNA by the nucleotide excision repair pathway in human cells. Proc Natl Acad Sci USA. 2000;97:3832–3837. doi: 10.1073/pnas.070471597. [DOI] [PMC free article] [PubMed] [Google Scholar]
- 35.Bradford PT, Goldstein AM, Tamura D, Khan SG, Ueda T, Boyle J, Oh KS, Imoto K, Inui H, Moriwaki S, Emmert S, Pike KM, Raziuddin A, Plona TM, DiGiovanna JJ, Tucker MA, Kraemer KH. Cancer and neurologic degeneration in xeroderma pigmentosum: long term follow-up characterises the role of DNA repair. J Med Genet. 2011;48:168–176. doi: 10.1136/jmg.2010.083022. [DOI] [PMC free article] [PubMed] [Google Scholar]
- 36.Mimaki T, Itoh N, Abe J, Tagawa T, Sato K, Yabuuchi H, Takebe H. Neurological manifestations in xeroderma pigmentosum. Ann Neurol. 1986;20:70–75. doi: 10.1002/ana.410200112. [DOI] [PubMed] [Google Scholar]
- 37.Rapin I, Lindenbaum Y, Dickson DW, Kraemer KH, Robbins JH. Cockayne syndrome and xeroderma pigmentosum: DNA repair disorders with overlaps and paradoxes. Neurology. 2000;55:1442–1449. doi: 10.1212/wnl.55.10.1442. [DOI] [PMC free article] [PubMed] [Google Scholar]
- 38.You ZY, Feaver WJ, Friedberg EC. Yeast RNA-polymerase-II transcription in vitro is inhibited in the presence of nucleotide excision-repair—complementation of inhibition by holo-TFIIH and requirement for Rad26. Mol Cell Biol. 1998;18:2668–2676. doi: 10.1128/mcb.18.5.2668. [DOI] [PMC free article] [PubMed] [Google Scholar]
- 39.Sabarinathan R, Mularoni L, Deu-Pons J, Gonzalez-Perez A, Lopez-Bigas N. Nucleotide excision repair is impaired by binding of transcription factors to DNA. Nature. 2016;532:264–267. doi: 10.1038/nature17661. [DOI] [PubMed] [Google Scholar]
- 40.Perera D, Poulos RC, Shah A, Beck D, Pimanda JE, Wong JW. Differential DNA repair underlies mutation hotspots at active promoters in cancer genomes. Nature. 2016;532:259–263. doi: 10.1038/nature17437. [DOI] [PubMed] [Google Scholar]
- 41.Sahin E, Colla S, Liesa M, Moslehi J, Muller FL, Guo M, Cooper M, Kotton D, Fabian AJ, Walkey C, Maser RS, Tonon G, Foerster F, Xiong R, Wang YA, Shukla SA, Jaskelioff M, Martin ES, Heffernan TP, Protopopov A, Ivanova E, Mahoney JE, Kost-Alimova M, Perry SR, Bronson R, Liao R, Mulligan R, Shirihai OS, Chin L, DePinho RA. Telomere dysfunction induces metabolic and mitochondrial compromise. Nature. 2011;470:359–365. doi: 10.1038/nature09787. [DOI] [PMC free article] [PubMed] [Google Scholar]
- 42.Passos JF, Nelson G, Wang C, Richter T, Simillion C, Proctor CJ, Miwa S, Olijslagers S, Hallinan J, Wipat A, Saretzki G, Rudolph KL, Kirkwood TB, von Zglinicki T. Feedback between p21 and reactive oxygen production is necessary for cell senescence. Mol Syst Biol. 2010;6:347. doi: 10.1038/msb.2010.5. [DOI] [PMC free article] [PubMed] [Google Scholar]
- 43.Haendeler J, Drose S, Buchner N, Jakob S, Altschmied J, Goy C, Spyridopoulos I, Zeiher AM, Brandt U, Dimmeler S. Mitochondrial telomerase reverse transcriptase binds to and protects mitochondrial DNA and function from damage. Arterioscler Thromb Vasc Biol. 2009;29:929–935. doi: 10.1161/ATVBAHA.109.185546. [DOI] [PubMed] [Google Scholar]
- 44.Kovalenko OA, Caron MJ, Ulema P, Medrano C, Thomas AP, Kimura M, Bonini MG, Herbig U, Santos JH. A mutant telomerase defective in nuclear-cytoplasmic shuttling fails to immortalize cells and is associated with mitochondrial dysfunction. Aging Cell. 2010;9:203–219. doi: 10.1111/j.1474-9726.2010.00551.x. [DOI] [PubMed] [Google Scholar]
- 45.Lin Y, Wilson JH. Nucleotide excision repair, mismatch repair, and R-loops modulate convergent transcription-induced cell death and repeat instability. PLoS One. 2012;7:e46807. doi: 10.1371/journal.pone.0046807. [DOI] [PMC free article] [PubMed] [Google Scholar]
- 46.Sollier J, Stork CT, Garcia-Rubio ML, Paulsen RD, Aguilera A, Cimprich KA. Transcription-coupled nucleotide excision repair factors promote R-loop-induced genome instability. Mol Cell. 2014;56:777–785. doi: 10.1016/j.molcel.2014.10.020. [DOI] [PMC free article] [PubMed] [Google Scholar]
- 47.Jin Y, Mesaros AC, Blair IA, Penning TM. Stereospecific reduction of 5beta-reduced steroids by human ketosteroid reductases of the AKR (aldo-keto reductase) superfamily: role of AKR1C1-AKR1C4 in the metabolism of testosterone and progesterone via the 5beta-reductase pathway. Biochem J. 2011;437:53–61. doi: 10.1042/BJ20101804. [DOI] [PMC free article] [PubMed] [Google Scholar]
- 48.Veilleux A, Cote JA, Blouin K, Nadeau M, Pelletier M, Marceau P, Laberge PY, Luu-The V, Tchernof A. Glucocorticoid-induced androgen inactivation by aldo-keto reductase 1C2 promotes adipogenesis in human preadipocytes. Am J Physiol Endocrinol Metab. 2012;302:E941–949. doi: 10.1152/ajpendo.00069.2011. [DOI] [PubMed] [Google Scholar]
- 49.Stolz A, Hammond L, Lou H, Takikawa H, Ronk M, Shively JE. cDNA cloning and expression of the human hepatic bile acid-binding protein. A member of the monomeric reductase gene family. J Biol Chem. 1993;268:10448–10457. [PubMed] [Google Scholar]
- 50.Ashburner M, Ball CA, Blake JA, Botstein D, Butler H, Cherry JM, Davis AP, Dolinski K, Dwight SS, Eppig JT, Harris MA, Hill DP, Issel-Tarver L, Kasarskis A, Lewis S, Matese JC, Richardson JE, Ringwald M, Rubin GM, Sherlock G. Gene ontology: tool for the unification of biology. The Gene Ontology Consortium. Nat Genet. 2000;25:25–29. doi: 10.1038/75556. [DOI] [PMC free article] [PubMed] [Google Scholar]
- 51.Rappaport N, Twik M, Nativ N, Stelzer G, Bahir I, Stein TI, Safran M, Lancet D. MalaCards: A comprehensive automatically-mined database of human diseases. Curr Protoc Bioinformatics. 2014;47(1.24):1–19. doi: 10.1002/0471250953.bi0124s47. [DOI] [PubMed] [Google Scholar]
- 52.Nakane H, Hirota S, Brooks PJ, Nakabeppu Y, Nakatsu Y, Nishimune Y, Iino A, Tanaka K. Impaired spermatogenesis and elevated spontaneous tumorigenesis in xeroderma pigmentosum group A gene (Xpa)-deficient mice. DNA Repair (Amst) 2008;7:1938–1950. doi: 10.1016/j.dnarep.2008.08.003. [DOI] [PMC free article] [PubMed] [Google Scholar]
- 53.Kraemer KH, Lee MM, Scotto J. Xeroderma pigmentosum. Cutaneous, ocular, and neurologic abnormalities in 830 published cases. Arch Dermatol. 1987;123:241–250. doi: 10.1001/archderm.123.2.241. [DOI] [PubMed] [Google Scholar]
- 54.Fensgard O, Kassahun H, Bombik I, Rognes T, Lindvall JM, Nilsen H. A two-tiered compensatory response to loss of DNA repair modulates aging and stress response pathways. Aging (Albany, NY) 2010;2:133–159. doi: 10.18632/aging.100127. [DOI] [PMC free article] [PubMed] [Google Scholar]
- 55.Arczewska KD, Tomazella GG, Lindvall JM, Kassahun H, Maglioni S, Torgovnick A, Henriksson J, Matilainen O, Marquis BJ, Nelson BC, Jaruga P, Babaie E, Holmberg CI, Burglin TR, Ventura N, Thiede B, Nilsen H. Active transcriptomic and proteomic reprogramming in the C. elegans nucleotide excision repair mutant xpa-1. Nucleic Acids Res. 2013;41:5368–5381. doi: 10.1093/nar/gkt225. [DOI] [PMC free article] [PubMed] [Google Scholar]
- 56.van der Pluijm I, Garinis GA, Brandt RM, Gorgels TG, Wijnhoven SW, Diderich KE, de Wit J, Mitchell JR, van Oostrom C, Beems R, Niedernhofer LJ, Velasco S, Friedberg EC, Tanaka K, van Steeg H, Hoeijmakers JH, van der Horst GT. Impaired genome maintenance suppresses the growth hormone–insulin-like growth factor 1 axis in mice with Cockayne syndrome. PLoS Biol. 2007;5:e2. doi: 10.1371/journal.pbio.0050002. [DOI] [PMC free article] [PubMed] [Google Scholar]
- 57.Aboussekhra A, Biggerstaff M, Shivji MK, Vilpo JA, Moncollin V, Podust VN, Protić M, Hübscher U, Egly JM, Wood RD. Mammalian DNA nucleotide excision repair reconstituted with purified protein components. Cell. 1995;80:859–868. doi: 10.1016/0092-8674(95)90289-9. [DOI] [PubMed] [Google Scholar]
- 58.Welsh C, Day R, McGurk C, Masters JR, Wood RD, Koberle B. Reduced levels of XPA, ERCC1 and XPF DNA repair proteins in testis tumor cell lines. Int J Cancer. 2004;110:352–361. doi: 10.1002/ijc.20134. [DOI] [PubMed] [Google Scholar]
- 59.Biggerstaff M, Wood RD. Repair synthesis assay for nucleotide excision repair activity using fractionated cell extracts and UV-damaged plasmid DNA. Methods Mol Biol. 2006;314:417–434. doi: 10.1385/1-59259-973-7:417. [DOI] [PubMed] [Google Scholar]
- 60.Wood RD, Biggerstaff M, Shivji MKK. Detection and measurement of nucleotide excision repair synthesis by mammalian cell extracts in vitro. Methods. 1995;7:163–175. [Google Scholar]
- 61.Moggs JG, Yarema KJ, Essigmann JM, Wood RD. Analysis of incision sites produced by human cell extracts and purified proteins during nucleotide excision repair of a 1,3-intrastrand d(GpTpG)-cisplatin adduct. J Biol Chem. 1996;271:7177–7186. doi: 10.1074/jbc.271.12.7177. [DOI] [PubMed] [Google Scholar]
- 62.Shivji MK, Moggs JG, Kuraoka I, Wood RD. Assaying for the dual incisions of nucleotide excision repair using DNA with a lesion at a specific site. Methods Mol Biol. 2006;314:435–456. doi: 10.1385/1-59259-973-7:435. [DOI] [PubMed] [Google Scholar]
- 63.Jones CJ, Wood RD. Preferential binding of the xeroderma pigmentosum group A complementing protein to damaged DNA. Biochemistry. 1993;32:12096–12104. doi: 10.1021/bi00096a021. [DOI] [PubMed] [Google Scholar]
- 64.Kim D, Pertea G, Trapnell C, Pimentel H, Kelley R, Salzberg SL. TopHat2: accurate alignment of transcriptomes in the presence of insertions, deletions and gene fusions. Genome Biol. 2013;14:R36. doi: 10.1186/gb-2013-14-4-r36. [DOI] [PMC free article] [PubMed] [Google Scholar]
- 65.Pruitt KD, Brown GR, Hiatt SM, Thibaud-Nissen F, Astashyn A, Ermolaeva O, Farrell CM, Hart J, Landrum MJ, McGarvey KM, Murphy MR, O’Leary NA, Pujar S, Rajput B, Rangwala SH, Riddick LD, Shkeda A, Sun H, Tamez P, Tully RE, Wallin C, Webb D, Weber J, Wu W, DiCuccio M, Kitts P, Maglott DR, Murphy TD, Ostell JM. RefSeq: an update on mammalian reference sequences. Nucleic Acids Res. 2014;42:D756–763. doi: 10.1093/nar/gkt1114. [DOI] [PMC free article] [PubMed] [Google Scholar]
- 66.Anders S, Pyl PT, Huber W. HTSeq—a Python framework to work with high-throughput sequencing data. Bioinformatics. 2015;31:166–169. doi: 10.1093/bioinformatics/btu638. [DOI] [PMC free article] [PubMed] [Google Scholar]
- 67.Anders S, Huber W. Differential expression analysis for sequence count data. Genome Biol. 2010;11:R106. doi: 10.1186/gb-2010-11-10-r106. [DOI] [PMC free article] [PubMed] [Google Scholar]
- 68.Robinson MD, McCarthy DJ, Smyth GK. edgeR: a bioconductor package for differential expression analysis of digital gene expression data. Bioinformatics. 2010;26:139–140. doi: 10.1093/bioinformatics/btp616. [DOI] [PMC free article] [PubMed] [Google Scholar]
- 69.Mi H, Poudel S, Muruganujan A, Casagrande JT, Thomas PD. PANTHER version 10: expanded protein families and functions, and analysis tools. Nucleic Acids Res. 2016;44:D336–D342. doi: 10.1093/nar/gkv1194. [DOI] [PMC free article] [PubMed] [Google Scholar]
- 70.Subramanian A, Tamayo P, Mootha VK, Mukherjee S, Ebert BL, Gillette MA, Paulovich A, Pomeroy SL, Golub TR, Lander ES, Mesirov JP. Gene set enrichment analysis: a knowledge-based approach for interpreting genome-wide expression profiles. Proc Natl Acad Sci U S A. 2005;102:15545–15550. doi: 10.1073/pnas.0506580102. [DOI] [PMC free article] [PubMed] [Google Scholar]
Associated Data
This section collects any data citations, data availability statements, or supplementary materials included in this article.