

Abstract
Intrinsically disordered proteins (IDPs) or intrinsically disordered regions have not fixed tertiary structure, but play key roles in signal regulation, molecule recognition, and drug target. However it is difficult to study the structure and function of IDPs by traditional experimental methods because of their diverse conformations. Limitations of current generic protein force fields and solvent models were reported in the previous simulations of IDPs. We have also explored to overcome these limitations by developing ff99IDPs and ff14IDPs force fields to correct the dihedral distribution for eight disordered promoting residues often observed in IDPs and found encouraging improvements. Here, we extend our correction of backbone dihedral terms to all 20 naturally occurring amino acids in the IDP-specific force field (ff14IDPSFF) to further improve the quality in the modeling of IDPs. Extensive tests of seven IDPs and 14 unstructured short peptides show that the simulated Cα chemical shifts with the ff14IDPSFF force field are in quantitative agreement with those from NMR experiment and are more accurate than the base generic force field and also our previous ff14IDPs that only corrects the eight disorder-promoting amino acids. The influences of solvent models were also investigated and found to be less important. Finally our explicit solvent MD simulations further show that ff14IDPSFF can still be used to model structural and dynamical properties of two tested folded proteins, with a slightly better agreement in the loop regions for both structural and dynamical properties. These findings confirm that the newly developed IDP-specific force field ff14IDPSFF can improve the conformer sampling of intrinsically disordered proteins.
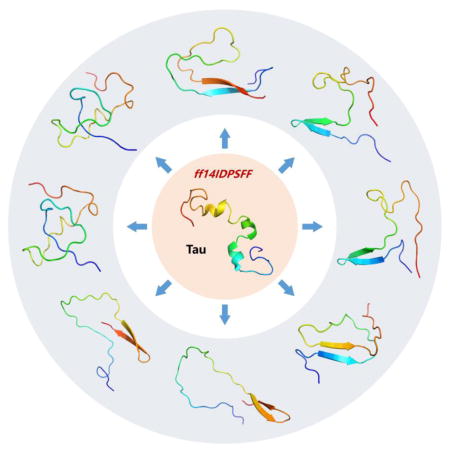
Graphical Abstract
Introduction
Intrinsically disordered proteins (IDPs) or intrinsically disordered regions (IDRs) do not have well-defined tertiary structures because of low sequence complexity and biased amino acid composition.1 The dogma dictates that proteins need a structure to function. Thus an interesting question is why so many proteins are in the state of disorder.2 IDPs and IDRs have been proved to play key roles in crucial biological functions, such as cell signaling, recognition, regulation and being in hub positions of networks.3, 4 Furthermore, IDPs are also found to have strong associations with many diseases, such as cancer, diabetes, Alzheimer’s disease, Parkinson’s disease, amyloidosis, and others.5, 6 All these findings have greatly motivated the studies of structure-function relationship of IDPs and IDRs.
However, due to the heterogeneous nature of IDP structures, it is a challenge to apply conventional X-ray and NMR techniques to study these interesting proteins. Molecular dynamics (MD) simulations can create a dynamical heterogeneous structural distribution and provide a valuable complement to experiment for studies the structure-function relationship of IDPs. However, solvent models and force fields of MD simulation are thought to be two main limitations in proper sampling of IDPs. For example, influences of different solvent models on the structural property of IDPs have been discussed in the literature.7–9 In this work, we focus on the limitations of generic protein force fields to sample IDPs, with one potential caveat in how crystal structures have been used in the calibration of these force fields,10–12 which often involves comparing simulated backbone dihedrals (φ/ψ) distributions with those found in folded proteins as observed in crystal structures.
We hypothesized that the backbone dihedral terms could be altered to improve the sampling of IDPs by any generic protein force field.10–12 An issue in the revision of a generic force field is the lack of training data to improve the dihedral angle terms. To overcome this initial difficulty, we relied on a working hypothesis to use coiled regions (or amino acids in the loop regions) from crystal structures to model the conformations of disordered amino acids in the construction of an IDP-specific force field. Based on this strategy, we developed two IDP-specific force fields with limited corrections on eight disorder-promoting residues only (A, G, P, R, Q, S, E, and K as reported in the literature13–16), ff99IDPs and ff14IDPs, assisted with the CMAP method.10–12 These IDP-specific force fields were shown to improve the structural distributions of IDPs significantly. However, our statistical analyses show that order-promoting residues are also quite common in IDPs and IDRs, but ff99IDPs and ff14IDPs do not correct these residues. Our previous analyses show that the lack of correction of these residues causes somewhat larger discrepancy with experiment on these residues even if overall improvement is apparent over the generic protein force fields.10–12 We thus further hypothesized that it is beneficial to optimize the backbone dihedral terms for all 20 naturally occurring amino acids to improve the performance of an IDP-specific force field.
Following this rational, we extended backbone dihedral corrections to all 20 natural amino acids starting from a well-calibrated generic protein force field ff14SB.17 These residue-specific corrections form the foundation of our IDP-specific force field (ff14IDPSFF) for sampling IDPs/IDRs. Extensive validations involving multiple IDPs were used to analyze the qualities of the new force field as well as ff14SB and ff14IDPs,12 including inducible transactivation domain of the transcription factor CREB potentiates (KID),18, 19 p53 transactivation domain (TAD),20, 21 hematopoietic transcription factor c-Myb,22, 23 aspartic proteinase inhibitor IA3,24 microtubule-associated protein Tau, α-Synuclein,25 arginine-rich motif of HIV-1 Rev (HIV Rev),26 and 14 unstructured short peptides of EGAAXAASS (X = K, L, Q, G, T, Y, D, E, H, N, I, P, V, and W).27 Finally two typical structural proteins lysozyme28 and ubiquitin29 were also used to validate the ability of ff14IDPSFF in sampling structured proteins with identical simulation conditions.
Methods
CMAP method
Grid-based energy correction maps30–32 were utilized to minimize the differences in the dihedral distributions between MD simulations and benchmarks for all 20 amino acids. This method is previously integrated in the CHARMM software package and was ported to the Amber simulation package.33, 34 To correct the dihedral energies, a CMAP energy term was added to every pair of backbone dihedral terms in the Amber potential energy function as in our previous studies. Different from our previous attempts,10–12 the dihedral distributions for all 20 amino acids were corrected with CMAP. 576 grids were used in the CMAP files for each amino acid. The di-peptide models (Nme-X-Ace, X represents a given amino acid, Nme stands for aminomethyl and Ace for acetyl) were utilized during the CMAP optimization via explicit solvent MD simulations. Similar models were also applied in the previous Amber force field ff14SB developments.35, 36 The optimization of the CMAP correction terms for IDPs is described in detail in our previous works.10–12 Root mean square deviations of population (termed RMSp) among all bins were calculated to quantitatively measure the difference between MD and database populations and calculated with the equation 1. Briefly, the CMAP parameters were optimized iteratively until the MD distributions match the benchmark distributions within a given tolerance, set to be less than 0.10%. In order to avoid the overfitting for the optimization of CMAP parameter, the energy of the specific grid will set to 0 kcal/mol when the energy of benchmark is higher than the highest energy of simulation.
| (1) |
Data collection of coiled protein structures
Based on our working hypothesis to use coiled regions (or amino acids in the loop regions) from crystal structures to model the conformations of disordered amino acids, we constructed a database of 24,236 protein structures with sequence identity less than 50% and R factor less than 0.25 from the RCSB protein structure databank. The DSSP program was utilized to assign the secondary structures and dihedral angles for these proteins.37, 38 Segments with consecutive three or more residues without any secondary structures were defined as ‘coil segments’.39, 40 A total of 278,178 coil segments were collected from the protein structure database. A total of 1,075,744 pairs of backbone dihedrals angles were collected from these coil segments. Amino acid composition of these coil segments is illustrated in Figure 1. It is apparent that order-promoting residues also contained in most coil regions. Thus, we hypothesized that it is beneficial to optimize the backbone dihedral terms for all 20 amino acids to improve the performance of an IDP-specific force field.
Figure 1.

Amino acid composition of coil segments.
Integration with Amber ff14IDPSFF force field
The CMAP parameters of the 20 residues are organized into an ASCII database file to be incorporated into topology files after standard coordinate and topology files are generated with the LEaP module. Apparently users must choose ff14SB as the generic protein force field to use the database file. A perl script was also developed to facilitate the revision of standard Amber topology files. In doing so, standard MD simulations can be executed without further modification.
Molecular dynamics simulations
Initial dipeptide structures for 20 amino acids were built in the all-trans conformation with the LEaP module in the Amber 14 suite 34. Counter-ions were added to neutralize the systems, which were then solvated in a truncated octahedron box of TIP3P water molecules with a buffer of 10 Å.41 In order to compare the effects of solvent models on modeling IDPs, TIP4P-EW,42 and TIP5P43 models were also tested in simulations. Long-range electrostatic interactions were calculated with Particle Mesh Ewald (PME) algorithm.44 The CUDA version of PMEMD45 was used to accelerate the MD simulations. All bonds involving hydrogen atoms were constrained with the SHAKE algorithm.46 All systems were relaxed for 20,000-step with the steepest descent minimization, then were heat up for 20 ps and equilibrated for 20 ps in the NPT ensemble at 298K with PMEMD.
The initial structures of these IDPs were directly extracted from Protein Data Bank in bound state, for example, KID (1KDX ), p53 (1YCR), IA3(1DP5), Tau(2MZ7), c-Myb(2AGH), αSynuclein (2KKW), and HIVRev (1ETF). To compare the performances of ff14IDPSFF, ff14IDPs and ff14SB, five independent trajectories per force field were simulated for each of KID, p53, IA3, Tau, c-Myb, αSynuclein, and HIVRev. To further evaluate the force field, 14 unstructured short peptides were simulated under ff14IDPSFF and ff14SB.27 These were all solvated in the TIP3P solvent model. For KID, two modern solvent models (TIP4P-EW and TIP5P) were used in simulations with ff14SB to study their effects in IDPs simulations with the generic protein force field. The two modern solvent models were also used in simulations of all IDPs with ff14IDPSFF to study their overall effects in all tested IDPs. In order to compare the performance of CHARMM36m force field for sampling the conformer of IDPs47, GROMACS 5.0.4 package was used to simulate five trajectories for apo-HIVRev48. Lysozyme and ubiquitin, as typical structural proteins, are often used to validate generic protein force fields. Thus, they were adopted here to evaluate the performance of ff14IDPSFF on simulations of structural proteins. Table 1 summarizes the detail simulation conditions for all tested proteins.
Table 1.
MD simulation conditions for all tested systems
| System | Force field | Solvent | Trajectories | Time (ns) | BMRB Index |
|---|---|---|---|---|---|
| Apo-KID | ff14SB | TIP3P | 5 | 200 | 6784 |
| TIP4P-EW | 5 | 200 | |||
| TIP5P | 5 | 200 | |||
| ff14IDPs | TIP3P | 5 | 200 | ||
| ff14IDPSFF | TIP3P | 5 | 200 | ||
| TIP4P-EW | 5 | 200 | |||
| TIP5P | 5 | 200 | |||
|
| |||||
| Apo-c-Myb | ff14SB | TIP3P | 5 | 130 | - |
| ff14IDPs | TIP3P | 5 | 130 | ||
| ff14IDPSFF | TIP3P | 5 | 130 | ||
| TIP4P-EW | 5 | 130 | |||
| TIP5P | 5 | 130 | |||
|
| |||||
| Apo-Tau | ff14SB | TIP3P | 5 | 100 | 17945 |
| ff14IDPs | TIP3P | 5 | 100 | ||
| ff14IDPSFF | TIP3P | 5 | 100 | ||
| TIP4P-EW | 5 | 100 | |||
| TIP5P | 5 | 100 | |||
|
| |||||
| Apo-IA3 | ff14SB | TIP3P | 5 | 100 | 6078 |
| ff14IDPs | TIP3P | 5 | 100 | ||
| ff14IDPSFF | TIP3P | 5 | 100 | ||
| TIP4P-EW | 5 | 100 | |||
| TIP5P | 5 | 100 | |||
|
| |||||
| Apo-αSynuclein | ff14SB | TIP3P | 5 | 100 | 19337 |
| ff14IDPs | TIP3P | 5 | 100 | ||
| ff14IDPSFF | TIP3P | 5 | 100 | ||
| TIP4P-EW | 5 | 100 | |||
| TIP5P | 5 | 100 | |||
|
| |||||
| Apo-p53 | ff14SB | TIP3P | 5 | 130 | 17760 |
| ff14IDPs | TIP3P | 5 | 130 | ||
| ff14IDPSFF | TIP3P | 5 | 130 | ||
| TIP4P-EW | 5 | 130 | |||
| TIP5P | 5 | 130 | |||
|
| |||||
| Apo-HIVRev | ff14SB | TIP3P | 5 | 140 | 18851 |
| ff14IDPs | TIP3P | 5 | 140 | ||
| CHARMM36m | TIP3P | 5 | 140 | ||
| ff14IDPSFF | TIP3P | 5 | 140 | ||
|
|
|
||||
| TIP4P-EW | 5 | 140 | |||
| TIP5P | 5 | 140 | |||
|
| |||||
| Lysozyme | ff14SB | TIP3P | 5 | 100 | 4562, |
| ff14IDPs | 5 | 100 | |||
| ff14IDPSFF | 5 | 100 | 18304(S2) | ||
|
| |||||
| Ubiquitin | ff14SB | TIP3P | 5 | 100 | 5487, |
| ff14IDPs | 5 | 100 | |||
| ff14IDPSFF | 5 | 100 | 6470(S2) | ||
|
| |||||
| pepK (EGAAKAASS) | ff14SB | TIP3P | 5 | 100 | - |
| ff14IDPSFF | 5 | 100 | |||
|
| |||||
| pepL (EGAALAASS) | ff14SB | TIP3P | 5 | 100 | - |
| ff14IDPSFF | 5 | 100 | |||
|
| |||||
| pepQ (EGAAQAASS) | ff14SB | TIP3P | 5 | 100 | - |
| ff14IDPSFF | 5 | 100 | |||
|
| |||||
| pepG (EGAAGAASS) | ff14SB | TIP3P | 5 | 100 | - |
| ff14IDPSFF | 5 | 100 | |||
|
| |||||
| pepT (EGAATAASS) | ff14SB | TIP3P | 5 | 100 | - |
| ff14IDPSFF | 5 | 100 | |||
|
| |||||
| pepY (EGAAYAASS) | ff14SB | TIP3P | 5 | 100 | - |
| ff14IDPSFF | 5 | 100 | |||
|
| |||||
| pepD (EGAADAASS) | ff14SB | TIP3P | 5 | 100 | - |
| ff14IDPSFF | 5 | 100 | |||
|
| |||||
| pepE (EGAAEAASS) | ff14SB | TIP3P | 5 | 100 | - |
| ff14IDPSFF | 5 | 100 | |||
|
| |||||
| pepH (EGAAHAASS) | ff14SB | TIP3P | 5 | 100 | - |
| ff14IDPSFF | 5 | 100 | |||
|
| |||||
| pepN (EGAANAASS) | ff14SB | TIP3P | 5 | 100 | - |
| ff14IDPSFF | 5 | 100 | |||
|
| |||||
| pepI (EGAAIAASS) | ff14SB | TIP3P | 5 | 100 | - |
| ff14IDPSFF | 5 | 100 | |||
|
| |||||
| pepP (EGAAPAASS) | ff14SB | TIP3P | 5 | 100 | - |
| ff14IDPSFF | 5 | 100 | |||
|
| |||||
| pepV (EGAAVAASS) | ff14SB | TIP3P | 5 | 100 | - |
| ff14IDPSFF | 5 | 100 | |||
|
| |||||
| pepW (EGAAWAASS) | ff14SB | TIP3P | 5 | 100 | - |
| ff14IDPSFF | 5 | 100 | |||
Data Analyses
CPPTRAJ in AmberTools14 was used to analyze the root mean square deviations (RMSD), fluctuations (RMSF), and backbone dihedral angles.34 Conformational clustering was performed with the Kclust program in the MMTSB tool set with default setting.49 The secondary structures were assigned with the DSSP program. The experimental values of Cα chemical shift data for eight tested systems were downloaded from the BRMB database50 and the access numbers were shown in Table 1. Cα chemical shift data for the test systems were calculated with SPARTA version 1.01.51, 52 And N-H order parameters (S2) were calculated with the Karplus equation.53 The helicity was computed as documented in the literature.10 Clustered conformations are used in cumulative average calculation of chemical shifts and order parameters from the most populated to the least populated.52 Averaging is observed to converge after about 70% of the clusters are used in all calculations.
Results and Discussion
CMAP parameter optimization
An iterative optimization was conducted to obtain the CMAP parameters of each residue to improve the agreement between simulated backbone distributions and database backbone distributions. The root-mean-squared deviations of population (RMSp) of these optimizations are shown in Figure 2. It shows that the RMSp for 20 amino acids between CMAP0 (ff14SB) and the benchmark are higher than 0.278%. After the optimization, the RMSp’s for 18 amino acids between the best CMAP parameter set and the benchmark are less than 0.087%, the RMSp is reduced to 0.154% for Pro, and reduced to 0.130% for Trp. The distribution of phi/psi for coil segments of benchmark, ff14SB, and ff14IDPSFF of 20 amino acids are shown in supplementary Figure S1.
Figure 2.

RMSD of populations between simulation and benchmark for 20 amino acids versus optimization iteration steps.
Overview of Force Field Validation: Comparison with NMR
To validate the performance of IDP-specific force field ff14IDPSFF on modeling IDPs, seven intrinsically disordered proteins: KID, p53, IA3, Tau, c-Myb, αSyn, and HIVRev were simulated in ff14SB, ff14IDPs, and ff14IDPSFF, respectively. For these MD simulations, conformational clusters over accumulated simulation time (0–50ns, 0–55ns, 0–60ns, 0–65ns, and so on) were monitored to evaluate the convergence of conformational sampling (supplementary Figure S2). This analysis suggests that the numbers of clusters do not change significantly at the end of the simulations, indicating that the chosen simulation lengths are appropriate for sampling these IDPs.
A detailed comparison between predicted values and measured values of the backbone Cα chemical shifts for these IDPs is shown in Figure 3 and Figure S2 for the unstructured short peptides. A summary of the RMSD’s between prediction and measurement is listed in Table 2. Inspection of Table 2 shows a clear trend of reducing RMSD’s with respect to NMR from ff14SB to ff14IDPs and finally to ff14IDPSFF. This confirms our systematic strategy to correct the biases imbedded in generic protein force fields by targeting the coil regions of known protein structures. Among these IDPs, IA3 is also investigated by Mei and co-workers with AMBER99SB2D force field and the helical structure rapidly unfolds, whose simulations are extended to 1000 ns.54 For unstructured short peptides, the RMSD’s between predicted and measured chemical shifts for ff14IDPSFF are also significantly less than those for ff14SB. Of course there are still some differences between simulation and experiment, with the largest deviations mainly in KID and HIVRev. At the same time, CHARMM36m was also used to explore the conformer sampling for HIVRev. The RMSD of secondary chemical shift between simulation and experiment for CHARMM36m was 1.393ppm and larger than that for ff14IDPSFF (shown in supplementary Figure S3). Inspection of their sequences show that the deviated regions have higher number of charged residues. Thus, the somehow larger discrepancy is potentially due to the presence of long-lasting salt bridging interactions. Detailed structural analysis will be discussed below.
Figure 3.

Comparison of Cα chemical shifts between MD simulation and NMR experiment. A: Apo-KID. B: Apo-c-Myb. C: Apo-Tau. D: Apo-IA3. E: Apo-p53. F: Apo-HIVRev. G: Apo-αSynuclein.
Table 2.
RMSD (ppm) of Cα chemical shifts between predicted simulation and NMR experiment
| Name | ff14SB | ff14IDPs | ff14IDPSFF |
|---|---|---|---|
| Apo-KID | 1.776 | 1.397 | 0.559 |
| Apo-c-Myb | 1.958 | 1.131 | 0.474 |
| Apo-Tau | 1.425 | 0.913 | 0.547 |
| Apo-IA3 | 2.163 | 1.515 | 0.513 |
| Apo-αSynuclein | 0.583 | 0.402 | 0.393 |
| Apo-p53 | 1.360 | 1.203 | 0.725 |
| Apo-HIVRev | 1.460 | 0.764 | 0.591 |
|
| |||
| pepK | 0.610 | - | 0.170 |
| pepL | 0.680 | - | 0.180 |
| pepQ | 0.770 | - | 0.200 |
| pepG | 0.450 | - | 0.340 |
| pepT | 0.600 | - | 0.230 |
| pepY | 0.590 | - | 0.220 |
| pepD | 0.980 | - | 0.310 |
| pepE | 1.090 | - | 0.230 |
| pepH | 0.550 | - | 0.290 |
| pepN | 0.640 | - | 0.220 |
| pepI | 1.210 | - | 0.260 |
| pepP | 0.890 | - | 0.320 |
| pepV | 0.920 | - | 0.290 |
| pepW | 0.460 | - | 0.290 |
Structural Distribution of KID
Figure 4 shows the results of backbone RMSD, PMF landscapes, average helicity, and secondary Cα chemical shift for KID simulated with ff14IDPSFF, ff14IDPs and ff14SB. The free energy landscapes with reaction coordinates of Rg and RMSD show the distributions of conformers with the three different force fields. It is apparent that the populated conformational space with ff14IDPSFF is the largest among the three, indicating more heterogeneous structures visited with ff14IDPSFF.
Figure 4.

Cα RMSDs and free energy landscapes for apo-KID derived from simulations with ff14IDPSFF, ff14IDPs, and ff14SB. (A) Cα RMSD for all five independent trajectories. (B) Free energy landscapes over radius of gyration (Rg) and RMSD.
To further illustrate the performance of IDP-specific force field ff14IDPSFF in terms of conformational clustering, top 8 clusters and their occupancies with ff14SB, ff14IDPs, and ff14IDPSFF are shown in Figure 5. The top 8 clusters with ff14SB occupy 99.93% of sampled snapshots. All conformers have stable tertiary structure and include high percentage of α-helix. The top 8 clusters with ff14IDPs only occupy 58.94% of sampled snapshots with partly disordered structures. Furthermore, the top 8 conformational clusters with ff14IDPSFF occupy less than 40.54% of sampled snapshots. Most conformers show disordered state and include few secondary structural elements especially in helix αB, in agreement with the findings by Ishwar et al.18
Figure 5.

Representative conformers of top 8 clusters and their occupancies for apo-KID derived from simulations with ff14IDPSFF, ff14IDPs, and ff14SB.
It is apparent that ff14IDPSFF significantly improves the prediction of chemical shifts of helix αA as in Figure 3A. However, there are still some noticeable differences between experiment and simulation for helix αB. Inspection of Figure 3A shows that the largest deviations (over 1ppm) are located nearby Arg, Lys, Ile, and Leu. These could be due to over-stabilized salt bridges and/or hydrophobic interactions. The salt bridging interactions within KID were monitored and shown in Figure 6. The convergences of salt bridge interactions are shown in Figure S5. Figure 6 indicates that more salt bridges are formed in αB, preventing it from entering the disordered state. This is the case even if both helices have similar presence of ionizable amino acids.
Figure 6.

Salt bridge interactions within apo-KID.
Structural Distribution of HIVRev
HIVRev has a high proportion of charged residues (10 out of 21). Top 8 conformational clusters and free energy landscapes with ff14IDPSFF, ff14IDPs and ff14SB are shown in Figure 7. It was found that the top 8 clusters with ff14SB occupy 98.78% of the snapshots. All of the conformers include high percentage of helical structures. The top 8 clusters with ff14IDPs only occupy 29.44% of the snapshots with partially disordered structures. Furthermore, the top 8 clusters with ff14IDPSFF occupy less than 24.16% of the snapshots, all showing a high proportion of disordered structures. The free energy landscapes with the reaction coordinates of Rg and RMSD indicate that the conformational space sampled with ff14IDPSFF is the largest among all three force fields.
Figure 7.

Top 8 clusters and free energy landscapes for apo-HIVRev derived from simulations with ff14IDPSFF, ff14IDPs and ff14SB. (A) Top 8 clusters and their occupancies. (B) Free energy landscape over radius of gyration (Rg) and RMSD.
HIVRev is the second case with large deviations (1ppm) from experimental chemical shifts. Furthermore, this is the case that ff14IDPSFF produces structures too unstable. Given the over-presence of charge residues, we again hypothesized that the sampling of salt bridge interactions is the cause. The distributions of salt bridges are shown in Figure 8. Again their convergences are shown in Figure S5. Overall, the salt bridge populations are the lowest with ff14IDPSFF. Nevertheless, salt bridges nearby the N-terminal region are probably modeled well. The main discrepancy is in the C-terminal region where multiple arginines are competing with the sole glutamate (E18). Combining the cases in KID and HIVRev, the likely reason behind these two large opposite deviations from experiment indicates that there are still further rooms for improvement in our ongoing force field development targeting disordered proteins. Certainly, solvent model should be another effect to the salt-bridge interaction. Therefore, the combination of force field and solvent model are the next work for further improvement.
Figure 8.

Salt bridge interactions within HIVRev.
Structural Distribution of c-Myb
c-Myb is another intrinsically disordered proteins which play key roles in cellular proliferation of immature hematopoietic cells.55 The simulation results of top 8 clusters and PMF landscapes with ff14IDPSFF, ff14IDPs and ff14SB are shown in Figure 9. It was found that the top 8 clusters with ff14SB occupy 97.0% of the snapshots. All of the conformers stay highly structured and include high percentage of helical structure. The top 8 clusters with ff14IDPs only occupy 35.54% of the snapshots with partly disordered structures. Furthermore, the top 8 clusters with ff14IDPSFF occupy less than 28.82% of the snapshots with all conformers showing disordered structures, which is in agreement with experiment.23 The free energy landscapes show populated conformational space with ff14IDPSFF is the largest among these force fields. The simulated helicity (I295-L309 shown in Figure S6) with ff14IDPSFF also agrees with experiment the best among the tested force fields.23
Figure 9.

Top 8 clusters and free energy landscapes for Apo-c-Myb derived from simulations with ff14IDPSFF, ff14IDPs and ff14SB. (A) Top 8 clusters and their occupancies. (B) Free energy landscapes over radius of gyration (Rg) and RMSD.
Structural Distribution of Tau
Tau is a highly soluble protein associated with microtubule. It interacts with tubulin to stabilize microtubules and promote tubulin assembly into microtubules.56 Aggregation of Tau induces nervous system diseases such as Alzheimer's disease and Parkinson's disease.57 Previous work indicates that Tau has the characteristics of natively disordered proteins.58 Conformational clustering and free energy landscape of Tau are shown in Figure 10. The top 8 clusters with ff14SB occupy 29.80% of conformational ensemble, 20.28% with ff14IDPs, and 29.40% with ff14IDPSFF. To our surprise, β structures are present in 6 out of the top 8 clusters from ff14IDPSFF simulations. This indicates that diverse β structures may be readily accessible at the physiological condition, consistent with previous experimental observations that Tau aggregates as β sheet structures.59, 60
Figure 10.

Top 8 clusters and free energy landscapes for Apo-Tau derived from simulations with ff14IDPSFF, ff14IDPs and ff14SB. (A) Top 8 clusters and their occupancies. (B) Free energy landscape over radius of gyration (Rg) and RMSD.
Effects of Solvent Models in Simulations of IDPs
To illustrate the influence of solvent models with generic protein force fields in simulation of IDPs, we tested TIP3P, TIP4P-EW, and TIP5P models with ff14SB in the simulation of KID. The comparison between MD simulation and NMR measurement is shown in Figure 11A. These data show differences due to the use of different solvent models do exist, though the effect is small in the final agreement between simulation and experiment. Therefore, force field correction is necessary for improved structural sampling of IDPs.
Figure 11.

Influences of solvent models to simulations of IDPs in ff14SB and ff14IDPSFF. A: ff14SB. B: ff14IDPSFF.
Nevertheless, the small effects of solvent models may be masked by the biases in generic protein force fields. We thus hypothesized that the solvent model may exert a larger role in simulations in IDPs with ff14IDPSFF. To verify this hypothesis, MD simulations of KID with TIP3P, TIP4P-EW, and TIP5P solvent models were conducted in ff14IDPSFF, respectively. The comparison with NMR experiment is shown in Figure 11B. The analysis suggests that the ff14IDPSFF with the modern solvent models of TIP4P-EW and TIP5P do not improve the agreement with experimental measurement. The helicities of αA (D120 ~ S129) and αB (Y134 ~ D144) of KID under different force fields and solvent models were also analyzed and shown in Figure 12. The red dash lines represent the ranges of experimental helicity reported by Ishwar and coworkers,18 with the helicity of αA between 50% and 60% and that of αB around 10%. The simulated helicity of αA with ff14IDPSFF/TIP3P is in reasonable agreement with experiment and that with ff14IDPs/TIP3P is the best. For αB, the result with ff14IDPSFF/TIP3P still agrees with experiment the best. These detailed comparison between simulation and experiment for KID further supports the accuracy of ff14IDPSFF with the TIP3P solvent in modeling IDPs structures.
Figure 12.

Helicity of αA and αB in apo-KID from simulations with ff14SB, ff14IDPs, ff14IDPSFF force fields solvated in either TIP3P, TIP4P/EW, or TIP5P models.
Finally the influence of solvent models in simulations in ff14IDPSFF was analyzed for all other IDPs. Table 3 summarizes the RMSD’s of Cα chemical shifts for all MD simulations in different solvent models for all tested IDPs. Except p53, the performance of the TIP3P solvent model for all IDPs remains the best when combined with the ff14IDPSFF force field, consistent with the detailed case study presented above. It is possible that the use of TIP3P in the optimization of ff14IDPSFF against the benchmark data contributed to the overall better performance of the TIP3P solvent model. Thus our future efforts will also explore optimizing the IDPs force field with the modern solvent models.
Table 3.
RMSD (ppm) of Cα chemical shifts between simulation and NMR experiment with ff14IDPSFF in three solvent models
| IDPs | TIP3P | TIP4P-EW | TIP5P |
|---|---|---|---|
| Apo-KID | 0.559 | 0.740 | 1.193 |
| Apo-c-Myb | 0.474 | 0.692 | 1.176 |
| Apo-Tau | 0.547 | 0.585 | 1.008 |
| Apo-IA3 | 0.513 | 0.601 | 1.044 |
| Apo-αSynuclein | 0.393 | 0.434 | 0.412 |
| Apo-p53 | 0.725 | 0.682 | 0.504 |
| Apo-HIVRev | 0.591 | 0.775 | 1.342 |
Performance on Structured Proteins: Lysozyme and Ubiquitin
Given that ff14IDPSFF performs better in the simulations of IDPs, a natural question to ask is whether the better performance is at the cost of modeling structured proteins poorly. To address this question, two typical model proteins (lysozyme and ubiquitin) were tested in MD simulations with identical conditions used in IDPs simulations. The simulation data for lysozyme with ff14IDPSFF, ff14IDPs, and ff14SB are shown in Figure S7. The agreements of simulated Cα chemical shifts with experiment are very similar among simulations with ff14IDPSFF, ff14SB, and ff14IDPs. This indicates that ff14IDPSFF can model the folded/ordered protein structures such as lysozyme. Similar observation can also be noted for the ubiquitin simulation (Figure S8). In addition the NMR order parameters (S2) for lysozyme and ubiquitin were used to study the quality of backbone dynamical properties in simulations with ff14IDPSFF, ff14SB and ff14IDPs (Figure S9). Again, similar agreements with experiment are apparent.
Finally the alignments between crystal structure and the mean simulated structures (snapshot closest to the mean) for lysozyme and ubiquitin are shown in Figure S10 and residue-specific deviations are shown in Figure S11. Overall three forces fields perform very similarly in reproducing the crystal structure all with sub-Angstrom overall Cα RMSD. Figure S11 shows that detailed backbone structural features are also highly similar in all three sets of simulations. Worth pointing out is that most loop regions are modeled best or among the best with ff14IDPSFF within the three tested force fields, supporting our practice of targeting coil regions in the refinement of backbone dihedral terms. Surprisingly, the better agreement in the loop regions are not at the cost of reducing the agreement in ordered secondary structures. Of course, noticeable worse agreement is also found in the short coil around D101 in lysozyme. This is not unexpected since short fragments are not covered in our benchmark dataset and will be analyzed in detail in our future development of IDPs force fields.
Conclusion
Based on our previous efforts in developing IDPs-specific force fields, we hypothesized that it is beneficial to optimize the backbone dihedral terms for all 20 amino acids to improve the performance of an IDP-specific force field. We followed the same CMAP optimization procedure starting from the generic protein force field ff14SB to develop the IDP-specific ff14IDPSFF force field.
Test results of seven IDPs show a clear trend of reducing chemical shift RMSD’s with respect to NMR from ff14SB to ff14IDPs and finally to ff14IDPSFF. Testing with fourteen unstructured short peptides suggests that the simulated Cα chemical shifts with the ff14IDPSFF force field are also in very good agreement with experimental NMR measurements. Furthermore, ff14IDPSFF produces diverse β-sheet conformers for the Tau protein, consistent with previous experimental observations that Tau aggregates as β sheet structures. These results confirm our systematic strategy to correct the biases imbedded in generic protein force fields by targeting the coil regions of known protein structures. The effect of solvent models is investigated and found to play less significant roles in simulations of IDPs. Except p53, the performance of TIP3P solvent model for all IDPs is the best when combined with the ff14IDPSFF force field. Finally, our simulation results show that ff14IDPSFF can be used to model structural and dynamical properties of tested proteins.
These findings confirm that the newly developed IDP-specific ff14IDPSFF force field is a robust model for modeling IDPs. Nevertheless, further improvements are possible to reduce biases in the direction of either too ordered or too disordered in these tested IDPs. It is also instructive to explore IDP-specific force field better compatible with modern solvent models. Given that the discrepancy with experiment has been reduced dramatically, it is desirable to apply enhanced sampling techniques in development and application of future IDPs force fields. Eliminating these biases and improving compatibility with modern solvent models will be our immediate efforts next step.
Supplementary Material
Acknowledgments
This work was supported by Center for HPC at Shanghai Jiao Tong University, the National High-tech R&D Program of China (863 Program) (2014AA021502), the National Natural Science Foundation of China (31620103901 and J1210047), Medical Engineering Cross Fund of Shanghai Jiaotong University (YG2013MS68, YG2014MS47, and YG2015MS56), and National Institutes of Health/NIGMS (GM093040 & GM079383).
Footnotes
There is no conflict of interest.
Figure S1 plots the distribution of phi/psi dihedral for coil segments, ff14SB, and ff14IDPSFF of 20 amino acids. Figure S2 plots cumulative numbers of conformational clusters over simulation time with tested force fields. A: Apo-p53 TAD; B: Apo-IA3; C: Apo-c-Myb; D: Apo-Tau; E: Apo-HIVRev; F: Apo-α-Synuclein; G: Apo-KID. Figure S3 plots the secondary chemical shift of experiment and simulation of different force fields for Apo-HIVRev. Figure S4 plots Cα chemical shifts between MD in ff14SB and ff14IDPSFF and NMR for unstructured short peptides. Figure S5 plots Convergences of salt bridge interactions over accumulative simulation time. A: Apo-KID; B: Apo-HIVRev. Figure S6 plots comparison of simulated helicity for Apo-c-Myb in three tested force fields versus experiment. Figure S7 plots simulation properties, sequence-dependent helicity, and Cα chemical shifts from experiment from MD in ff14IDPSFF, ff14IDPs and ff14SB for lysozyme. (A) Cα RMSD for five trajectories. (B) Free energy landscape on 2D space of radius gyration (Rg) and RMSD, showing ff14IDPSFF could sample wider and more flexible conformation space. (C) Comparison of Ca chemical shift over sequence. Figure S8 plots simulation properties, sequence-dependent helicity, and Cα chemical shifts from experiment from MD in ff14IDPSFF, ff14IDPs and ff14SB for ubiquitin. (A) Cα RMSD for five trajectories. (B) Free energy landscape on 2D space of radius gyration (Rg) and RMSD, showing ff14IDPSFF could sample wider and more flexible conformation space. (C) Comparison of Ca chemical shift over sequence. Figure S9 plots comparison of order parameter (S2) versus sequence for the two tested folded proteins. Figure S10 plots alignment between crystal and simulation structures. A: Lysozyme. B: Ubiquitin. Figure S11 plots Cα deviations between crystal and simulation structures. A: Lysozyme. B: Ubiquitin. This material is available free of charge via the Internet at http://pubs.acs.org.
References
- 1.Dyson HJ, Wright PE. Intrinsically unstructured proteins and their functions. Nat Rev Mol Cell Biol. 2005;6:197–208. doi: 10.1038/nrm1589. [DOI] [PubMed] [Google Scholar]
- 2.Chouard T. Structural biology: Breaking the protein rules. Nature. 2011;471:151–153. doi: 10.1038/471151a. [DOI] [PubMed] [Google Scholar]
- 3.Wright PE, Dyson HJ. Intrinsically disordered proteins in cellular signalling and regulation. Nat Rev Mol Cell Biol. 2015;16:18–29. doi: 10.1038/nrm3920. [DOI] [PMC free article] [PubMed] [Google Scholar]
- 4.Cordeiro TN, Herranz-Trillo F, Urbanek A, Estana A, Cortes J, Sibille N, Bernado P. Small-angle scattering studies of intrinsically disordered proteins and their complexes. Curr Opin Struct Biol. 2016;42:15–23. doi: 10.1016/j.sbi.2016.10.011. [DOI] [PubMed] [Google Scholar]
- 5.Iakoucheva LM, Brown CJ, Lawson JD, Obradovi Z, Dunker AK. Intrinsic Disorder in Cell-signaling and Cancer-associated Proteins. J Mol Biol. 2002;323:573–584. doi: 10.1016/s0022-2836(02)00969-5. [DOI] [PubMed] [Google Scholar]
- 6.Oldfield CJ, Dunker AK. Intrinsically Disordered Proteins and Intrinsically Disordered Protein Regions. Annu Rev Biochem. 2014;83:553–584. doi: 10.1146/annurev-biochem-072711-164947. [DOI] [PubMed] [Google Scholar]
- 7.Best RB, Zheng W, Mittal J. Balanced Protein-Water Interactions Improve Properties of Disordered Proteins and Non-Specific Protein Association. J Chem Theory Comput. 2014;10:5113–5124. doi: 10.1021/ct500569b. [DOI] [PMC free article] [PubMed] [Google Scholar]
- 8.Best RB, Zheng W, Mittal J. Correction to Balanced Protein-Water Interactions Improve Properties of Disordered Proteins and Non-Specific Protein Association. J Chem Theory Comput. 2015;11:1978–1978. doi: 10.1021/acs.jctc.5b00219. [DOI] [PMC free article] [PubMed] [Google Scholar]
- 9.Piana S, Donchev A, Robustelli P, Shaw DE. Water dispersion interactions strongly influence simulated structural properties of disordered protein states. J Phys Chem B. 2015;119:5113–5123. doi: 10.1021/jp508971m. [DOI] [PubMed] [Google Scholar]
- 10.Wang W, Ye W, Jiang C, Luo R, Chen H. New Force Field on Modeling Intrinsically Disordered Proteins. Chem Biol Drug Des. 2014;84:253–269. doi: 10.1111/cbdd.12314. [DOI] [PubMed] [Google Scholar]
- 11.Ye W, Ji D, Wang W, Luo R, Chen HF. Test and Evaluation of ff99IDPs Force Field for Intrinsically Disordered Proteins. J Chem Inf Model. 2015;55:1021–1029. doi: 10.1021/acs.jcim.5b00043. [DOI] [PMC free article] [PubMed] [Google Scholar]
- 12.Song D, Wang W, Ye W, Ji D, Luo R, Chen HF. ff14IDPs force field improving the conformation sampling of intrinsically disordered proteins. Chem Biol Drug Des. 2017;89:5–15. doi: 10.1111/cbdd.12832. [DOI] [PMC free article] [PubMed] [Google Scholar]
- 13.Dunker AK, Lawson JD, Brown CJ, Williams RM, Romero P, Oh JS, Oldfield CJ, Campen AM, Ratliff CM, Hipps KW. Intrinsically disordered protein. J Mol Graphics Modell. 2001;19:26–59. doi: 10.1016/s1093-3263(00)00138-8. [DOI] [PubMed] [Google Scholar]
- 14.Williams RM, Obradovi Z, Mathura V, Braun W, Garner EC, Young J, Takayama S, Brown CJ, Dunker AK. The protein non-folding problem: amino acid determinants of intrinsic order and disorder. Pacific Symposium on Biocomputing. 2001;89:100. doi: 10.1142/9789814447362_0010. [DOI] [PubMed] [Google Scholar]
- 15.Romero P, Obradovic Z, Li X, Garner EC, Brown CJ, Dunker AK. Sequence complexity of disordered protein. Proteins: Struct, Funct Bioinf. 2001;42:38–48. doi: 10.1002/1097-0134(20010101)42:1<38::aid-prot50>3.0.co;2-3. [DOI] [PubMed] [Google Scholar]
- 16.Midic U, Obradovic Z. Intrinsic disorder in putative protein sequences. Proteome Sci. 2012;10:S19. doi: 10.1186/1477-5956-10-S1-S19. [DOI] [PMC free article] [PubMed] [Google Scholar]
- 17.Maier JA, Martinez C, Kasavajhala K, Wickstrom L, Hauser K, Simmerling C. ff14SB: Improving the accuracy of protein side chain and backbone parameters from ff99SB. J Chem Theory Comput. 2015;11:3696–3713. doi: 10.1021/acs.jctc.5b00255. [DOI] [PMC free article] [PubMed] [Google Scholar]
- 18.Radhakrishnan I, Pérez-Alvarado GC, Dyson HJ, Wright PE. Conformational preferences in the Ser 133-phosphorylated and non-phosphorylated forms of the kinase inducible transactivation domain of CREB. FEBS Lett. 1998;430:317–322. doi: 10.1016/s0014-5793(98)00680-2. [DOI] [PubMed] [Google Scholar]
- 19.Radhakrishnan I, Pérez-Alvarado GC, Parker D, Dyson HJ, Montminy MR, Wright PE. Solution Structure of the KIX Domain of CBP Bound to the Transactivation Domain of CREB: A Model for Activator:Coactivator Interactions. Cell. 1997;91:741–752. doi: 10.1016/s0092-8674(00)80463-8. [DOI] [PubMed] [Google Scholar]
- 20.Wells M, Tidow H, Rutherford TJ, Markwick P, Jensen MR, Mylonas E, Svergun DI, Blackledge M, Fersht AR. Structure of tumor suppressor p53 and its intrinsically disordered N-terminal transactivation domain. Proc Natl Acad Sci U S A. 2008;105:5762–5767. doi: 10.1073/pnas.0801353105. [DOI] [PMC free article] [PubMed] [Google Scholar]
- 21.Chen H, Luo R. Binding Induced Folding in p53-MDM2 Complex. J Am Chem Soc. 2007;129:2930–2937. doi: 10.1021/ja0678774. [DOI] [PMC free article] [PubMed] [Google Scholar]
- 22.Zor T, Guzman RND, Dyson HJ, Wright PE. Solution Structure of the KIX Domain of CBP Bound to the Transactivation Domain of c-Myb. J Mol Biol. 2004;337:521–534. doi: 10.1016/j.jmb.2004.01.038. [DOI] [PubMed] [Google Scholar]
- 23.Zor T, Mayr BM, Dyson HJ, Montminy MR, Wright PE. Roles of phosphorylation and helix propensity in the binding of the KIX domain of CREB-binding protein by constitutive (c-Myb) and inducible (CREB) activators. J Biol Chem. 2002;277:42241–42248. doi: 10.1074/jbc.M207361200. [DOI] [PubMed] [Google Scholar]
- 24.Li M, Phylip LH, Lees WE, Winther JR, Dunn BM, Wlodawer A, Kay J, Gustchina A. The aspartic proteinase from Saccharomyces cerevisiae folds its own inhibitor into a helix. Nat Struct Mol Biol. 2000;7:113–117. doi: 10.1038/72378. [DOI] [PubMed] [Google Scholar]
- 25.Rao JN, Jao CC, Hegde BG, Langen R, Ulmer TS. A combinatorial NMR and EPR approach for evaluating the structural ensemble of partially folded proteins. J Am Chem Soc. 2010;132:8657–8668. doi: 10.1021/ja100646t. [DOI] [PMC free article] [PubMed] [Google Scholar]
- 26.Tan R, Chen L, Buettner JA, Hudson D, Frankel AD. RNA recognition by an isolated alpha helix. Cell. 1993;73:1031–1040. doi: 10.1016/0092-8674(93)90280-4. [DOI] [PubMed] [Google Scholar]
- 27.Dames SA, Aregger R, Vajpai N, Bernado P, Blackledge M, Grzesiek S. Residual dipolar couplings in short peptides reveal systematic conformational preferences of individual amino acids. J Am Chem Soc. 2006;128:13508–13514. doi: 10.1021/ja063606h. [DOI] [PubMed] [Google Scholar]
- 28.Young ACM, Dewan JC, Nave C, Tilton RF. Comparison of radiation-induced decay and structure refinement from X-ray data collected from lysozyme crystals at low and ambient temperatures. J Appl Crystallogr. 1993;26:309–319. [Google Scholar]
- 29.Vijaykumar S, Bugg CE, Cook WJ. Structure of ubiquitin refined at 1.8 A resolution. J Mol Biol. 1987;194:531–544. doi: 10.1016/0022-2836(87)90679-6. [DOI] [PubMed] [Google Scholar]
- 30.Mackerell AD, Bashford D, Bellott MA, Dunbrack RL, Evanseck JD, Field MJ, Fischer S, Gao J, Guo H, Ha S. All-Atom Empirical Potential for Molecular Modeling and Dynamics Studies of Proteins. J Phys Chem B. 1998;102:3586–3616. doi: 10.1021/jp973084f. [DOI] [PubMed] [Google Scholar]
- 31.Feig M, Brooks CL, Mackerell DA. Improved Treatment of the Protein Backbone in Empirical Force Fields. J Am Chem Soc. 2004;126:698–699. doi: 10.1021/ja036959e. [DOI] [PubMed] [Google Scholar]
- 32.Mackerell AD, Feig M, Brooks CL. Extending the treatment of backbone energetics in protein force fields: Limitations of gas - phase quantum mechanics in reproducing protein conformational distributions in molecular dynamics simulations. J Comput Chem. 2004;25:1400–1415. doi: 10.1002/jcc.20065. [DOI] [PubMed] [Google Scholar]
- 33.Case DA, Cheatham TE, Darden TA, Gohlke H, Luo R, Merz KM, Onufriev AV, Simmerling C, Wang B, Woods RJ. The Amber biomolecular simulation programs. J Comput Chem. 2005;26:1668–1688. doi: 10.1002/jcc.20290. [DOI] [PMC free article] [PubMed] [Google Scholar]
- 34.Case DA, Babin VB, Berryman J, Betz RM, Cai Q, Cerutti DS, TC, Darden TA, Duke RE, Gohlke H. AMBER 14. University of California; San Francisco: 2014. [Google Scholar]
- 35.Cornell WD, Cieplak P, Bayly CI, Gould IR, Merz KM, Ferguson DM, Spellmeyer DC, Fox T, Caldwell JW, Kollman PA. A Second Generation Force Field for the Simulation of Proteins, Nucleic Acids, and Organic Molecules. J Am Chem Soc. 2010;117:5179–5197. [Google Scholar]
- 36.Hornak V, Abel R, Okur A, Strockbine B, Roitberg AE, Simmerling C. Comparison of multiple Amber force fields and development of improved protein backbone parameters. Proteins: Struct, Funct Bioinf. 2006;65:712–725. doi: 10.1002/prot.21123. [DOI] [PMC free article] [PubMed] [Google Scholar]
- 37.Kabsch W, Sander C. Dictionary of protein secondary structure: pattern recognition of hydrogen-bonded and geometrical features. Biopolymers. 1983;22:2577–2637. doi: 10.1002/bip.360221211. [DOI] [PubMed] [Google Scholar]
- 38.Joosten RP, Beek TAHT, Krieger E, Hekkelman ML, Hooft RWW, Schneider R, Sander C, Vriend G. A series of PDB related databases for everyday needs. Nucleic Acids Res. 2011;39:D411–D419. doi: 10.1093/nar/gkq1105. [DOI] [PMC free article] [PubMed] [Google Scholar]
- 39.Jiang F, Han W, Wu Y. The intrinsic conformational features of amino acids from a protein coil library and their applications in force field development. Phys Chem Chem Phys. 2013;15:3413–3428. doi: 10.1039/c2cp43633g. [DOI] [PubMed] [Google Scholar]
- 40.Jiang F, Zhou CY, Wu YD. Residue-Specific Force Field Based on the Protein Coil Library. RSFF1: Modification of OPLS-AA/L. J Phys Chem B. 2014;118:6983–6998. doi: 10.1021/jp5017449. [DOI] [PubMed] [Google Scholar]
- 41.Jorgensen WL, Chandrasekhar J, Madura JD, Impey RW, Klein ML. Comparison of Simple Potential Functions for Simulating Liquid Water. J Chem Phys. 1983;79:926–935. [Google Scholar]
- 42.Horn HW, Swope WC, Pitera JW, Madura JD, Dick TJ, Hura GL, Head-Gordon T. Development of an improved four-site water model for biomolecular simulations: TIP4P-Ew. J Chem Phys. 2004;120:9665–9678. doi: 10.1063/1.1683075. [DOI] [PubMed] [Google Scholar]
- 43.Mahoney MW. A five-site model for liquid water and the reproduction of the density anomaly by rigid, nonpolarizable potential functions. J Chem Phys. 2000;112:8910–8922. [Google Scholar]
- 44.Darden TA, York DM, Pedersen LG. Particle mesh Ewald: An N …, log(N) method for Ewald sums in large systems. J Chem Phys. 1993;98:10089–10092. [Google Scholar]
- 45.Gotz A, Williamson MS, Xu D, Poole D, Grand SML, Walker RC. Routine Microsecond Molecular Dynamics Simulations with AMBER on GPUs. 1. Generalized Born. J Chem Theory Comput. 2012;8:1542–1555. doi: 10.1021/ct200909j. [DOI] [PMC free article] [PubMed] [Google Scholar]
- 46.Ryckaert J, Ciccotti G, Berendsen HJC. Numerical integration of the cartesian equations of motion of a system with constraints: molecular dynamics of n-alkanes. J Comput Phys. 1977;23:327–341. [Google Scholar]
- 47.Huang J, Rauscher S, Nawrocki G, Ran T, Feig M, de Groot BL, Grubmuller H, MacKerell AD., Jr CHARMM36m: an improved force field for folded and intrinsically disordered proteins. Nat Methods. 2017;14:71–73. doi: 10.1038/nmeth.4067. [DOI] [PMC free article] [PubMed] [Google Scholar]
- 48.Hess B, Kutzner C, van der Spoel D, Lindahl E. GROMACS 4: Algorithms for Highly Efficient, Load-Balanced, and Scalable Molecular Simulation. J Chem Theory Comput. 2008;4:435–447. doi: 10.1021/ct700301q. [DOI] [PubMed] [Google Scholar]
- 49.Feig M, Karanicolas J, Brooks CL. MMTSB Tool Set: enhanced sampling and multiscale modeling methods for applications in structural biology. J Mol Graphics Modell. 2004;22:377–395. doi: 10.1016/j.jmgm.2003.12.005. [DOI] [PubMed] [Google Scholar]
- 50.Ulrich EL, Akutsu H, Doreleijers JF, Harano Y, Ioannidis YE, Lin J, Livny M, Mading S, Maziuk D, Miller Z, Nakatani E, Schulte CF, Tolmie DE, Kent Wenger R, Yao H, Markley JL. BioMagResBank. Nucleic Acids Res. 2008;36:D402–D408. doi: 10.1093/nar/gkm957. [DOI] [PMC free article] [PubMed] [Google Scholar]
- 51.Yang S, Bax A. Protein backbone chemical shifts predicted from searching a database for torsion angle and sequence homology. J Biomol NMR. 2007;38:289–302. doi: 10.1007/s10858-007-9166-6. [DOI] [PubMed] [Google Scholar]
- 52.Wang Y, Chu X, Longhi S, Roche P, Han W, Wang E, Wang J. Multiscaled exploration of coupled folding and binding of an intrinsically disordered molecular recognition element in measles virus nucleoprotein. Proc Natl Acad Sci U S A. 2013;110:E3743–E3752. doi: 10.1073/pnas.1308381110. [DOI] [PMC free article] [PubMed] [Google Scholar]
- 53.Pardi A, Billeter M, Wüthrich K. Calibration of the angular dependence of the amide proton-Cα, proton coupling constants, 3JHNα, in a globular protein: Use of 3JHNα, for identification of helical secondary structure. J Mol Biol. 1984;180:741–751. doi: 10.1016/0022-2836(84)90035-4. [DOI] [PubMed] [Google Scholar]
- 54.Gao Y, Zhang C, Zhang JZ, Mei Y. Evaluation of the Coupled Two-Dimensional Main Chain Torsional Potential in Modeling Intrinsically Disordered Proteins. J Chem Inf Model. 2017;57:267–274. doi: 10.1021/acs.jcim.6b00589. [DOI] [PubMed] [Google Scholar]
- 55.Gianni S, Morrone A, Giri R, Brunori M. A folding-after-binding mechanism describes the recognition between the transactivation domain of c-Myb and the KIX domain of the CREB-binding protein. Biochem Biophys Res Commun. 2012;428:205–209. doi: 10.1016/j.bbrc.2012.09.112. [DOI] [PubMed] [Google Scholar]
- 56.Kadavath H, Jaremko M, Jaremko Ł, Biernat J. Folding of the Tau Protein on Microtubules. Angew Chem IntEd. 2015;54:10347–10351. doi: 10.1002/anie.201501714. [DOI] [PubMed] [Google Scholar]
- 57.Skrabana R, Skrabanova-Khuebachova M, Kontsek P, Novak M. Alzheimer's-disease-associated conformation of intrinsically disordered tau protein studied by intrinsically disordered protein liquid-phase competitive enzyme-linked immunosorbent assay. Anal Biochem. 2006;359:230–237. doi: 10.1016/j.ab.2006.09.031. [DOI] [PubMed] [Google Scholar]
- 58.Narayanan RL, Durr UH, Bibow S, Biernat J, Mandelkow E, Zweckstetter M. Automatic assignment of the intrinsically disordered protein Tau with 441-residues. J Am Chem Soc. 2010;132:11906–11907. doi: 10.1021/ja105657f. [DOI] [PubMed] [Google Scholar]
- 59.Vaden TD, Gowers SA, Snoek LC. Observation of beta-sheet aggregation in a gas-phase tau-peptide dimer. J Am Chem Soc. 2009;131:2472–2474. doi: 10.1021/ja807760d. [DOI] [PubMed] [Google Scholar]
- 60.Pavlova A, Cheng CY, Kinnebrew M, Lew J, Dahlquist FW, Han S. Protein structural and surface water rearrangement constitute major events in the earliest aggregation stages of tau. Proc Natl Acad Sci U S A. 2016;113:E127–E136. doi: 10.1073/pnas.1504415113. [DOI] [PMC free article] [PubMed] [Google Scholar]
Associated Data
This section collects any data citations, data availability statements, or supplementary materials included in this article.