

SUMMARY
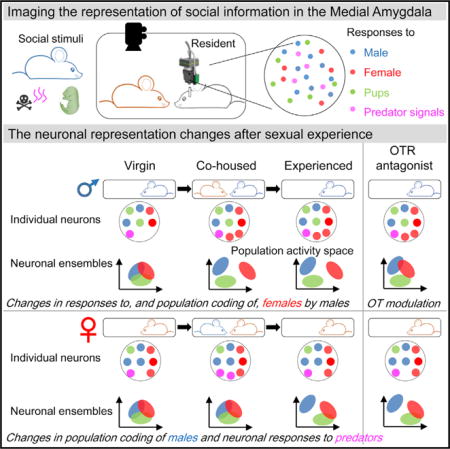
The medial amygdala (MeA) plays a critical role in processing species- and sex-specific signals that trigger social and defensive behaviors. However, the principles by which this deep brain structure encodes social information is poorly understood. We used a miniature microscope to image the Ca2+ dynamics of large neural ensembles in awake behaving mice and tracked the responses of MeA neurons over several months. These recordings revealed spatially intermingled subsets of MeA neurons with distinct temporal dynamics. The encoding of social information in the MeA differed between males and females and relied on information from both individual cells and neuronal populations. By performing long-term Ca2+ imaging across different social contexts, we found that sexual experience triggers lasting and sex-specific changes in MeA activity, which, in males, involve signaling by oxytocin. These findings reveal basic principles underlying the brain’s representation of social information and its modulation by intrinsic and extrinsic factors.
Graphical abstract
INTRODUCTION
A major goal in neuroscience is to understand how the brain interprets salient information from the external world and initiates appropriate behavioral responses. Hard-wired circuits are thought to process animal cues that trigger species-specific behaviors such as mating, territorial defense, parenting, and predator avoidance. Yet, these behavioral responses depend upon an animal’s social experience and physiological state, suggesting that the underlying circuits undergo adaptive modulatory changes. Classic studies have uncovered distinct sex- and species-specific signals underlying social recognition and have contrasted simple sign stimuli used by insects, fish, and birds (Tinbergen, 1951) with more complex multisensory cues required to elicit social responses in mammals (Beach, 1947).
In rodents, the processing of animal cues by the vomeronasal system is essential for the discrimination of sex-specific social signals and identification of predators (Dulac and Torello, 2003; Ben-Shaul et al., 2010; Kimchi et al., 2007; Stowers et al., 2002). Vomeronasal receptors (VRs) detect pheromonal cues emitted during social encounters, leading to the activation of distinct neural ensembles in the vomeronasal organ (VNO) (Dulac and Torello, 2003; Holy et al., 2000; Isogai et al., 2011). In turn, axons from VNO neurons expressing a given VR project to multiple glomeruli in the accessory olfactory bulb (AOB) (Belluscio et al., 1999; Rodriguez et al., 1999), where they form synaptic connections with AOB mitral/tufted cells, and AOB mitral cells form synapses within multiple glomeruli (Wagner et al., 2006). These anatomical features indicate that already in the AOB the circuitry may achieve a broad integration of chemical information.
How are pheromone signals represented downstream of the AOB? AOB mitral cells project primarily to the medial amygdala (MeA), which in turn connects to hypothalamic regions associated with the control of social behaviors (Keshavarzi et al., 2014). The MeA has been subdivided into distinct functional regions along the anterior-posterior and dorsal-ventral axes, with the medial amygdala posterodorsal (MeApd) primarily involved in conspecific social behaviors such as mating and aggression (Choi et al., 2005; Hong et al., 2014).
Electrical recordings in the MeApd of anesthetized mice have revealed sex-dependent differences in the neural responses to social cues (Bergan et al., 2014), while Fos induction following social interactions showed widely dispersed response patterns (Carvalho et al., 2015; Choi et al., 2005). How large neuronal ensembles represent social information in awake animals—and how this representation depends on the animal’s sex, physiological status, or previous social experience and hence modulates behavioral responses—is still not understood. Here, we used a head-mounted miniature microscope for long-term optical microendoscopy (Ziv et al., 2013) in deep brain tissue and monitored the Ca2+ activity of large neuronal ensembles across the MeApd during social encounters and over the span of several months. Our data reveal sex-specific differences in MeApd responses to social cues, as well as long-lasting, sex-specific changes in the neural representation of conspecifics following transient bouts of social and sexual experience, some of which are likely driven by the neuropeptide oxytocin.
RESULTS
Experimental Setup
We examined the responses of populations of neurons in the MeApd using fluorescence microendoscopy to image GCaMP6m-mediated calcium signals (Figures 1A and 1B; STAR Methods) (Ziv et al., 2013; Chen et al., 2013). We verified that the procedures of implanting microendoscopes had no detectable effects on normal behavioral patterns associated with social interactions (Figures S1A–S1C) and that responses were similar irrespective of the depth of the imaging plane (Figures S1D–S1H).
Figure 1. Imaging Social-Interaction-Evoked Neuronal Activity in the MeApd of Freely Behaving Mice.
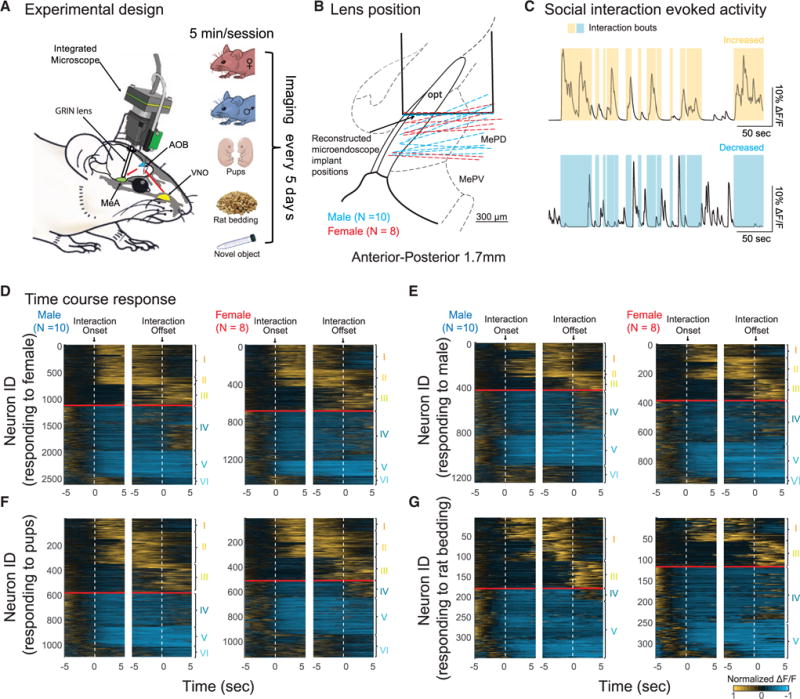
(A) Left: Schematic diagram of the experimental design for large-scale imaging of the MeApd in freely behaving mice using a miniature microscope. Right: Social recognition tasks: residential mice are each presented with five stimuli associated with distinct social and defensive behaviors: an adult female mouse, an adult male mouse, two pups (P0–P5), adult male rat-soiled bedding (predator cues), and a non-social object (centrifuge tube), respectively.
(B) Reconstructed positions of implanted lens aligned to the Allen Brain Atlas in males (blue dashed lines, N = 10) and females (red dashed lines, N = 8).
(C) Evoked activities in two example neurons. Time-locked increase (top) and decrease (bottom) of the ΔF/F calcium signal were observed in parallel with nasal contacts with social partners (yellow and blue shading, respectively).
(D–G) Temporal profiles of responses evoked by social stimuli. Normalized ΔF/F associated with the initiation (Interaction Onset) or termination (Interaction Offset) of social interactions with adult females (D), adult males (E), pups (F), and male rat-soiled bedding (G) in males (N = 10) and females (N = 8). The normalization of ΔF/F was performed to the largest response for each neuron. Distinct activity groups emerged based on K-means clustering (red line, segregation between two neuronal groups that are associated with increased [yellow] and decreased [cyan] activities during social interactions). Group I, IV, activity increase (I) or decrease (IV) during the entire episode of social interaction; group II, V, persistent increase (II) or decrease (V) during social contact that outlast the physical contact with the stimulus; group III, VI, activity increase (III) or decrease (VI) associated with the termination of social stimuli.
The MeApd comprises GABAergic and glutamatergic neurons at an approximate ratio of 2:1, with GABAergic neurons representing the major population of projection neurons driving social responses (Choi et al., 2005; Hong et al., 2014; Keshavarzi et al., 2014). We used genetic and viral strategies (STAR Methods) to quantify the proportions of GCaMP6-expressing GABAergic and glutamatergic neurons, respectively. The majority (71% ± 3%) of GCaMP6m-expressing neurons were vGAT+ neurons, whereas only a minority (2% ± 1%) were vGLUT+. The remaining GCaMP6m-expressing cells did not express mCherry in either Cre-driver line. These results indicate an enrichment of inhibitory cell types in GCaMP6-expressing MeApd neurons (Figures S1I–S1K).
Measurement of Neuronal Activity Evoked by Social Contact
Investigation of social signals by the VNO requires direct physical contact between the mouse snout and the source of cues, and adult mice engage in repeated nose-to-nose, nose-to-head, and nose-to-tail contacts prior to initiating attack or mating bouts. Similarly, interactions with pups, soiled rat bedding, and novel objects involve nasal contact and licking. We took video recordings of mice behaving freely in these behavioral contexts while imaging MeApd neural Ca2+ activity.
We assessed the responses of MeApd neurons by presenting mice with five basic stimuli associated with distinct social and defensive behaviors: adult female mice, adult male mice, a pair of pups (P0–P5), soiled bedding of an adult male rat as a predator cue, and a non-social object (centrifuge tube) as a control.
Dynamics of Neuronal Activity Triggered by Social Cues
On average, the activity of 203 ± 58 (mean ± SD) putative neurons was monitored simultaneously in each animal per imaging session, and our dataset comprises neural responses from 10 males and 8 females, for a total of 12 imaging sessions per animal.
The frequency and duration of social contacts displayed by freely behaving mice were highly variable. In some trials, social encounters were frequent and long lasting (>10 s), whereas in others they were occasional and brief (a few seconds) or displayed a mix of these features. Social stimuli could either increase or decrease neural activity during social contact (Figure 1C). Importantly, animal motion and position during social and non-social behaviors did not have any detectable effect on the dynamics of MeApd neurons (Figures S2A and S2B; STAR Methods), indicating that the observed MeApd cell activity mainly reflected the sensory representation of social stimuli.
To better assess the time-course of neuronal responses to social cues, while minimizing the coincidental influence of activities that may have been triggered by other events, we initially focused on social contact bouts lasting for at least 5 s and separated from adjacent investigation bouts by at least 5 s (STAR Methods). By statistical clustering of cells with similar activity patterns (STAR Methods), we identified six distinct activity groups characterized by either transient or persistent excitation or inhibition to specific stimuli (Figures 1D–1G). Interestingly, no neuronal subset in males or females displayed significant increase in activity that persisted after the end of the interaction with predator cues or showed decrease associated with the stimulus termination (Figure 1G).
Classification and Spatial Organization of Neuronal Responses to Social Cues
Our initial analysis of neuronal responses identified temporal patterns of activity associated with the chemosensory investigation of social cues. Next, we assessed the magnitude of the responses to different stimuli. Representative examples of neurons that were transiently activated by one or multiple stimuli during social interaction epochs are shown in Figure 2A, and the activity of all neurons imaged in one mouse during a one-day recording session are displayed in Figure 2B. These examples, and summary results from all animals across different days (Figure S3A), show that subsets of neurons were more active during interactions with particular stimuli, with unequal responses during different interaction epochs. Responses were significantly larger for certain cues over others (Figures 2C and S3A) and reliable across multiple epochs (Figures 2D and S3B; STAR Methods). These data suggest that MeApd neurons are selectively responsive to different social cues.
Figure 2. ΔF/F Responses to Different Social Stimuli.
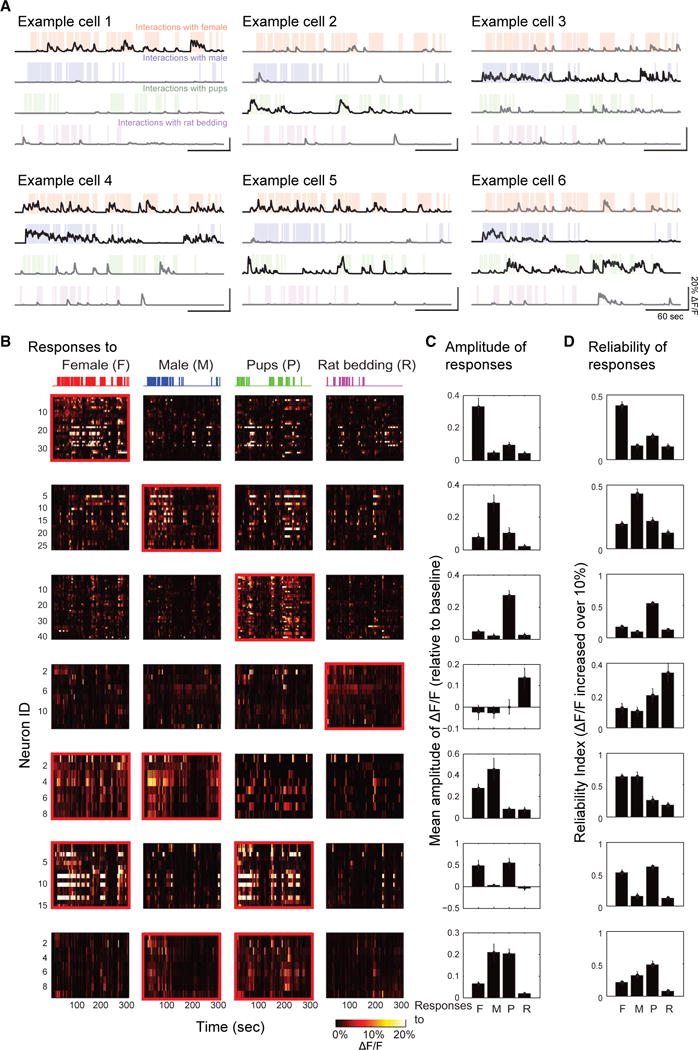
(A) Examples of neurons responsive to one stimulus (example cells 1, 2, 3) or multiple stimuli (example cells 4,5,6) in mice presented with adult female (red), adult male (blue), pups (green), and soiled bedding of adult male rat (magenta). Colored shadings represent occurrences of social interactions with each stimulus. Black traces represent neuronal activities that are temporally locked to contacts with the stimulus. Gray traces represent neuronal activities that are uncorrelated with behavioral contacts.
(B) ΔF/F amplitudes for different stimuli in all neurons with increased activity responding to at least one social stimulus (highlighted by red rectangular) in one mouse during a 1 day session. Colored bar graphs on top represent occurrences of social interactions with each stimulus.
(C and D) Mean response amplitudes in all epochs (C) and epoch-by-epoch reliabilities of mean DF/F increased above 10% (D) relative to baseline of different subsets of neurons responding to one stimulus or multiple stimuli (mean ± SEM).
Next, we quantified the neural tuning to particular social stimuli and compared the cell activity traces during and outside epochs of social contacts (Figures 3A and 3B). We defined the response strength (RS) that summarizes the sign and amplitude of the activity changes per neuron and per social stimulus (Figure 3B; STAR Methods). Calcium signals (DF/F) of responsive neurons were temporally locked to social stimuli (Figure 3C), with different stimulus selectivity (Figures S3C and S3D). We verified that the RS-score summarizes measures for both response strength and reliability (Figures 3D, 3E, and S3E–S3G) and used significant RS values to calculate signal strength for each neuron to a particular stimulus. Altogether, 87% ± 3% of the monitored cells showed significant RS values in response to at least one social stimulus, while the remaining 13% ± 3% showed spontaneous activity that was not temporally correlated with social contact.
Figure 3. Classification of Neuronal Responses to Social Stimuli.
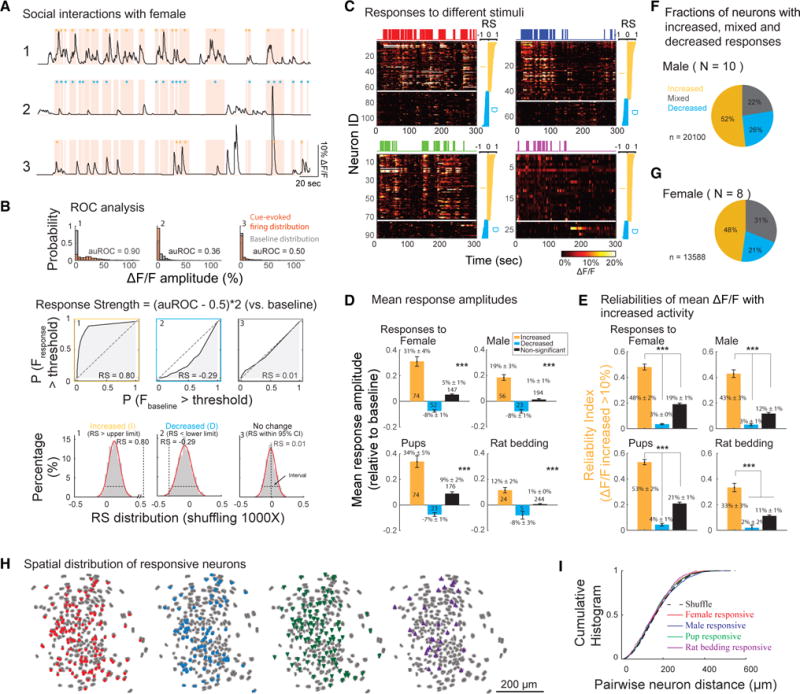
(A) Examples of neurons showing increased (yellow, #1), decreased (cyan, #2) or nonspecific (gray, #3) activity relative to baseline in parallel with nasal contacts with female intruder (red shadings). Colored stars represent the epochs with mean ΔF/F increased above 10% (yellow) or decreased above 5% (cyan) relative to baseline.
(B) ROC analysis. Top: Comparison of cue-evoked firing and baseline distribution of the examples shown in (A). Middle: Area under the receiver operating characteristic curve (auROC) in the examples shown in (A). Response strength (RS) was calculated as (auROC − 0.5) × 2 (ranging from −1 to 1). Bottom: RS distribution obtained from temporally shuffling of social stimulation 1,000 times (STAR Methods).
(C) ΔF/F signals of neurons classified as responsive to social stimuli, sorted by RS values evoked by a given social stimulus. I, increased from baseline (yellow); D, decreased from baseline (cyan).
(D) Mean response amplitudes in representative examples of all neurons with increased (yellow), decreased (cyan), or non-significantly changed activity (black) in one mouse during 1 day session (mean ± SEM, ***p < 0.001).
(E) Epoch-by-epoch reliabilities of mean ΔF/F increased above 10% relative to baseline in representative examples of all neurons in one mouse with increased (yellow), decreased (cyan), or non-significantly changed activity (black) during 1 day session (mean ± SEM, ***p < 0.001).
(F and G) Fractions of neurons in males ([F], N = 10) and females ([G], N = 8) with increase, decrease, or mixed responses to different social stimuli. n, number of neurons with significant responses to social stimuli in a total of 12 imaging sessions from all recorded males and females.
(H and I) Spatial distribution of responsive neurons. (H) Localization of neurons responsive to female (red), male (blue), pups (green), and rat-soiled bedding (magenta) cues displayed in the same field of view. (I) Cumulative histograms of pairwise neuronal distances within subgroups responsive to specific social cues (solid lines) and a subgroup in which cell identities were randomly shuffled (dashed line).
Are the responsive neurons selectively responding to a specific social stimulus, or are they tuned to multiple stimuli? To categorize cells according to their response type, we used the cells’ RS values evoked by the different stimuli. About half of the neurons (52% ± 2% in males; 48% ± 4% in females) responded to social stimuli with significant rises in activity, and 23% with activity declines (26% ± 2% in males; 21% ± 3% in females). The remaining neurons showed both increases and decreases in activity according to the social stimulus examined (22% ± 3% in males; 31% ± 2% in females) (Figures 3F and 3G). The fractions of cells displaying each type of response were similar in males and females, except for neurons with mixed (i.e., increased and decreased) responses, which were more abundant in females than in males (Figures 3F and 3G, p < 0.0001, χ2 test). The fractions of MeApd neurons responding to a given stimulus appeared significantly different in males and females (Figure S3H, χ2 test, p < 0.0001). Furthermore, the fractions of neurons responding to a given pair of social stimuli were significantly higher than the expected random overlap in responses, suggesting a preferential integration of social stimulus pairs (Figure S3I; STAR Methods).
Population imaging allowed us to examine the anatomical relationship of neurons according to their response type. The probability that nearest neighbor neurons had the same response type (for example, female-female, male-male) was statistically indistinguishable from that determined for shuffled datasets in which we randomly permuted the cells’ spatial locations (Figures 3H and 3I; p = 0.86). Thus, the neural representations of distinct social stimuli appear spatially intermingled in the MeApd, without any obvious anatomical clustering of functionally distinct cell ensembles.
Social Representation by Individual Neurons in the MeApd
How is the activity related to social stimuli distributed across all individual neurons in the MeApd? Our data show that 76% ± 11% of MeApd responsive neurons only respond to conspecific cues, 5% ± 1% only respond to predator cues, and 19% ± 5% respond to both types of stimuli (Figure 4A).
Figure 4. Characteristics of Social Representation in MeApd of Virgin Males and Females.
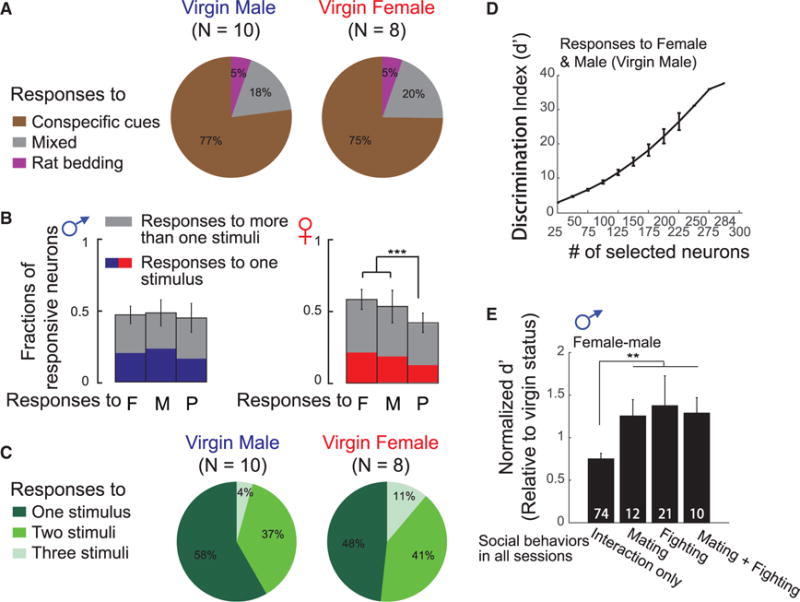
(A) Fractions of neurons responding to conspecific versus predator cues in the MeApd of virgin males (left, N = 10) and virgin females (right, N = 8).
(B) Fractions of neurons responding to various conspecific cues, female, male, and pup cues, in the MeApd of virgin males (left, N = 10) and virgin females (right, N = 8) (mean ± SD, ***p < 0.001).
(C) Tuning selectivity in responses to conspecific stimuli in the MeApd of virgin males (left, N = 10) and virgin females (right, N = 8).
(D) Discrimination index d′ derived from neuronal activities in response to female and male cues depending on the size of neuronal ensembles used in LDA in responses from a virgin male in 1 day session (mean ± SEM).
(E) Discrimination index d′ derived from neuronal activities evoked by female and male cues in residential males, in trials showing sex-related behaviors (fighting and mating) or only social contacts (mean ± SEM, **p < 0.01). Numbers on the graph: number of sessions in each group.
Interestingly, conspecific cues are encoded differently in virgin males and females. Over 80% of MeApd neurons encode conspecific and predator cues in freely behaving virgin mice. These responses appeared more evenly distributed among neuronal populations in virgin males (responses to female: 46% ± 6%; male: 48% ± 9%; pups: 44% ± 10%) compared with that in virgin females (responses to female: 58% ± 7%; male: 54% ± 11%; pups: 42% ± 7%) (Figure 4B, mean ± SD, rank-sum test), and broad selectivity for multiple stimulus features was also more frequent in virgin males than females (Figure 4C, mean ± SD, rank-sum test). However, individual neurons that are selectively responsive to particular social stimuli did not respond equally across different interaction epochs and sometimes failed to respond to certain epochs (Figures 3E and S3E). Therefore, we next asked whether population neurons could more accurately represent the type of social interaction.
Social Discrimination by Population Ensembles in the MeApd
Taking advantage of our simultaneous recording of large neuronal ensembles, we next investigated the coding principles by which social information is represented in the MeApd. Under conditions where single neurons are noisy and unreliable or when diverse stimulus features need to be integrated, population coding can be more effective (Averbeck et al., 2006). Here, we sought to identify basic properties of population activity enabling the best separation among responses to different social groups.
To classify different social responses by neural populations, we used a linear discriminant analysis (LDA) and calculated the distance between each response class by using a discrimination index, d′ (STAR Methods). The ensemble neural responses to pairs of social stimuli became more distinguishable as the size of the neural ensembles used in the LDA increased, and discrimination increased continuously and almost linearly (Figure 4D), indicating that social information is densely distributed in neuronal ensembles of the MeApd.
To understand the relative importance of population codes and single-cell labeled-line mode of sensory processing, we analyzed the correlation between the population neuronal responses and behavior during a 5 min trial. We first asked whether the discriminability between two social cues is associated with a behavioral difference. Second, we asked whether the initiation of these behaviors can directly influence the observed neuronal dynamics.
In the presence of a receptive female or an intruder male, some resident males only investigated the intruder during a 5 min trial, while the others additionally engaged in effective reproductive or defensive behavior according to the intruder’s sex. These results indicate that the latency of male-female effective identification leading to behavioral responses can be shorter in some trials than the others. To determine whether the representation by neuronal ensembles is indicative of the shorter latencies leading to behavioral responses, we compared the discrimination between population responses to male and female cues in the MeApd of animals that chose to fight or mate and in animals that did not fight or mate in a 5 min trial.
To determine whether the increased discriminability between female and male cues observed in trials with effective behavioral responses is related to the initiation of mating and fighting behaviors in host animals, we assessed the normalized D′ in trials with social behaviors or only social contacts (STAR Methods). The discriminability between female and male cues was significantly higher (i.e., displaying a 74% increase) in recording sessions displaying fighting and mating responses to intruders than those without these behaviors (Figure 4E), indicating that the increased discriminability between female and male cues is directly related to the initiation of mating and fighting behaviors in host animals.
To further explore whether mating or fighting could also induce changes in neuronal activity, we performed a Mahalanobis population vector distance (PVD) analysis (Grewe et al., 2017) and found that the difference in response to female and male cues after the initiation of mating/fighting decreases by 40% from the initial level (Figures S4C–S4F; STAR Methods). It is not significantly different from that observed in males without sex-related behaviors (decrease by 43%) in a given trial (Figures S4A and S4B; STAR Methods), which might result from sensory adaptation. Importantly, no significant difference was observed in the number of neurons responding to social cues and in the tuning selectivity and responsive strength between the two types of trials (Figures S4G–S4I). Thus, social information is more effectively represented by the dynamics of neuronal ensembles than by the activity of individual MeApd neurons alone. Further, mating and fighting do not appear directly responsible for changes in responses to males and females within a trial, while reciprocally, changes in social representation may be responsible for generating more effective reproductive and defensive behaviors.
Changes in Social Representation following Sexual Experience
Because an animal’s social and defensive behaviors are influenced by its past experience and physiological status, we next explored whether and how MeApd representations are modulated by social experience. We used our long-term access to neural population dynamics in freely behaving animals to examine how the MeApd encodes social cues over extended time periods (Movie S1). We imaged neurons in the same field of view every 5 days in both males and females across three successive social phases for a total duration of about 60 days: single housed and sexually inexperienced (for 15 days), co-housed with a partner of opposite sex (for 20 days), and single housed again (for around 25 days) until the end of the imaging series. To assess the respective roles of sexual experience versus mere exposure to sensory cues from the opposite sex, we co-housed a subgroup of virgin males with females using a cage divider, such that they were exposed to female cues during the co-housing period but had no sexual interaction (Figure 5A).
Figure 5. Modulation of Social Representation in Males and Females According to Social Context.
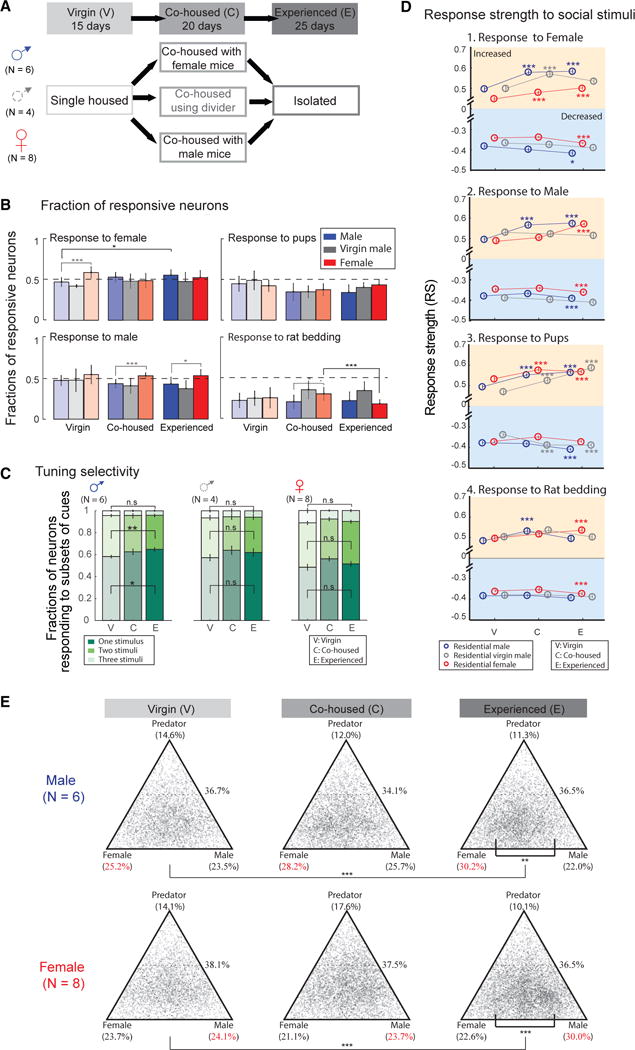
(A) Schematic diagram showing three successive social contexts: virgin state (V), co-housed (C), and single housed after social experience (E). All animals were recorded as single-housed virgins for 15 days then co-housed with an opposite sex partner for 20 days and single housed again for 25 days after social experience. A group of males (N = 4, middle) were co-housed but separated from a female partner using a cage divider during the second phase, allowing for limited social contact but no sexual experience.
(B) Fractions of neurons responding to female, male, pups, and rat bedding in males and females during different social contexts (mean ± SD, *p < 0.05, ***p < 0.001).
(C) Tuning selectivity in response to different subsets of conspecific stimuli in the MeApd of males (left), males without sexual experience (middle), and females (right) during different social contexts (mean ± SEM, *p < 0.05, **p < 0.01).
(D) Response strength (RS) to female (1), male (2), pups (3), and rat bedding (4) in males (blue), males without sexual experience (gray), and females (red) during different social contexts (mean ± SEM, *p < 0.05, **p < 0.01, ***p < 0.001).
(E) Selectivity of responses to female, male, and rat bedding cues for neurons recorded in males (top) and females (bottom) in virgin (left), co-housed (middle), and experienced (right) mice (**p < 0.01, ***p < 0.001).
Three parameters of the neural responses, introduced earlier, were independently quantified during each social phase: the fraction of neurons responding to a given stimulus (Figure 5B), the tuning selectivity (Figure 5C), and the response strength (Figure 5D).
We first compared the numbers of MeApd neurons responding to specific social stimuli in males versus females according to their social status (Figure S5A). In virgin males, similar fractions of neurons were sensitive to female (46% ± 6%), male (48% ± 6%), and pup cues (41% ± 8%), and the number of neurons responding to females was significantly smaller than that in virgin females (58% ± 7%) (Figure 5B, residential male, blue bars, mean ± SD). However, in mated males, the fraction of cells responding to female cues increased to a number similar to that of mated females (Figure 5B, responses to female cues in residential male changed from 46% ± 6% in virgin males to 53% ± 6% in co-housed males, mean ± SD), and this increase continued through the subsequent 30 days of social isolation from the female partner (Figure 5B, experienced males: 56% ± 7%, mean ± SD). In males prevented from sexual experience by a divider, there was no significant increase in the fraction of neurons sensitive to female cues during and after co-housing (Figure 5B, residential virgin male, gray bars), indicating an essential role of sexual experience in regulating social representation in males.
Importantly, the overall change in the proportion of neurons encoding female cues in sexually experienced males appears to be solely due to the increase in the percentage of neurons specifically encoding female cues, rather than being distributed across multiple stimuli with subtle changes in each category. The percentage of recorded neurons encoding contacts with a female intruder increases from 20% ± 2% in virgin males to 32% ± 6% after sexual experience, thus representing a >50% change in the number of neurons devoted to the specific coding of female cues (Figure S5B). As shown earlier, neuronal activity in the MeApd does not reflect motor patterns of animals during social interactions (Figures S2A and S2B). Therefore, although changes in social interaction patterns with females are detected after sexual experience (Figures S2C–S2E), it is unlikely that they contribute to the observed increase.
In sexually experienced females, the fractions of neurons responding to female and male cues was higher than that responding to pups and rat-soiled bedding, which is consistent with data from virgin females (Figure 5B, residential female, red bars). However, we observed a significant decrease in neurons responding to predator cues between co-housed and single-housed experienced females (from 30% ± 8% to 18% ± 5%, mean ± SD) (Figure 5B). All females in our study became pregnant during the co-housed status, and the observed decrease in the neural response to predator cues correlates well with reported changes in behavioral responses to stressful stimuli (i.e., predator bedding) of females during late pregnancy and at birth (Lonstein and Gammie, 2002) (Figures S2C–S2E). Interestingly, we also observed a preferential representation of male and predator cues in sexually experienced females compared to males, with more neurons responding to male (experienced males, 43% ± 9%; experienced females, 54% ± 8%, mean ± SD) and rat bedding (co-housed males, 20% ± 8%; co-housed females, 30 ± 8%, mean ± SD) in mated females than in mated males (Figure 5B).
In virgin mice, 58% ± 6% (mean ± SD) of the recorded MeApd neurons responded to more than one social stimulus, suggesting the existence of significant signal integration at this level of the VNO pathway compared to the initial narrow tuning demonstrated in most VRs (Isogai et al., 2011) (Figure 4C). In males, social behaviors such as mating and fighting are more efficiently elicited after sexual experience, indicating an improvement of conspecific recognition. Here, we examined whether the selectivity of conspecific cues in the MeApd is also regulated by sexual experience. Indeed, a larger fraction of neurons were selectively activated by a single social stimulus in sexually experienced males compared to virgin males (Figure 5C, left, response to one stimulus: virgin, 58% ± 6%; experienced, 65% ± 8%, p = 0.0026, mean ± SD). No significant difference in response selectivity was observed in control males separated from females by a divider (Figure 5C, middle) or in females throughout various social phases (Figure 5C, right). Therefore, the fraction of cells in males responding specifically to female cues rose significantly after co-housing with a mating partner, and sexual experience was essential for the long-term maintenance of these changes.
We next examined potential changes in the strength of responses to the various social cues. In both males and females, the RS to female and male stimuli rose significantly during and after sexual experience, and these changes were maintained for at least 3 weeks after social isolation. Such plasticity was less pronounced in control males separated from females by a divider, except for a transient increase in response to female stimuli during the co-housing phase (Figure 5D). The response magnitude (DF/F) changes relative to baseline in different social states were also consistent with changes in RS values (Figures 5D and S5C). Thus, our data consistently uncover the essential role of sexual experience in stably enhancing neuronal responses to female and male cues in the MeApd.
Neuronal responses to pups also rose significantly in males and females after sexual experience, as well as in virgin males co-housed but physically separated from a female partner, suggesting that exposure to female cues rather than sexual contact is sufficient for neuronal plasticity in responses to pups. Importantly, the RS and the mean response amplitude to predator cues was relatively stable throughout different social phases, indicating that the observed differences in neuronal responses to conspecific stimuli are not due to a global increase in calcium responses over the time series.
To understand which changes can account for the increase of fraction of neurons selectively responsive to one particular stimulus in males after sexual experience (Figure 5C), we plotted the RS of all neurons on a triangular axis for which the position of each point indicates the relative response strength to different stimuli (STAR Methods). The selectivity for social cues originating from animals of the opposite-sex increased in sexually experienced males (Figures 5E and S5D) and females (Figures 5E and S5F). Moreover, differences between response strength to female and male increased in both experienced males and experienced females compared with that in virgin state (Figures S5G and S5H). However, such change was not observed in virgin males co-housed but physically separated from a female partner (Figure S5E), indicating that sexual experience selectively enhances the representation of social cues originating from animals of the opposite-sex.
Sexual Experience-Dependent Modulation at the Neuronal Population Level
How does social discrimination change with sexual experience at the population level? Different animals and recording sessions contain varying numbers of neurons, which strongly influences the discriminability (Figure 4D). Thus, to compare across sexual experience we needed to randomly select the same number of neurons across different experience states. This selection does not affect the conclusion because trends in d′ across sessions appear similar irrespective of the size of the neuronal population considered (Figure 6A). Following sexual experience, a gradual segregation is observed between neuronal activities evoked by different social stimuli in both males (Figure S6A) and females (Figure S6B).
Figure 6. Analysis of the Modulation of Social Discrimination by Social Experience at the Neuronal Population Level.
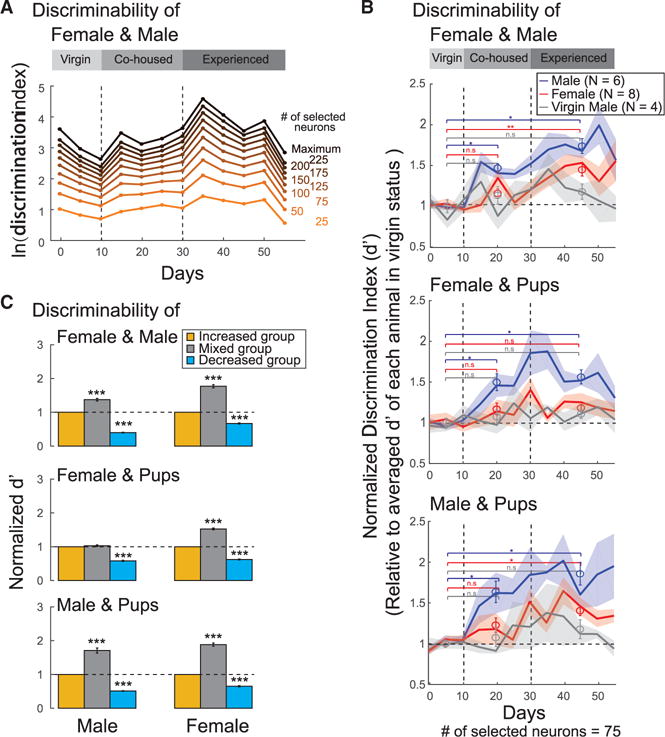
(A) An example case showing changes in discriminability of female and male cues over time, calculated from the activities of randomly selected neuronal ensembles with different sizes.
(B) Time course of discriminability of female/male (upper), female/pups (middle), and male/pups (bottom) in males (blue), males without sexual experience (gray), and females (red) during different social contexts. The discrimination index d′ was calculated from 75 neurons selected randomly and sampled randomly 1,000 times in each daily trial and then normalized to the mean value of d′ in the virgin status (mean ± SEM, *p < 0.05; **p < 0.01).
(C) Social discriminability calculated from the activity of neuronal ensembles with significant increase (yellow), decrease (cyan), or mixed responses (gray) in males (left, N = 10) and females (right, N = 8). All discrimination index d′ were calculated from a fixed number of neurons selected randomly in each subgroup and then normalized to the d′ of the group with increased activity (mean ± SEM, ***p < 0.001).
To further examine changes in the ensemble representation of males and females, we performed an LDA-based d′ analysis among responses to different conspecific cues. In males, the normalized d′ between responses to female/male, female/ pups, and male/pups were significantly increased (by 74%, 56%, and 86%, respectively) after co-housing with female partner (Figure 6B, blue), which was not observed in virgin males (Figure 6B, gray). The increased discriminability between female and other conspecific cues is partially consistent with our previous findings of an increase in the fraction of neurons responding to female cues (Figure 5B), as well as an increase of RS (Figure 5C) and selectivity (Figure 5E) to such cues after sexual experience. Although our data revealed that the numbers of neurons responding to male and pup cues were not changed after sexual experience (Figure 5C), the discrimination between these cues was increased at the population level, which may relate to the increase of response strength to both stimuli in all individualized neurons (Figure 5B). These results further demonstrated an enhanced sensitivity of detecting social difference using population codes than individual neuron alone in the MeApd.
Similarly, in sexually experienced females, we observed an enhancement of social discrimination between male and the other two conspecific cues including female (45% increase) and pup (40% increase), which was observed only at population level. However, no such difference was observed in female/pup discrimination, indicating that the role of sexual experience in regulating social discrimination in the MeApd is different in males and females (Figure 6B, red).
Importantly, variables associated with changes in behavioral patterns did not contribute significantly to the discriminability among responses to conspecific cues (Figure S2F; STAR Methods). These data further support the notion that the observed increase in discriminative power in sexually experienced animals is associated with changes in sexual experience rather than in patterns of social interaction.
We previously showed that some neurons respond to social stimuli with significant increase in activity, some with significant decrease, whereas others displayed mixed increase and decrease responses accordingly to the stimulus considered (Figures 3F and 3G). Here, neuronal subgroups showing increased, decreased, and mixed responses appear not to simply code information in different directions. Among all neurons responding to at least one of the examined social stimuli, the mixed group shows significantly higher discriminability (d′) between female-male and male-pup cues in males, as well as discriminability among female, male, and pup cues in females. We hypothesize that neurons with mixed selectivity can amplify the difference of responses to a particular set of stimuli, thus providing better discrimination to different social cues at the population level. Moreover, in both males and females, the group with decreased activity shows significantly lower performance in discriminability compared with the other two subgroups (Figure 6C). These results indicate that distinct neuronal subgroups in the MeApd may have different contributions to the discriminability of social stimuli.
The analysis above focused on the discriminability of neural population responses when representing distinct social stimuli. To assess more directly how much information about the type of social interaction is pertinent to the activity of MeApd neurons, we evaluated how well the population activity can predict whether a particular social stimulus is present (STAR Methods). We found that the population activity can predict each type of social interaction with high fidelity (Figures S6C–S6E).
To understand whether prediction accuracy of social interaction can be regulated by sexual experience, we measured the prediction accuracy in different animals (Figure S6E). In males, decoding accuracy of social interaction with female and male was increased by 14% and 8%, respectively, in sexually experienced animals. However, no such difference was observed in females before and after sexual experience. Interestingly, the performance of predicting social interactions with female and male intruders was significantly decreased by 23% and 8%, respectively, in residential females while co-housed with male, which is associated with a decrease in total time of contact (Figure S2C) and in the mean duration of each interaction epoch (Figure S2D) with female and male partner during co-housing. Since female mice become pregnant while co-housed with males, the decrease in social contact and prediction accuracy of the type of social signals is likely a reflection of the well-known suppression of interest by pregnant females toward adult conspecifics (Caroom and Bronson, 1971).
Social Discrimination Regulated by Oxytocin
The neuropeptide oxytocin (OT) is implicated in the modulation of many social responses (Ross and Young, 2009; Insel and Hulihan, 1995; Ferguson et al., 2001; Dölen et al., 2013). To examine the potential influence of OT on MeApd neuronal activity, we used RNAscope and demonstrated OXTR expression in the MeApd of males and females (Figures S7A–S7D). Since the majority of the neurons recorded in our study are vGAT+, we asked whether OT could directly affect this particular neuronal subset. Indeed, 73% ± 3% of OXTR-expressing neurons in the MeApd are vGAT+ neurons, whereas 16% ± 1% are vGlut2+ (Figure S7C), with no significant difference observed between males and females (data not shown). These results indicate that OT may indeed directly affect GABAergic neurons in the MeApd and thus alter the social representation by these neurons.
Next, we performed intraperitoneal injections of either saline or the oxytocin receptor antagonist (OTR-A) in sexually experienced, single-housed males and females. We observed no significant change of spontaneous activity following injection of OTR-A in either males or females (Figures S7E and S7F). As in previous analysis (Figure 5), we examined the population discrimination index (d′) toward conspecific intruders, with and without OTR-A. Interestingly, we noticed that changes observed in the population responses to conspecific cues in animals that had been co-housed and subsequently isolated were stably maintained for up to 2 months in both males and females (Figure 7A). However, when treated with OTR-A, sexually experienced males showed a steep decrease in discrimination of female and male cues, though it remained higher than that in virgin males (Figure 7A).
Figure 7. Social Discrimination between Male and Female Cues in Males Is Suppressed by Oxytocin Receptor Antagonist.
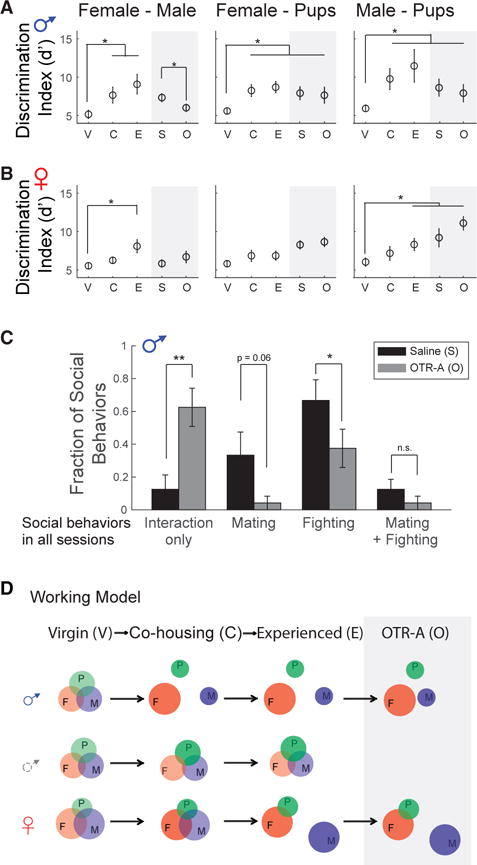
(A and B) Average discriminability of female/male, female/pups, and male/ pups in males ([A], N = 6) and females ([B], N = 8) during different social contexts. V, virgin; C, co-housed; E, experienced; S, injected with saline; O, injected with oxytocin receptor antagonist (OTR-A), L-368,899 hydrochloride (5 mg kg −1). Social behaviors are tested 30 min after i.p. injection of OTR-A (*p < 0.05). The discrimination index d′ was calculated from 75 neurons selected randomly and sampled randomly 1,000 times in each daily trial and then normalized to the mean value of d′ in the virgin status (mean ± SEM, *p < 0.05).
(C) Fractions of males displaying fighting and mating behaviors when injected with saline or OTR-A (N = 6, mean ± SEM, *p < 0.05, **p < 0.01).
(D) Working model. Representations of conspecifics in the MeApd are regulated by social experience in a sex-specific manner.
By contrast, no difference was observed in the discrimination abilities of OTR-A-treated experienced females compared to control (Figure 7B), demonstrating that the effects of OT in regulating female-male discrimination is different in males and females. We did not observe any significant change in the total contact time with different social-stimulus features after treatment with OTR-A (Figure S7G). In previous results, we observed that a high discrimination between male and female cues was associated with increased effectiveness in generating reproductive and defensive behaviors during the 5 min trial (Figure 4E). Consistent with this finding, we observed that the probability of displaying fighting and mating responses was significantly lower in animals treated with OTR-A (Figure 7C). We also examined the number of neurons, tuning selectivity and response strength of individual neurons responding to the examined social-stimulus features. No significant change in those parameters was observed in sexually experienced males and females between saline and OTR-A-injected groups (Figures S7H–S7J). Therefore, we concluded that OT is involved in the lasting changes observed in males in the representation of social information in the MeA following sexual experience.
DISCUSSION
Information about animal cues is detected in the VNO and processed in the MeA, a central hub in the rodent’s social brain network, resulting in the activation of specialized downstream hypothalamic circuits. Here, we investigate the neural coding of conspecific, pup, and predator cues in the MeA of behaving mice. We found that MeA neurons can be selectively excited or inhibited by social cues and that information about these events is present in some individual neurons but is significantly more robust and reliable at the population level. This information is represented differentially in males versus females and is shaped by sexual experience and by OT in males. Our findings uncover the significant role of social experience and neuromodulator systems in eliciting long-term changes in neural circuitry and behaviors. Finally, the characterization of neural codes in a deep brain region with cellular resolution demonstrates how microendoscopy-based functional imaging can help dissect the neural bases of behavior.
Representation of Natural Social Stimuli in the MeA
VNO neurons expressing a given VR project to multiple and spatially distributed glomeruli in the AOB, while AOB output neurons send dendrites to multiple glomeruli (Belluscio et al., 1999; Dulac and Torello, 2003; Wagner et al., 2006). This organization suggests that an important transformation of sensory information occurs in the AOB, from a segregated sampling system in the VNO to more integrated codes in the AOB (Luo et al., 2003; Meeks et al., 2010). In turn, the AOB sends major projections to the MeA (Mohedano-Moriano et al., 2007), and the activation of MeA neurons is highly dependent on VNO-mediated detection of pheromones, confirming a primary role in sensory processing of VNO information (Carvalho et al., 2015). Indeed, our imaging of the MeA in awake behaving mice detects significant and sustained activity changes in individual neurons in response to conspecific and predator cues (Figure 1). Moreover, the population responses are correlated with social interactions epochs with high fidelity, highlighting the central role of MeA neurons in processing VNO sensory inputs.
Our study shows that the fractions of neurons responsive to specific conspecific cues is different in the MeA of virgin males and females, demonstrating sex differences in the representation of social cues. Remarkably, the MeA representation seen in virgin animals is transformed by mating, as we see a pronounced and long-lasting preferential responsiveness to opposite-sex odors emerging in both males and females following a transient period of sexual experience but not in animals cohabitating without sexual experience.
Imaging large neuronal populations in the MeA enabled us to specifically assess how MeA neurons interpret the identity of natural social stimuli and document the activation by each stimulus of large neuronal subsets distributed across the MeA. Such distributed non-topographic representation of each stimulus type mirrors the distributed organization in the AOB (Belluscio et al., 1999; Rodriguez et al., 1999; Wagner et al., 2006) and suggests that information sorting may further be accomplished through selective projection to downstream regions.
Our data show that MeA neurons can be selectively excited or inhibited in response to specific social stimuli. We propose that such selective excitation and inhibition is a major feature of the tuning of individual MeA neurons. Indeed, in contrast to the odor-specific excitation and the widespread and broadly tuned inhibition described in the olfactory cortex (Poo and Isaacson, 2009), the pheromone-evoked inhibition observed in the MeA appears stimulus-specific. Intriguingly, selective inhibition also shapes social discrimination in the AOB (Luo et al., 2003; Meeks et al., 2010). We speculate that such difference in activity patterns between main olfactory and accessory olfactory systems may reflect a fundamental difference between learned and instinctive chemosignal processing (Stettler and Axel, 2009). Thus, unlike in the olfactory cortex, MeA responses are not imposed by experience but are instead configured by stereotyped combinatorial input received by MeA neurons to sort categorical information of natural stimuli from mixed inputs (Figure S3J).
How are different social stimuli represented in the brain? Although sensory organization at the receptor level may support a model in which parallel neural pathways control distinct behaviors (Chamero et al., 2007; Haga et al., 2010; Papes et al., 2010), this view does not fully represent the organization in the MeA. One implication of this observation is that the identities of different social cues are likely to be represented by unique but overlapping ensembles of active neurons in addition to distinct neuronal subsets. Our population-level analysis indicates that complementary information is carried by neuronal ensembles during social discrimination (Figure 4D). These results support the unexpected role of population coding in information processing underlying instinctive behaviors. Similar observation was also recently made in the posterolateral cortical amygdala, which mediates innate olfactory responses (Iurilli and Datta, 2017). Considering the heterogeneous response properties and selective targeting of MeA neurons, we speculate that categorical social information may be differentially processed in distinct MeA neuronal subgroups based on their targets and further interpreted by neurons in downstream regions.
Experience-Dependent Social Representation in Males and Females
The importance of internal states on sensory processing has been recognized in many sensory modalities. Here, we find that the responsiveness, selective tuning, and number of neurons in the MeA responding to a given natural stimulus are profoundly shaped by social experience, in particular sexual experience. Intriguingly, such experience-dependent plasticity preferentially enhances the discrimination of social cues from the opposite sex in both males and females, and this change persists and even further develops in both males and females for at least 1 month after the animal is separated from its mating partner.
The discrimination between pups and conspecific adults is also partially enhanced, though to a lesser extent, in sexually experienced animals, especially males. We also observed that the number of neurons responsive to rat-soiled bedding was significantly reduced in sexually experienced female during and after pregnancy. In light of the particular relevance of sexual behaviors in fulfilling primitive reproductive needs (Caroom and Bronson 1971), in regulating transitions of parental behaviors in mice (Tachikawa et al., 2013; Wu et al., 2014), and in regulating responses to stress in pregnant females (Lonstein and Gammie., 2002), we posit that the processing of social information can be largely regulated by internal state to integrate motivational drive with basic sensory encoding.
How does sexual experience regulate sensory coding in the MeA? The display of social behaviors is globally controlled by sex hormones and neuromodulators (Lim and Young, 2006; Yang and Shah, 2014) whose level is modulated by sexual experience (Ross and Young, 2009; Wu and Gore, 2009). One possible mechanism is to alter sensory inputs to the MeA, at the levels of the VNO and AOB. Indeed, a number of studies have shown that responses of VNO sensory neurons can be modulated by hormones, internal status, and sensory experience in a sex-specific manner (Dey et al., 2015; Halem et al., 2001; Tachikawa et al., 2013; Xu et al., 2016). At the level of the accessory olfactory bulb, mating causes a lasting increase in baseline activity by selective regulation of local inhibition (Binns and Brennan, 2005). Furthermore, recent work shows that adult neurogenesis in the AOB can be regulated by sex hormones, suggesting another mechanism by which sexual experience can regulate early sensory processing (Schellino et al., 2016).
MeA neurons express key hormone and neuromodulatory receptors (Unger et al., 2015; Wu and Gore, 2009; Zaldivar and Krichmar, 2013) and sex hormone-dependent genes (Xu et al., 2012), suggesting that substantial modulation of MeA activity occurs locally. Here, we found that selectively in male mice, the population discrimination between female and male cues at the MeA level can be regulated by oxytocin. OT regulates neuronal activities in multiple neural circuits, such as sensory cortices (Marlin et al., 2015), nucleus accumbens (Dölen et al., 2013), and prefrontal cortex (Nakajima et al., 2014). Considering the expression of OXTR in the MeApd, and its role in social and sexual recognition (Ferguson et al., 2001; Yao et al., 2017), plasticity may be also directly derived from the regulation of local circuitry in the MeA. Thus, a direct modulation on MeA circuitry, in addition to that of sensory input may provide an efficient regulation of social responses.
Long-term microendoscopy imaging in the MeA, a key hub of the sensory-motor transformation from chemosensory cues to instinctive behaviors, has enabled us to address two fundamental questions on how neural circuitries underlie behavior control: what is the nature of the neural codes that provide the brain with an internal representation of social information, and to what extent does individual experience change these codes in the short or long term? The identification of basic organization principles by which social features are represented in the MeA provides a general scheme to understand how behaviorally relevant information is represented in the brain, which neural strategies are used to shape coding specificity, and how neural codes are regulated by previous experience and internal status in awake behaving animals.
STAR★METHODS
KEY RESOURCES TABLE
| REAGENT or RESOURCE | SOURCE | IDENTIFIER |
|---|---|---|
| Bacterial and Virus Strains | ||
| AAV5.CaMKIIα.GCaMP6m | Grewe et al., 2017 | N/A |
| AAV5. EF1α. Flex. mCherry | Penn Vector Core | N/A |
| Chemicals, Peptides, and Recombinant Proteins | ||
| L-368,899 hydrochloride | TOCRIS | 26-411-0 |
| Critical Commercial Assays | ||
| RNAscope Fluorescent Multiplex Reagent Kit | Advanced Cell Diagnostics | 320850 |
| RNAscope probe Mm-Slc32a1 | Advanced Cell Diagnostics | 319191 |
| RNAscope Probe Mm-Slc17a6-C2 | Advanced Cell Diagnostics | 319171-C2 |
| RNAscope Probe Mm-Oxtr-C3 | Advanced Cell Diagnostics | 402651-C3 |
| Experimental Models: Organisms/Strains | ||
| Mouse: wild type C57BL/6J | Jackson Laboratory | JAX:000664 |
| Mouse: Vgat-ires-Cre | Watabe-Uchida et al., 2012 | N/A |
| Mouse: Vglut2-ires-Cre | Krashes et al., 2014 | N/A |
| Software and Algorithms | ||
| ImageJ | NIH | https://imagej.nih.gov/ij/ |
| Cellprofiler | Broad Institute | http://cellprofiler.org/ |
| MATLAB | MathWorks | https://www.mathworks.com/products/matlab.html |
| Ca2+ signal acquision | nVista | https://www.inscopix.com/ |
| Cellsort MATLAB algorithm for extracting cellular Ca2+ signals | Ziv et al., 2013 | N/A |
| Registration of cell identities across imaging sessions | Grewe et al., 2017 | N/A |
| Fast nonnegative deconvolution | Vogelstein et al., 2010 | N/A |
| Other | ||
| 0.85-mm custom GRIN lens | Grintech | http://www.grintech.de/ |
| Miniatureized microscope camera | Inscopix | https://www.inscopix.com/ |
CONTACT FOR REAGENT AND RESOURCE SHARING
Further information and requests for resources and reagents should be directed to and will be fulfilled by the Lead Contact, Catherine Dulac (dulac@fas.harvard.edu).
EXPERIMENTAL MODEL AND SUBJECT DETAILS
Animals were maintained on 12 h:12h light/dark cycle (lighted hours: 02:00–14:00) with food and water available ad libitum. Animal care and experiments were carried out in accordance with the NIH guidelines and approved by the Harvard University Institutional Animal Care and Use Committee (IACUC). C57BL6/J mice were ordered from Jackson Labs (8–9 weeks old). Prior to behavioral experiments, mice were individually housed for > 21 days. Heterozygous mouse mutants expressing Cre recombinase under the control of the Vgat gene (Vgat-ires-Cre) (Watabe-Uchida et al., 2012), and the Vglut2 gene (Vglut2-ires-Cre) (Krashes et al., 2014) were used.
METHOD DETAILS
Viral injections and GRIN lens implantation
To assess the cell identity of GCaMP6m expressing cells, we performed control experiments in which we co-injected a Cre-dependent reporter virus (AAV2/5-EF1α-Flex-mCherry) and the AAV2/5-CamKIIα-GCaMP6m virus into the MeApd of either vGATCre/+ or vGLUT2Cre/+ mice. Co-injections of 400nl AAV2/5- CaMKIIα -GCaMP6m virus (2 × 10¹² particles/ml) and 400nl AAV2/5 carrying an inverted mCherry flanked by double loxP sites (AAV2/5- loxP –mCherry, 4 × 10¹² particles/ml) were performed in Vgat-ires-Cre and Vglut2-ires-Cre transgenic mice (Figures S1I–S1K).
Our preparation for long-term imaging in the mouse MeApd combined viral expression of the Ca2+ indicator GCaMP6m under the control of the Calcium/calmodulin-dependent protein kinase II α (CamKIIα) promoter (AAV2/5-CaMKIIa-GCaMP6m) (Chen et al., 2013), chronic implantation of the microendoscope in the MeApd, and permanent attachment of the microscope base plate to the cranium (Figure 1A). To image neuronal activity in the MeApd, we stereotaxically injected 400–600 nL of AAV2/5-CamKIIa-GCaMP6m (2 × 10¹² particles/ml) expressing the genetically encoded Ca2+ indicator GCaMP6m under the control of the Calcium/calmodulin-dependent protein kinase II α (CamKIIα) promoter (Chen et al., 2013) (Figures S1I–S1K). 14 days after viral injection, we implanted an optical guide cannula into the MeApd (Figure 1A), and positioned an optical guide cannula (1.0 mm diameter, 6.2 mm length) with a custom polished glass coverslip attached to one end (#0 coverslip, Electron Microscopy Science). To ensure that the whole implant is stably maintained on the skull for several months, we attached two bone screws onto regions above the olfactory bulb and cerebellum. Next, we opened a 1.2 mm craniotomy window centered around the virus injection site of the first surgery. Using a customized trephine (diameter 1 mm), we gently cut through the brain tissue to a depth of 5.0 mm relative from bregma, and slowly aspirated the brain tissue in the trephine. Next, we lowered down the steel guide tube to 5.2 mm from bregma and fixed it to the skull using ultraviolet illumination curable glue (Loctite 4305). After drying out the skull, we applied Metabond (Parkell) onto the exposed region and another layer of dental acrylic cement (Coltene, Whaledent) in the end.
The positions of all implanted microendoscopes were systematically assessed through posthoc histological inspection, and were only included for further analysis in mice in which the MeApd was correctly targeted based on the reconstructed positions of the microendoscopes aligned to the Allen Brain Atlas (Figure 1B).
The recovery of mice lasted a minimum of 5 days, and clearance of the imaging window took 4–7 weeks. In order to check whether the quality of the window was sufficient for further imaging, customized GRIN lens (0.85 mm diameter, 6.88 mm length, object side: working distance 365 μm in air @ 530nm, NA 0.46; image side: working distance 135 μm in air @ 530nm, NA 0.5, Grintech GmbH) were inserted into the guide tube, and expression of GCaMP6m was checked using a miniature integrated microscope (Inscopix).
Animal behavior
Experimental animals were singly housed at least three weeks before exposure to different social intruders in their home cage. Five different intruders including an adult female mouse, an adult male mouse, a pair of pups (p0-p5), male rat soiled bedding and a centrifuge tube were randomly introduced to the cage of the residential mice for 5-min with a 10-min interval between stimuli. Video recordings time-locked with the integrated microscope based GCaMP imaging were collected during the trials.
Animal exposures to the different stimuli were repeated every five days for about two months. We imaged 10 males and 8 females. All the mice were imaged in a ‘Virgin’ state for 15–20 days before being cohoused with a mating partner. During the ‘Co-housing’ state, males were subdivided into two groups, allowing or not allowing sexual experience with their respective female partner, respectively. Mice were kept in ‘Co-housed’ state for 20–30 days, which is about the duration of female pregnancy. In a subsequent ‘Experienced’ state, the residential mouse was single-housed again for another 20–35 days.
To understand whether the tissue damage affects the normal display of social behaviors, we examined the patterns of social interactions in 7 virgin males and 7 virgin females without microendoscope implantation, and compared them to implanted animals. These mice were single-housed for three weeks before the behavioral test. Animal behaviors were recorded every five days for 15 days.
To examine how oxytocin may regulate social recognition, we treated the previously imaged mice (5–7 months, sexually experienced) with either intraperitoneal saline (500 μl) or intraperitoneal OTR-A: L-368,899 hydrochloride (5 mg kg−1 diluted in 500 μL saline) every five days. The above mentioned behavioral recordings time-locked with the integrated microscope based GCaMP imaging were collected 30 mins after IP injection. Each mouse was treated with three replicates of saline and OTR-A in 25 days (6 sessions) in a random order.
Calcium imaging using the integrated microscope
In order to check the imaging window after surgery, the integrated microscope (nVista HD, Inscopix) was lowered down above the GRIN lens until a sharp image was obtained from the back focal plane. In experimental animals displaying clean imaging window with many spontaneously active neurons, the integrated microscopes were mounted on the skull of the mice with a base plate.
In order to do so, a microscope baseplate (V2, Inscopix) was attached to the microscope and we lowered down the microscope until finding the sharpest view. A 600 μm × 600 μm field-of- view (FOV) was then chosen to include the largest number of responsive neurons. After setting the relative position of the microscope and the GRIN lens, we applied both blue-light curable glue (Flow-it, Pentron) and ultraviolet illumination curable glue (Loctite 4305) to secure the baseplate on the skull. After all these procedures, we detached the integrated microscope from the baseplate, covered with baseplate cover (V2, Inscopix) and returned the animals to their home cage.
Before each experimental session, we reattached the integrated microscope to the baseplate, and tried to find the same previous imaging focus by looking for some obvious landmarks, such as blood vessels and axon fibers. Mice were returned to their home cage in dark for at least 30 min before starting the imaging session. We used the data acquisition software (nVista, Inscopix) to acquire 12-bit images in a 1000 × 1000 pixel format (0.6 μm/pixel). Imaging acquisition was triggered by behavioral video acquisition in MATLAB at a 20 Hz frequency. We used a range of 8%–18% of LED intensity, Gain 2–5.
Behavioral data analysis
Social interactions
We manually scored nasal contacts between animals carrying the miniature microscope and social partners or test objects.
Locomotor tracking
We tracked the spatial trajectories of mice, as they interacted with pups, rat soiled bedding, and a centrifuge tube in the home cage, by using computational image processing to determine the centroid coordinates of the mouse’s body in each image frame of the behavioral video. For this analysis we used custom algorithms written in the ImageJ (NIH) and MATLAB (Mathworks) programming environments.
In the behavioral videos, the mouse was substantially darker than the background environment. To segment the mouse from the background, in ImageJ we first binarized each frame of the video, by re-assigning all pixels with intensity values above a minimum threshold to one (white) and all pixels with intensity values below this threshold to zero (black). We chose the threshold for each video such that the binarization well delineated the perimeter of the mouse against the brighter pixels of the arena. To remove any extraneous pixels outside the mouse that had also been binarized to black, we performed a single round of erosion in which we re-assigned to white any black pixels that did not have all eight of its neighboring pixels also set to black (i.e., within the 3 × 3 pixel area centered on the pixel in question). To reduce fine spatial fluctuations in the computational determination of the mouse’s locomotor trajectory, we then performed a spatial smoothing of the binarized image of the mouse by performing three rounds of dilation. In each dilation round, we set any pixels to black that had at least one black neighboring pixel within the 3 × 3 pixel area centered on the pixel in question.
We then used the particle-tracking algorithm in ImageJ (ParticleAnalyzer.java) to identify the locations of the spatially contiguous sets of black pixels that contained 100–20,000 pixels. We then used custom code written in MATLAB to identify and retain for each image frame only the largest of these black pixel sets, which we interpreted as the mouse. If there were any video frames for which the particle tracker had identified no contiguous sets of black pixels (for example if the mouse was obscured or exited the portion of the arena under video surveillance) we denoted that frame as lacking an image of the mouse. Using the computationally determined trajectories of mouse movement, we computed for each image frame the position of the mouse in the arena and its velocity vector.
To validate that this routine accurately tracked mouse locomotor trajectories, we confirmed by eye for a subset of the behavioral videos that the computationally determined centroid coordinates of the mouse accurately followed the mouse’s movements. In general, the computationally estimated trajectory well matched the mouse’s apparent trajectory as seen in the raw video.
Processing of imaging data
Pre-processing
To normalize the image frames acquired from the integrated microscope, all the frames were divided by a Fast Fourier Transformation (FFT) spatially band-pass filter in ImageJ (U.S. National Institutes of Health, lower bound 120 μm, upper bound 10 μm). Then we applied frame-by-frame TurboReg to correct motion induced artifacts across all the frames acquired in daily session exposed to all stimuli. In order to get a better imaging contrast, we cropped out 4% of the surrounding black border after registration. We temporally down-sampled the whole imaging movie to 5 Hz (average every four frames) and applied ΔF/F across all the frames, where F is the mean image from the entire movie.
Cell sorting
Here we used the reported automated ROI detection algorithm based on principal and independent component analysis (PCA/ICA) to extract neuronal patches (Ziv et al., 2013). We manually removed the patches unlikely to represent neuronal soma and applied all the extracted ROIs to the entire movie and get the ΔF/F traces.
Image registration across different sessions
In order to align cells maps acquired from different daily sessions, we used a reported map registration algorithm to achieve the maximum alignment and also a qualitative idea about the similarity of imaged neuronal ensembles on the same animal across days (Grewe et al., 2017). First, we projected the ROI of each neuron onto a maximum projection image. Then, we aligned all the cell maps to the previous cell-map using TurboReg image registration algorithm. We used the centroid distance between two cells as the criteria of determining whether they are from spatially similar cell patches. Here we used the 6 μm between the centroids of two cells as the threshold. Using the foregoing alignment, we were able to find > 50% similar cell patches in two continuous image sessions. Otherwise, we ignored behavioral sessions in which proper day to day alignment was not achieved during data processing.
Calculating ΔF/F
To reduce the baseline noise from the ΔF/F traces and thereby minimize the temporal distortions caused by GCaMP6m dynamics, we applied a fast nonnegative deconvolution filter to the calcium traces (Vogelstein et al., 2010). This method has been inferred to approximate the likely spike train of each neuron, given the fluorescence observations. Throughout this analysis, all activity data are described as ΔF/F traces, unless otherwise noted. We also ignored few datasets (< 10% of all datasets) showing large displacements in the field of view from one imaging session to the next, which were likely produced by artifactual movements of the lens (Movie S1).
For each neuron, the mean response amplitude was calculated by averaging neuronal responses in each epoch or throughout all epochs and then subtracted by the averaged ΔF/F during baseline. The interaction epoch with mean response amplitude increased above 10% or decreased above 5% was considered as significantly responsive to that particular social stimulus. A “Reliability Index” of each neuron was determined as the fraction of significantly responsive epochs throughout all interaction epochs.
Social contact-evoked activity
To access social contact evoked responses in each 5-min free behaving epoch, peri-stimulus time histograms (PSTHs) were constructed. We selectively analyzed interactions lasting longer than 5 s with at least 5 s intervals with neighboring interactions. We used normalized ΔF/F to represent the time courses of responses to different social stimuli. The normalization of ΔF/F was performed to the largest response for each neuron. We aligned in time all individual epochs of social interaction according to the onset and offset of social contact, respectively and then performed a Wilcoxon signed rank test between the averaged fluorescent change within 5 s before and after the stimulus across trials. Only neurons with p value less than 0.05 were determined as significantly responsive to social contact.
For each neuron responsive to social contact, neuronal activities were averaged crossing trials and then normalized to the baseline (averaged fluorescent intensity in 5 s before the initiation of social interaction). K-means clustering (6 clusters) was performed on this type of responses.
Single neuron coding fidelity
Social stimulus-specific responses were measured for each neuron using ROC (receiver operating characteristic) analysis (Britten et al., 1992). ROC curves were calculated by comparing the distribution of calcium responses across all the bouts of one of the stimuli versus the distribution of calcium responses for the baseline. We compared the histogram of normalized calcium amplitude during the baseline period to that during a specific social investigating period by moving a criterion from minimum calcium amplitude (min) to the maximum calcium amplitude (max). The length of the criterion was calculated as the (max – min)/100. We then plotted the probability that the activity during social investigating was greater than the criteria against the probability that the baseline activity was greater than the criteria. The area under this curve quantifies the discriminability of the two signals (Britten et al., 1992).
To determine whether individual neurons were specifically encoding a given social stimulus, we randomly shuffled the orderings of the epochs of social interaction with the stimulus and baseline activity on a given day session for 1,000 times and then calculated the auROC values evoke by each social stimulus using scrambled social interactions. Neurons with auROC values exceeding the 95th percentile of shuffled auROCs were considered discriminative. We used the Response Strength (RS) of specific stimuli by calculating as (auROC-0.5) × 2. RS values over 0 represented increased response relative to baseline, while RS values less than 0 represented decreased response. RS values close to 1 or −1 represented excellent separation between responses to a given social stimulus and baseline and RS values near 0 represented nonsignificant separation between two conditions.
Cue-evoked mean response amplitude (Figure 3D) and reliabilities (Figure 3E and Figure S3E) were significantly different in neurons with increased, decreased or non-significantly changed responses to a particular stimulus across multiple cues. Moreover, the RS value correlates strongly with the reliabilities (Figure S3G) and weaker with the response amplitude (Figure S3F). These results are expected because the latter measure does not take into account the response variability across epochs. Our data indicate that RS analysis with shuffling procedure is a good measurement of cue-evoked signal changes, taking into account both the mean response amplitude and reliability.
Triangular plots of neural response strength
Triangular plots (Figure 4E and Figures S5D–S5F) of responses to female, male and rat bedding cues were generated similarly to Bergan et al., 2014. Here, we calculated the aforementioned auROC value in each neuron as the normalized change in calcium signal evoked by different social features. The absolute value of response strength (|RS|) of specific stimuli was calculated as |(auROC-0.5) × 2|. Then the |RS| were normalized by dividing by the summed responses to female, male and soiled bedding of rat such that: |RSfemale| + |RSmale| + |RSrat bedding| = 1.
Population vector analysis
To access the differentiability between the responses to each given stimulus and baseline over time in a 5-min trial, we used the Mahalanobis population vector distance (PVD), which measures the distance between a time point and a distribution, using the responses of all cells to a given stimulus (Grewe et al., 2017). This is similar to a Euclidean distance, but like the discrimination index d′ it accounts for mean responses and neuron-to-neuron variability, using the correlations in the responses of all the cells. We created different N-dimensional (n = number of neurons) response vectors rstim for each stimulus type (baseline, responses to female, male, pups and rat soiled bedding), and then calculated PVD between the two groups of response vectors. For example, for a response vector rfemale/baseline, the PVD is given by:
rfemale/baseline are individual population vectors for responses to female and average population responses during baseline; Rbaseline is average population response during baseline; S is the covariance matrix.
To examine the dynamics of responses to each stimulus on a given day for all the mice, we first sequentially arranged multiple social presentations with a given social stimulus during a 5-min trial, and then equally divided the integrated social interaction into 10 segments.
To further understand whether mating and fighting could induce any changes in neuronal activity. We calculated the PVD(rfemale/male) and PVD(rmale/female) in males with mating and fighting behaviors in a five-minute trial, respectively. We also respectively calculated the mean PVD(rfemale/male) and PVD(rmale/female) in the time bins before and after the initiation of mating and fighting behaviors. In the group of males without sex-related behaviors on a given trial, we subdivided each integrated interaction with female or male cues by a time point randomly simulated from a normal distribution with specific mean and variance calculated by the values of all initiation time points (between 0 and 1) of sex-related behaviors in the other group of males. Simulated time points beyond 0~1 were removed. The mean PVD values before and after each simulated time point were calculated in each male without sex-related behaviors.
Linear discriminant analysis
For population analysis, population vectors r(t) = [r1(t) … rN(t)] were formed, with N the number of neurons selected from a single field of view. For notational convenience, let Lk, k = 1..4, be the sets of time points (0.2 s per time point) associated with the four conditions “responses to female” (k = 1), “responses to male” (k = 2), “responses to pups” (k = 3), and “responses to rat bedding” (k = 4). Fisher’s discriminant (Hastie et al., 2009) was used to measure the overlap of the neural representations at the population level for any pair of conditions (A and B). Maximum linear class separation between any two conditions A and B, occurs for the following weight vectors w = [w1.… wN],
Where < *> denote the mean, Σ is the total within-class covariance matrix, A and B are two conditions from Lk, k = 1..4, and the set of Lk were collected from the time points of social contact. The separability of the two classes by this weight vector can be measured by the following discrimination index (d′) between each two conditions was obtained by grouping the normalized calcium response accordingly, and computing
To compare the group separation using different subpopulations, we averaged the discrimination index over 1,000 randomly chosen a subset of N∈ {25, 50, 75, 100, …, all} neurons in the same field of view a given session.
To get an intuition of how different social cues can be discriminated by neuronal ensembles, we analyzed neuronal activities of a randomly selected 75 neurons evoked by different social stimuli, and then projected these responses into a two-dimensional space using the coordinates defined by the two largest eigenvalues of the linear discriminant (Figure S6A).
Predicting the activity of each MeA neuron using behavioral variables
We used a linear model: to predict the activity of each individual neuron in time (F) during a five-minute trial, interacting with pups, rat soiled bedding or a centrifuge tube. The variables (Xn) used here are the absolute position of the mouse in the arena (x, y: coordinates of the center of the mouse), radius position , change of the position (Δx, Δy), absolute speed ( direction (arctan(y/x)), and directional speed (arctan(Δy/Δx)). The algorithm was trained using 2-fold cross-validation on a subset of time points of the individual neuronal activity F(t) (the training set; 50%) and evaluated on a separate set of test trials (50%). We report the average coefficient of determination (R2) between the prediction and the activity of individual neuron in time on the test set as a performance metric of the quality of prediction.
Decoding behavioral variables from population activity
We used regularized logistic regression to decode the presence of a particular social stimulus (Hastie et al., 2009). The regularization constant was selected from [10−1, 10−2, 10−3, 10−4, 10−5, 10−6]. The algorithm was trained using 5-fold cross-validation on a subset of time points of the population activity r(t) = [r1(t) … rN(t)] (the training set; 80%) and evaluated on a separate set of test trials (20%). We report the average coefficient of determination (R2) between the model prediction and social interactions in time on the test set as a performance metric of the quality of decoding.
We not only analyzed the whole population, but picked random subpopulations with increasing size, to check how many neurons are necessary to achieve a certain performance. The numbers of subpopulation we chosen from N∈ {2, 5, 10, 20, 35, 50, 75, 100, 150, 200, 250, 300}. For each population size we picked 50 random subsets and reported the summary statistics of the coefficient of determination R2.
We also used a logistic regression to predict the identity of the particular stimulus, by linearly combining activities of all neurons in a particular way and comparing to a threshold. The accuracy in predicting the identity of the social stimulus at each time point is similar to that in predicting whether the animal is interacting with a particular social stimulus at this time. Thus, the logistic regression analysis reveals that the condition can be accurately read out by a simple mechanism (linearly combining activities and comparing to a threshold).
Here is how we predict whether the animal is interacting with a social cue at each time point during one-day session, and which social cue it is interacting with: First, based on population neuronal activity, decoders are built for each stimulus condition, in which specific readout weights are attributed to different neurons. Then for each time point in one-day session, neuronal activities of all the MeA neurons at this time point were linearly combined using the obtained readout weights in each column. If the linear combination of all neurons using a particular set of readout weights is above a certain threshold (the threshold we used is 5 folds of the standard deviation of the predicted social contacts in one-day session, please see Figure S6C in the manuscript, magenta trace), then we say that the animal is interacting with a particular stimulus at this time point. Otherwise, no social interaction is happening at this time. If the prediction reveals that the animal is interacting with more than one stimulus at a time point, meaning that the linear combination of all neurons using more than one set of readout weights are above the threshold, we then choose the social stimulus with the largest prediction accuracy (R2) at this time point. Generally, different subsets of MeA neurons are playing different roles in predicting each social stimulus. These readout weights are cross-validated and generalize well to the test dataset.
Fluorescent mRNA in situ hybridization
Expression of mRNA in the MeA was visualized using RNAscope (Advanced cell Diagonostics) following the manufacturers guidelines. In preparation for RNAscope brains were dissected and frozen immediately in OCT (Tissue-Tek) then sectioned a 16 μm on a cryostat. Slides were dried at −20°C for 1 hour then frozen in −80°C for up to 1 week. Slides were processed as described in the RNAscope protocol using the fluorescent multiplex reagent kit and probes for Vgat (Mm-Slc32a1), Vglut2 (Mm-Slc17a6-C2), and OXTR (Mm-Oxtr-C3). Images were taken at 40×. Three sections were quantified per mouse (anterior, medial and posterior MeA), N = 4). Quantification of expression was done using Cellprofiler software (Broad Institute). The module used was a modified version of the publicly available percent positive module. Briefly, images were separated into their respective color channels and the DAPI channel was used to segment cell nuclei. Signal from the red and green channels was thresholded and identified then filtered by the location of the nuclei. If the signal was located within the nuclei, that cell was counted as ‘positive’ for the respective RNA species. Finally, nuclei that were positive for Vgat or Vglut2 were filtered for co-expression of OXTR.
Histology
One month after the end of the imaging experiments, or two weeks after the co-injection of the GCaMP6m and conditional mcherry virus into Vgat-ires-Cre or Vglut2-ires-Cre transgenic mice, we perfused the mice with 4% paraformaldehyde (PFA) in phosphate-buffered saline (PBS). Brains were dissected and kept in PFA for at least 24 hours. 60-mm thick brain slices were obtained with a Vibratome (VT1000s, Leica). A Zeiss Axio Scan.Z1 was used to image the position of lens implantation, and the co-localization of expression between GCaMP6m and conditioned mCherry.
QUANTIFICATION AND STATISTICAL ANALYSIS
All analyses were done in MATLAB (Mathworks). Data were first tested with Lilliefors test for normality. If the null hypothesis that the data come from a normal distribution cannot be rejected, Student’s t test was used in two-group comparison, while ANOVA was used for multiple-group comparison. If the data did not follow a normal distribution, Wilcoxon rank-sum test was used in two-group comparison, while Kruskal-Wallis test was used for multiple-group comparison. Chi-square test was used to examine whether the proportions of different categories (i.e.: neurons responses to female, male, pups and rat soiled bedding) under different conditions (i.e.: virgin, co-housed, experienced) are statistically different. Statistical parameters for the ANOVA test including the p values, degrees of freedom, error degrees of freedom, total degrees of freedom, chi-square values are reported in Table S1. The exact value of n and statistical significance of the other statistical tests are reported in the figures or figure legends.
Supplementary Material
Highlights.
Ca2+ imaging in freely behaving mice reveals sex-specific differences in the encoding of social stimuli
MeA depiction of social information relies on population and individual neuron responses
Sexual experience triggers lasting and sex-specific changes in MeApd activity
Changes in the MeApd of sexually experienced males involve the neuropeptide oxytocin
Acknowledgments
We thank members of the Uchida, Murthy, and Dulac labs for helpful comments on this manuscript. We are grateful to S. Sullivan, E. Soucy, and J. Greenwood for assistance with experiments; R. Hellmiss for help with figures; and J. Li and Y. Zhang for construction of the AAV2/5-GCaMP virus. This work was funded by a Human Frontier Science Program LT 000382/ 2014L (Y.L.), the Swiss National Science Foundation CRSII5 17372 (B.F.G.), a Gilliam Fellowship from Howard Hughes Medical Institute (HHMI) (B.A.), a Marie Curie International Fellowship No. 622943, and a grant from the Deutsche Forschungsgemeinschaft (MA 6176/1-1) (A.M.). M.J.S. received support from HHMI and DARPA. C.D. received support from NIH/NIDCD (R01DC013087) and HHMI. V.N.M. received support from NIH/NIDCD (R01DC011291). M.J.S. is a scientific co-founder of Inscopix, which produces the miniature fluorescence microscope used in this study.
Footnotes
SUPPLEMENTAL INFORMATION
Supplemental Information includes seven figures, one table, and one movie and can be found with this article online at https://doi.org/10.1016/j.cell.2017.10.015.
AUTHOR CONTRIBUTIONS
Y.L. and C.D. conceived of the project and wrote the manuscript with input from all authors. J.A.O. performed and analyzed the RNAscope experiments. Y.L. performed all other experiments. Y.L. and A.M. analyzed the data with input from B.F.G., V.N.M., and M.J.S. B.F.G. developed the microendoscope implantation. B.A. developed the locomotor tracking.
References
- Averbeck BB, Latham PE, Pouget A. Neural correlations, population coding and computation. Nat Rev Neurosci. 2006;7:358–366. doi: 10.1038/nrn1888. [DOI] [PubMed] [Google Scholar]
- Beach FA. A review of physiological and psychological studies of sexual behavior in mammals. Physiol Rev. 1947;27:240–307. doi: 10.1152/physrev.1947.27.2.240. [DOI] [PubMed] [Google Scholar]
- Belluscio L, Koentges G, Axel R, Dulac C. A map of pheromone receptor activation in the mammalian brain. Cell. 1999;97:209–220. doi: 10.1016/s0092-8674(00)80731-x. [DOI] [PubMed] [Google Scholar]
- Ben-Shaul Y, Katz LC, Mooney R, Dulac C. In vivo vomeronasal stimulation reveals sensory encoding of conspecific and allospecific cues by the mouse accessory olfactory bulb. Proc Natl Acad Sci USA. 2010;107:5172–5177. doi: 10.1073/pnas.0915147107. [DOI] [PMC free article] [PubMed] [Google Scholar]
- Bergan JF, Ben-Shaul Y, Dulac C. Sex-specific processing of social cues in the medial amygdala. eLife. 2014;3:e02743. doi: 10.7554/eLife.02743. [DOI] [PMC free article] [PubMed] [Google Scholar]
- Binns KE, Brennan PA. Changes in electrophysiological activity in the accessory olfactory bulb and medial amygdala associated with mate recognition in mice. Eur J Neurosci. 2005;21:2529–2537. doi: 10.1111/j.1460-9568.2005.04090.x. [DOI] [PubMed] [Google Scholar]
- Britten KH, Shadlen MN, Newsome WT, Movshon JA. The analysis of visual motion: a comparison of neuronal and psychophysical performance. J Neurosci. 1992;12:4745–4765. doi: 10.1523/JNEUROSCI.12-12-04745.1992. [DOI] [PMC free article] [PubMed] [Google Scholar]
- Caroom D, Bronson FH. Responsiveness of female mice to preputial attractant: effects of sexual experience and ovarian hormones. Physiol Behav. 1971;7:659–662. doi: 10.1016/0031-9384(71)90126-0. [DOI] [PubMed] [Google Scholar]
- Carvalho VM, Nakahara TS, Cardozo LM, Souza MA, Camargo AP, Trintinalia GZ, Ferraz E, Papes F. Lack of spatial segregation in the representation of pheromones and kairomones in the mouse medial amygdala. Front Neurosci. 2015;9:283. doi: 10.3389/fnins.2015.00283. [DOI] [PMC free article] [PubMed] [Google Scholar]
- Chamero P, Marton TF, Logan DW, Flanagan K, Cruz JR, Saghatelian A, Cravatt BF, Stowers L. Identification of protein pheromones that promote aggressive behaviour. Nature. 2007;450:899–902. doi: 10.1038/nature05997. [DOI] [PubMed] [Google Scholar]
- Chen TW, Wardill TJ, Sun Y, Pulver SR, Renninger SL, Baohan A, Schreiter ER, Kerr RA, Orger MB, Jayaraman V, et al. Ultrasensitive fluorescent proteins for imaging neuronal activity. Nature. 2013;499:295–300. doi: 10.1038/nature12354. [DOI] [PMC free article] [PubMed] [Google Scholar]
- Choi GB, Dong HW, Murphy AJ, Valenzuela DM, Yancopoulos GD, Swanson LW, Anderson DJ. Lhx6 delineates a pathway mediating innate reproductive behaviors from the amygdala to the hypothalamus. Neuron. 2005;46:647–660. doi: 10.1016/j.neuron.2005.04.011. [DOI] [PubMed] [Google Scholar]
- Dey S, Chamero P, Pru JK, Chien MS, Ibarra-Soria X, Spencer KR, Logan DW, Matsunami H, Peluso JJ, Stowers L. Cyclic regulation of sensory perception by a female hormone alters behavior. Cell. 2015;161:1334–1344. doi: 10.1016/j.cell.2015.04.052. [DOI] [PMC free article] [PubMed] [Google Scholar]
- Dölen G, Darvishzadeh A, Huang KW, Malenka RC. Social reward requires coordinated activity of nucleus accumbens oxytocin and serotonin. Nature. 2013;501:179–184. doi: 10.1038/nature12518. [DOI] [PMC free article] [PubMed] [Google Scholar]
- Dulac C, Torello AT. Molecular detection of pheromone signals in mammals: from genes to behaviour. Nat Rev Neurosci. 2003;4:551–562. doi: 10.1038/nrn1140. [DOI] [PubMed] [Google Scholar]
- Ferguson JN, Aldag JM, Insel TR, Young LJ. Oxytocin in the medial amygdala is essential for social recognition in the mouse. J Neurosci. 2001;21:8278–8285. doi: 10.1523/JNEUROSCI.21-20-08278.2001. [DOI] [PMC free article] [PubMed] [Google Scholar]
- Grewe BF, Gründemann J, Kitch LJ, Lecoq JA, Parker JG, Marshall JD, Larkin MC, Jercog PE, Grenier F, Li JZ, et al. Neural ensemble dynamics underlying a long-term associative memory. Nature. 2017;543:670–675. doi: 10.1038/nature21682. [DOI] [PMC free article] [PubMed] [Google Scholar]
- Haga S, Hattori T, Sato T, Sato K, Matsuda S, Kobayakawa R, Sakano H, Yoshihara Y, Kikusui T, Touhara K. The male mouse pheromone ESP1 enhances female sexual receptive behaviour through a specific vomeronasal receptor. Nature. 2010;466:118–122. doi: 10.1038/nature09142. [DOI] [PubMed] [Google Scholar]
- Halem HA, Baum MJ, Cherry JA. Sex difference and steroid modulation of pheromone-induced immediate early genes in the two zones of the mouse accessory olfactory system. J Neurosci. 2001;21:2474–2480. doi: 10.1523/JNEUROSCI.21-07-02474.2001. [DOI] [PMC free article] [PubMed] [Google Scholar]
- Hastie T, Tibshirani R, Friedman JH. The elements of statistical learning: data mining, inference, and prediction. Second. New York: Springer; 2009. [Google Scholar]
- Holy TE, Dulac C, Meister M. Responses of vomeronasal neurons to natural stimuli. Science. 2000;289:1569–1572. doi: 10.1126/science.289.5484.1569. [DOI] [PubMed] [Google Scholar]
- Hong W, Kim DW, Anderson DJ. Antagonistic control of social versus repetitive self-grooming behaviors by separable amygdala neuronal subsets. Cell. 2014;158:1348–1361. doi: 10.1016/j.cell.2014.07.049. [DOI] [PMC free article] [PubMed] [Google Scholar]
- Insel TR, Hulihan TJ. A gender-specific mechanism for pair bonding: oxytocin and partner preference formation in monogamous voles. Behav Neurosci. 1995;109:782–789. doi: 10.1037//0735-7044.109.4.782. [DOI] [PubMed] [Google Scholar]
- Isogai Y, Si S, Pont-Lezica L, Tan T, Kapoor V, Murthy VN, Dulac C. Molecular organization of vomeronasal chemoreception. Nature. 2011;478:241–245. doi: 10.1038/nature10437. [DOI] [PMC free article] [PubMed] [Google Scholar]
- Iurilli G, Datta SR. Population coding in an innately relevant olfactory area. Neuron. 2017;93:1180–1197.e7. doi: 10.1016/j.neuron.2017.02.010. [DOI] [PMC free article] [PubMed] [Google Scholar]
- Keshavarzi S, Sullivan RKP, Ianno DJ, Sah P. Functional properties and projections of neurons in the medial amygdala. J Neurosci. 2014;34:8699–8715. doi: 10.1523/JNEUROSCI.1176-14.2014. [DOI] [PMC free article] [PubMed] [Google Scholar]
- Kimchi T, Xu J, Dulac C. A functional circuit underlying male sexual behaviour in the female mouse brain. Nature. 2007;448:1009–1014. doi: 10.1038/nature06089. [DOI] [PubMed] [Google Scholar]
- Krashes MJ, Shah BP, Madara JC, Olson DP, Strochlic DE, Garfield AS, Vong L, Pei H, Watabe-Uchida M, Uchida N, et al. An excitatory paraventricular nucleus to AgRP neuron circuit that drives hunger. Nature. 2014;507:238–242. doi: 10.1038/nature12956. [DOI] [PMC free article] [PubMed] [Google Scholar]
- Lim MM, Young LJ. Neuropeptidergic regulation of affiliative behavior and social bonding in animals. Horm Behav. 2006;50:506–517. doi: 10.1016/j.yhbeh.2006.06.028. [DOI] [PubMed] [Google Scholar]
- Lonstein JS, Gammie SC. Sensory, hormonal, and neural control of maternal aggression in laboratory rodents. Neurosci Biobehav Rev. 2002;26:869–888. doi: 10.1016/s0149-7634(02)00087-8. [DOI] [PubMed] [Google Scholar]
- Luo M, Fee MS, Katz LC. Encoding pheromonal signals in the accessory olfactory bulb of behaving mice. Science. 2003;299:1196–1201. doi: 10.1126/science.1082133. [DOI] [PubMed] [Google Scholar]
- Marlin BJ, Mitre M, D’amour JA, Chao MV, Froemke RC. Oxytocin enables maternal behaviour by balancing cortical inhibition. Nature. 2015;520:499–504. doi: 10.1038/nature14402. [DOI] [PMC free article] [PubMed] [Google Scholar]
- Meeks JP, Arnson HA, Holy TE. Representation and transformation of sensory information in the mouse accessory olfactory system. Nat Neurosci. 2010;13:723–730. doi: 10.1038/nn.2546. [DOI] [PMC free article] [PubMed] [Google Scholar]
- Mohedano-Moriano A, Pro-Sistiaga P, Ubeda-Bañón I, Crespo C, Insausti R, Martinez-Marcos A. Segregated pathways to the vomeronasal amygdala: differential projections from the anterior and posterior divisions of the accessory olfactory bulb. Eur J Neurosci. 2007;25:2065–2080. doi: 10.1111/j.1460-9568.2007.05472.x. [DOI] [PubMed] [Google Scholar]
- Nakajima M, Görlich A, Heintz N. Oxytocin modulates female sociosexual behavior through a specific class of prefrontal cortical interneurons. Cell. 2014;159:295–305. doi: 10.1016/j.cell.2014.09.020. [DOI] [PMC free article] [PubMed] [Google Scholar]
- Papes F, Logan DW, Stowers L. The vomeronasal organ mediates interspecies defensive behaviors through detection of protein pheromone homologs. Cell. 2010;141:692–703. doi: 10.1016/j.cell.2010.03.037. [DOI] [PMC free article] [PubMed] [Google Scholar]
- Poo C, Isaacson JS. Odor representations in olfactory cortex: “sparse” coding, global inhibition, and oscillations. Neuron. 2009;62:850–861. doi: 10.1016/j.neuron.2009.05.022. [DOI] [PMC free article] [PubMed] [Google Scholar]
- Rodriguez I, Feinstein P, Mombaerts P. Variable patterns of axonal projections of sensory neurons in the mouse vomeronasal system. Cell. 1999;97:199–208. doi: 10.1016/s0092-8674(00)80730-8. [DOI] [PubMed] [Google Scholar]
- Ross HE, Young LJ. Oxytocin and the neural mechanisms regulating social cognition and affiliative behavior. Front Neuroendocrinol. 2009;30:534–547. doi: 10.1016/j.yfrne.2009.05.004. [DOI] [PMC free article] [PubMed] [Google Scholar]
- Schellino R, Trova S, Cimino I, Farinetti A, Jongbloets BC, Pasterkamp RJ, Panzica G, Giacobini P, De Marchis S, Peretto P. Opposite-sex attraction in male mice requires testosterone-dependent regulation of adult olfactory bulb neurogenesis. Sci Rep. 2016;6:36063. doi: 10.1038/srep36063. [DOI] [PMC free article] [PubMed] [Google Scholar]
- Stettler DD, Axel R. Representations of odor in the piriform cortex. Neuron. 2009;63:854–864. doi: 10.1016/j.neuron.2009.09.005. [DOI] [PubMed] [Google Scholar]
- Stowers L, Holy TE, Meister M, Dulac C, Koentges G. Loss of sex discrimination and male-male aggression in mice deficient for TRP2. Science. 2002;295:1493–1500. doi: 10.1126/science.1069259. [DOI] [PubMed] [Google Scholar]
- Tachikawa KS, Yoshihara Y, Kuroda KO. Behavioral transition from attack to parenting in male mice: a crucial role of the vomeronasal system. J Neurosci. 2013;33:5120–5126. doi: 10.1523/JNEUROSCI.2364-12.2013. [DOI] [PMC free article] [PubMed] [Google Scholar]
- Tinbergen N. The study of instinct. Oxford: Clarendon Press; 1951. [Google Scholar]
- Unger EK, Burke KJ, Jr, Yang CF, Bender KJ, Fuller PM, Shah NM. Medial amygdalar aromatase neurons regulate aggression in both sexes. Cell Rep. 2015;10:453–462. doi: 10.1016/j.celrep.2014.12.040. [DOI] [PMC free article] [PubMed] [Google Scholar]
- Vogelstein JT, Packer AM, Machado TA, Sippy T, Babadi B, Yuste R, Paninski L. Fast nonnegative deconvolution for spike train inference from population calcium imaging. J Neurophysiol. 2010;104:3691–3704. doi: 10.1152/jn.01073.2009. [DOI] [PMC free article] [PubMed] [Google Scholar]
- Wagner S, Gresser AL, Torello AT, Dulac C. A multireceptor genetic approach uncovers an ordered integration of VNO sensory inputs in the accessory olfactory bulb. Neuron. 2006;50:697–709. doi: 10.1016/j.neuron.2006.04.033. [DOI] [PubMed] [Google Scholar]
- Watabe-Uchida M, Zhu L, Ogawa SK, Vamanrao A, Uchida N. Whole-brain mapping of direct inputs to midbrain dopamine neurons. Neuron. 2012;74:858–873. doi: 10.1016/j.neuron.2012.03.017. [DOI] [PubMed] [Google Scholar]
- Wu D, Gore AC. Sexual experience changes sex hormones but not hypothalamic steroid hormone receptor expression in young and middle-aged male rats. Horm Behav. 2009;56:299–308. doi: 10.1016/j.yhbeh.2009.06.007. [DOI] [PMC free article] [PubMed] [Google Scholar]
- Wu Z, Autry AE, Bergan JF, Watabe-Uchida M, Dulac CG. Galanin neurons in the medial preoptic area govern parental behaviour. Nature. 2014;509:325–330. doi: 10.1038/nature13307. [DOI] [PMC free article] [PubMed] [Google Scholar]
- Xu PS, Lee D, Holy TE. Experience-dependent plasticity drives individual differences in pheromone-sensing neurons. Neuron. 2016;91:878–892. doi: 10.1016/j.neuron.2016.07.034. [DOI] [PMC free article] [PubMed] [Google Scholar]
- Xu X, Coats JK, Yang CF, Wang A, Ahmed OM, Alvarado M, Izumi T, Shah NM. Modular genetic control of sexually dimorphic behaviors. Cell. 2012;148:596–607. doi: 10.1016/j.cell.2011.12.018. [DOI] [PMC free article] [PubMed] [Google Scholar]
- Yang CF, Shah NM. Representing sex in the brain, one module at a time. Neuron. 2014;82:261–278. doi: 10.1016/j.neuron.2014.03.029. [DOI] [PMC free article] [PubMed] [Google Scholar]
- Yao SQ, Bergan J, Lanjuin A, Dulac C. Oxytocin signaling in the medial amygdala is required for sex discrimination of social cues. bioRxiv. 2017 doi: 10.7554/eLife.31373. https://doi.org/10.1101/178210. [DOI] [PMC free article] [PubMed]
- Zaldivar A, Krichmar JL. Interactions between the neuromodulatory systems and the amygdala: exploratory survey using the Allen Mouse Brain Atlas. Brain Struct Funct. 2013;218:1513–1530. doi: 10.1007/s00429-012-0473-7. [DOI] [PMC free article] [PubMed] [Google Scholar]
- Ziv Y, Burns LD, Cocker ED, Hamel EO, Ghosh KK, Kitch LJ, El Gamal A, Schnitzer MJ. Long-term dynamics of CA1 hippocampal place codes. Nat Neurosci. 2013;16:264–266. doi: 10.1038/nn.3329. [DOI] [PMC free article] [PubMed] [Google Scholar]
Associated Data
This section collects any data citations, data availability statements, or supplementary materials included in this article.