

Abstract
Background:
Cytochrome c is an intermembrane mitochondrial protein that is released to the bloodstream following mitochondrial injury.
Methods and results:
We developed an electrochemiluminescence immunoassay to measure cytochrome c in human and rat plasma, which showed high sensitivity with broad dynamic range (2-1200 ng/mL in humans and 5-500 ng/mL in rat) and high assay reproducibility (inter-assay coefficient <6% in humans and <10% in rat). In patients after blunt trauma, plasma cytochrome c directly correlated with injury severity. In rats after cardiac resuscitation, plasma cytochrome c inversely correlated with survival and responsiveness to mitochondrial protective interventions.
Conclusions:
The cytochrome c assays herein presented have high sensitivity, wide dynamic range, and high reproducibility well suited for biomarker of mitochondrial injury.
Keywords: Cytochrome c, plasma, human, rat, biomarker
Introduction
Cytochrome c is a 14-kDa haemoprotein highly conserved across species that plays a crucial role in oxidative phosphorylation, enabling electron transfer from complex III to complex IV of the respiratory chain. Cytochrome c can be released to the cytosol under various pathological conditions, including oxidative stress,1 calcium overload,2 and injury by hypoxia and reperfusion.3,4 In the cytosol, cytochrome c activates the mitochondrial apoptotic pathway.5 Cytochrome c can also leave the cell and reach the bloodstream through mechanisms apparently unrelated to cell necrosis.6,7
Elevated levels of circulating cytochrome c – measured in human plasma or serum – have been reportedly associated with clinical conditions that injure mitochondria, such as cancer,8,9 chemotherapy,6,10 acute myocardial infarction,11 systemic inflammatory response syndrome,12 liver disease,13 acute kidney injury,7 influenza-associated encephalopathy,14 and anti-viral therapy toxicity.15 Cytochrome c has also been measured in cerebrospinal fluid in patients with traumatic brain injury16 and in infants with brain injury from child abuse.16 Similarly, cytochrome c has been measured in urine after acute kidney injury.17
We have reported in rat models of cardiac arrest and resuscitation that cytochrome c is released to the bloodstream attaining post-resuscitation levels inversely proportional to myocardial function18 and survival.19 Interventions that improve post-resuscitation myocardial function reduce plasma cytochrome c levels.18,20,21 Accordingly, cytochrome c could serve as a marker of mitochondrial injury in a variety of clinical conditions and be useful to assess therapeutic interventions and predict outcome.
In most of these studies, cytochrome c was measured using Western immunoblotting,6,7,10,11 enzyme-linked immunosorbent assay (ELISA),12,13,15,16 or high-performance liquid chromatography (HPLC).19 However, these methods suffer limitations, including larger sample volume, narrow dynamic range requiring sample dilutions, lower sensitivity, and not suited for multiplexing. We herein report an assay developed using an electrochemiluminescence (ECL) method from Meso Scale Discovery (MSD) that is highly sensitive with a broad dynamic range. We initially developed the method to measure cytochrome c in human plasma and subsequently adapted the method to measure cytochrome c in rat plasma.
Materials and Methods
The assay was first developed to measure human plasma cytochrome c in samples obtained in patients with sepsis and after cardiac arrest as part of a collaboration with clinical investigators at Beth Israel Deaconess Medical Center, Boston, MA.22,23 We then used our method to measure plasma cytochrome c in patients with blunt trauma as part of a collaborative study between Advocate Lutheran General Hospital and our Resuscitation Institute that also included samples obtained from healthy human volunteers at our University for determining reference values. We then adapted our method to measure plasma cytochrome c in rats subjected to ventricular fibrillation (VF) and cardiopulmonary resuscitation (CPR) from 2 different series of experiments.
Materials
Multi-array 96-well plate (Cat. No. L15XA-1, SECTOR Imager standard plates), Blocker A, sulfo-tagged streptavidin (Cat. No. R32AD-5), and read buffer T (Cat. No. R92TC-2) were from MSD (Rockville, MD, USA). Capture antibody and biotinylated primary detection antibody, both specific for human cytochrome c (Cat. No. BMS263MST, Human cytochrome c module set), were from eBioscience, Inc (San Diego, CA, USA). Human heart cytochrome c and Tween-20 were from Sigma-Aldrich (St. Louis, MO, USA). Capture antibody and horseradish peroxidase (HRP) labelled detection antibody, both specific for rat cytochrome c and rat cytochrome c standard (Cat. No. DYC897, DuoSet IC, Rat/Mouse Total Cytochrome c kit), were from R&D systems (McKinley Place NE, MN, USA). Anti-HRP antibody (Cat. No. A00619) was obtained from GenScript (Piscataway, NJ, USA).
Methods
Ethical conduct of research
Human studies were approved by the Institutional Review Board (IRB) at Rosalind Franklin University of Medicine and Science (protocol no. 002 RI) and by the IRB at Advocate Lutheran General Hospital (protocol no. 5458) and were conducted according to institutional guidelines. Informed consents were obtained from human participants involved. Animal studies were approved by Institutional Animal Care and Use Committee (IACUC) of Rosalind Franklin University of Medicine and Science (protocol nos 13-12A1 and 13-22).
Plasma sample collection
Humans
Healthy volunteers. We enrolled 46 healthy volunteers (24 men, 22 women) who donated blood at the Resuscitation Institute, Rosalind Franklin University of Medicine and Science over a period of 1 month (July 2016 to August 2016). The volunteers gave informed consent and met specific inclusion and exclusion criteria. Inclusion criteria were age ≥18 years and not on any regular medical treatment which is chemical or radioactive in nature. Exclusion criteria were any disease or condition compromising major organ function, consumption of alcohol before 12 hours of blood draw, smoking, pregnancy, previous organ transplantation, and human immunodeficiency virus (HIV) infection. Plasma was separated and stored at −80°C for subsequent batch measurement of cytochrome c.
Trauma patients
We enrolled 12 trauma victims (9 men, 3 women) admitted to Advocate Lutheran General Hospital over a period of 14 months (August 2014 to October 2015) having single organ or multiple organ injuries. The subjects met the following inclusion criteria: age ≥18 years, hospital arrival ≤2 hours, mechanical ventilation within the initial 24 hours, and any of the following: systolic blood pressure <90 mm Hg, base deficit >4 mM, or transfusion ≥2 U of packed red blood cells (PRBCs) within ≤12 hours. The exclusion criteria (any one) were known disease with life expectancy <6 months, penetrating trauma, and death within 4 hours of hospital arrival. Blood was sampled (5 mL) within 15 minutes of hospital arrival (in the Emergency Department or Operating Room) and subsequently at 24, 48, and 72 hours. Plasma was separated by centrifugation at 2320g for 10 minutes at 4°C and stored at −80°C for subsequent batch measurement of cytochrome c.
Flow chart of the study is shown in Figure 1.
Figure 1.
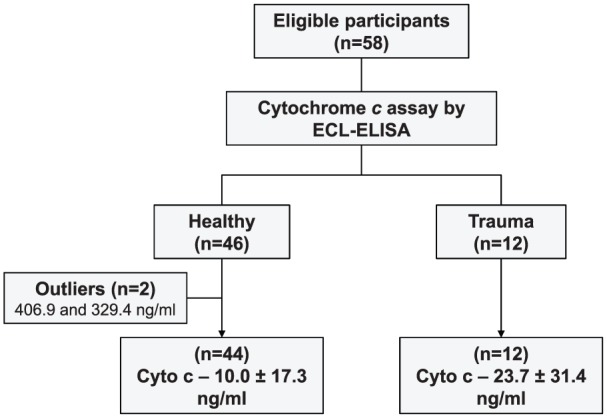
Flow chart of the study. ECL indicates electrochemiluminescence; ELISA, enzyme-linked immunosorbent assay.
Rats
Arterial blood (200 µL) was collected from 2 different series (Series I and II) of experiments. In both series, rats were subjected to VF and were resuscitated by chest compressions and electrical shocks.19 Successfully resuscitated rats were monitored for a pre-determined post-resuscitation time interval. The blood samples were centrifuged at 5000 rpm (2320g) for 10 minutes at 4°C (Sorvall Biofuge Stratos; Heraeus, Hanau, Germany). The supernatants (plasma) were frozen at −80°C for subsequent batch measurement of cytochrome c.
In Series I (unpublished), we measured the plasma cytochrome c levels from vehicle control group (6 rats) at baseline and at 60, 120, and 180 minutes post-resuscitation.
In Series II,21 we measured the plasma cytochrome c levels at 120 and 240 minutes post-resuscitation from 3 groups of 8 rats each which were randomized to receive the sodium-hydrogen exchanger isoform-1 (NHE-1) zoniporide (ZNP) vehicle during CPR and sodium carbonate/bicarbonate buffer (buffer) post-resuscitation (vehicle/buffer), ZNP during CPR and buffer post-resuscitation (ZNP/buffer), or ZNP during CPR and normal saline post-resuscitation (ZNP/saline).
Cytochrome c measurement by ECL-ELISA
Principle
Electrochemiluminescence-ELISA uses microplates with carbon electrodes integrated into the bottom of each well. The assay involves (1) coating the plates with capture antibody specific for a target protein, (2) adding sample solution containing the target protein, (3) adding a detection antibody specific for the target protein, and (4) adding a detection reagent containing an ECL label known as ‘sulfo-tag’. The sulfo-tag is an N-hydroxysuccinimide ester which can be conjugated directly to the detection antibody or through a streptavidin protein, which, in turn, binds to the detection antibody which has been biotinylated. Because most of the commercially available detection antibodies are biotinylated, it is convenient to use streptavidin sulfo-tag (which is also commercially available from MSD) than sulfo-tagging the detection antibody. A chemical solution ‘read buffer’ containing an electron carrier ‘tripropylamine’ (TPA) is then added and the plate loaded into an MSD imager. The imager applies voltage to the plate electrodes (electrical stimulation), causing the sulfo-tag to emit light through a series of reduction and oxidation reactions involving TPA and the sulfo-tag. The electrically stimulated chemiluminescence reaction occurs only if a complete complex is formed (ie, capture antibody, target protein, detection antibody, and the sulfo-tagged detection reagent). The imager measures the intensity of the emitted chemiluminescent light representing a quantitative readout of the target protein level. We used the multiplex immunoassay instrument Quickplex SQ120 from MSD. The schematic overview and workflow of the ECL assays for cytochrome c detection in human plasma and rat plasma are shown in Figure 2. The detailed description of each of the technique is given below.
Figure 2.

Schematic diagram depicting human and rat ECL assays. ECL indicates electrochemiluminescence; HRP, horseradish peroxidase.
Method for detection of plasma cytochrome c
Human assay
The capture and detection antibodies for human cytochrome c were obtained from eBioscience, Inc. The detection antibody was biotinylated, enabling binding of a streptavidin-conjugated sulfo-tag obtained from MSD.
Capture antibody coating and blocking
A standard 96-well plate (MSD Cat. No. L15XA-1) was coated with 30 µL/well capture antibody (gelatin free, 4 µg/mL concentration diluted in phosphate buffered saline [PBS]). The plate was sealed and incubated overnight at 4°C without shaking. The capture antibody solution was removed and the plate was blocked using a blocking solution (150 µL/well) containing 3% Blocker A in 1× PBS for 1 hour at room temperature with shaking on a microplate shaker (LabDoctor orbital shaker; MIDSCI, Valley Park, MO, USA) at 700 rpm.
Standard and sample incubation and detection
After blocking, standard cytochrome c solutions or human plasma samples (25 µL/well, prepared as detailed below) in 1% Tween-20 assay diluent (1% Tween-20 and 1% Blocker A in 1× PBS) were added. Detection antibody (25 µL/well) was also added according to the vendor’s recommendations (eBiosciences, Inc). The plate was then incubated for 2.5 hours at room temperature and washed 3 times with wash buffer (0.05% Tween-20 in 1× PBS). After washing, 25 µL/well of sulfo-tagged streptavidin (secondary detection reagent) in assay diluent (1% Blocker A in 1× PBS) was added and incubated for 30 minutes at room temperature with shaking. The plate was then washed 3 times and tap dried on a stack of paper towels. The read buffer (150 µL/well) was then added to the wells. The plate was then loaded into the MSD Quickplex SQ120 to run the ECL reaction.
Preparation of standards and samples
Standard curves were prepared using pooled normal human plasma separated from blood (2 mL) collected from healthy volunteers as described above and stored in aliquots at −80°C. Human heart cytochrome c from Sigma was dissolved in sterile Milli-Q water to a concentration of 10 µg/ml and stored in aliquots at −80°C. When needed, an aliquot was thawed and a series of dilutions representing concentrations (ng/mL) of 1200, 400, 133.3, 44.4, 14.8, 4.9, 1.7, and 0 in 10% pooled normal human plasma containing 1% Tween-20 assay diluent was prepared. For the assay, 25 µL of each of the concentrations of the standards was used in duplicates.
Frozen human plasma from patients were thawed in ice and diluted (1:1 and 1:10 dilution) in 1% Tween-20 assay diluent. For the assay, 25 µL of each of the samples in duplicates of the 2 dilutions was used. Coefficient of variation (CV), which is defined as the ratio of standard deviation to mean (ie, relative standard deviation) of replicate samples multiplied by 100, was calculated and reported.
Rat assay
The capture and detection antibodies were obtained from R&D systems (DuoSet IC, Rat/Mouse Total Cytochrome c kit).
The MSD imager can detect signals only from sulfo-tagged detection reagents. However, the detection antibody provided by the R&D systems was labelled with HRP. Because the detection antibody already had the HRP tag, adding another tag, ie, sulfo-tag, was not an option. Moreover, this was the only commercially available matched pair detection antibody for rat cytochrome c. To circumvent this problem, we used an anti-HRP antibody to which we conjugated a sulfo-tag using a sulfo-tag labelling protocol according to instructions provided by MSD.
The ECL reaction was performed as for human plasma, except the following steps. The 96-well plate was coated with the capture antibody at room temperature overnight as recommended by the R&D systems. After blocking the plate, the incubation of standards and samples was performed for 2 hours at room temperature. The plate was then washed 4 times with 300 µL of wash buffer each. After washing, 25 µL of the HRP-tagged detection antibody (0.5 µg/mL final concentration in 1% Tween-20 assay diluent) was added to the wells. The plate was then sealed and incubated for 2 hours at room temperature with shaking. After washing, 25 µL of the anti-HRP antibody, sulfo-tagged (2 µg/mL final concentration in the assay diluent) was added to the wells. The plate was sealed and incubated for 2 hours at room temperature with shaking. The plate was then washed in wash buffer 5 times. The read buffer was then added and the plate was read.
Preparation of standards and samples
Standard curves were prepared in pooled normal rat plasma samples. Blood was collected from 3 anesthetized rats and plasma was separated and pooled. Rat cytochrome c provided in the kit (DuoSet IC, Rat/Mouse Total Cytochrome c; R&D systems) was dissolved in 1× PBS to a concentration of 2 µg/mL. A series of dilutions representing concentrations (ng/mL) of 500, 250, 125, 62.5, 31.25, 15.63, 7.81, and 0 were prepared in pooled normal rat plasma in the 1% Tween-20 assay diluent. Plasma collected at baseline and at 60, 120, and 180 minutes post-resuscitation for the studies examining the effects of α-methylnorepinephrine (α-MNE) and ZNP (unpublished) and at 120 and 240 minutes post-resuscitation for the studies examining the effects of sodium carbonate/bicarbonate buffer21 stored at −80°C was thawed in ice and used for the assay. For the assay, samples were diluted (2.5 times for baseline; 10 times for post-resuscitation) and separate standard curves prepared in either 2.5 times or 10 times diluted pooled normal rat plasma were used for the calculations of the respective samples. All standards and samples were run in duplicates. Coefficient of variations were calculated and reported.
Standard curves
Data analysis was performed using MSD software, which used a 4-parameter logistic (FourPL) curve fitting algorithm to generate a standard curve to calculate the unknown concentrations. The limit of detection (LOD) was calculated by the Meso Scale Discovery Workbench software using the standard formula, which is shown below and is further defined in the literature24:
where SignalLOD is the chemiluminescent signal corresponding to the LOD, SignalBlank is the signal from the blank, and σBlank is the standard deviation of the blank from all the replicates. Cytochrome c levels were expressed in nanogram per milliliter.
Reproducibility and accuracy
Assay reproducibility was determined by intra-assay and inter-assay precision documenting the CV. Intra-assay precision is an expression of consistency of assay runs within a single plate. Inter-assay precision is an expression of consistency of assay runs across different plates. The intra-assay precision was evaluated by measuring the standard curve in quadruplicate for the human assay and in duplicates for the rat assay within a single plate. The inter-assay precision was evaluated by measuring duplicates of standard curves on 10 distinct ELISA plates over 2 years for the human assay and on 5 distinct ELISA plates over a month for the rat assay.
Accuracy was also evaluated while assessing ‘reproducibility’ by documenting intra- and inter-assay percent recovery. The accuracy is an expression of closeness of agreement between observed and expected values. The percentage recovery was calculated by dividing observed cytochrome c values by expected values and multiplying the resulting product by 100.
Data collection and analysis
Healthy volunteers were asked to answer a questionnaire collecting their demographic data. A database devoid of volunteer identifiers was then created including values of their plasma cytochrome c.
A database devoid of patient identifiers was created at the Advocate Lutheran General Hospital merging the clinical information with values of plasma cytochrome c. Clinical data were extracted from tools used clinically – including the Illinois Trauma Registry Worksheet and the medical record – and used to (1) record severity of initial traumatic injury by calculating the Trauma Score–Injury Severity Score (TRISS) and injury severity score (ISS), along with a detailed assessment of individual organ injury, and (2) determine subsequent development of organ dysfunction by calculating the quick Sepsis-related Organ Failure Assessment (qSOFA), Sepsis-related Organ Failure Assessment (SOFA), and Multiple Organ Dysfunction Score (MODS). Analysis was focused on identifying relationships between plasma cytochrome c levels upon hospital arrival and clinical elements contributing to the severity of primary traumatic injury.
A database was created including rat cytochrome c values along with hemodynamic parameters measured during cardiac resuscitation and post-resuscitation and survival. Analysis was focused on identifying relationships between cytochrome c and cardiac function indicated by cardiac work index and survival.
Statistical analysis
SigmaPlot 12.5 (Systat Software, Point Richmond, CA, USA) was used for statistical analysis. Data for continuous variables are presented as mean ± SD in the text and as medians with first and third quartiles and with maximum and minimum values in figures. Differences between groups were analysed using Student’s t-test. Differences over time were analysed by 1-way repeated-measures (RM) analysis of variance (ANOVA) when a single variable was analysed and by 2-way RM ANOVA when a treatment effect was concurrently included followed by the Holm-Sidak test for multiple comparisons when overall differences were identified. Relationships between cytochrome c and other variables were analysed by multiple or simple, linear or non-linear, regression methods as indicated in the pertinent sections. A 2-tailed P < .05 was considered statistically significant.
Results
Cytochrome c assay
Standard curves and LOD
Representative standard curves of the human and rat assays are shown in Figure 3, demonstrating high sensitivity with a wide dynamic range. Upper limit of detection (ULOD) and lower limit of detection (LLOD) were determined from 13 standard curves for the human assay and 4 standard curves for the rat assay. The ULOD and LLOD, respectively, in nanogram per milliliter for the human assay were 1200.0 ± 0.0 and 1.8 ± 0.5 and for the rat assay were 500.0 ± 0.0 and 5.3 ± 1.0.
Figure 3.

Representative standard curves generated in 10% plasma for human and for rat electrochemiluminescence assay displaying a wide dynamic range. Standard curves were generated using commercially available matched capture and detection antibody pairs.
Reproducibility and accuracy
Reproducibility was assessed by the intra- and inter-assay CVs. The intra-assay CVs of quadruplicate samples measured in a single plate in human samples ranged from 1.8% to 9.7%. The intra-assay CVs of duplicate samples measured in a single plate in rat samples ranged from 1.3% to 7.1% (Table 1). Thus, the intra-assay CV values for both human and rat assay were below the 10% recommended for intra-assay test in immunoassays.25 The inter-assay CVs measured in 10 independent plates over a period of 2 years in human samples ranged from 2.2% to 6.0%. The inter-assay CVs measured in 5 independent plates over a period of 2 months in rat samples ranged from 2.9% to 9.9%. Thus, the inter-assay CV values for both human and rat assay were below the 20% recommended for this type of assay.25 These data indicate that the assays exhibited good reproducibility.
Table 1.
Intra-and inter-assay variation assessed over a range of concentrations of cytochrome c (cyto c) standards prepared in human or rat plasma.
| Cyto c (ng/mL) | Human assay |
Rat assay |
|||||||
|---|---|---|---|---|---|---|---|---|---|
| Intra-assay (n = 4) |
Inter-assay (n = 10) |
Cyto c (ng/mL) | Intra-assay (n = 2) |
Inter-assay (n = 5) |
|||||
| Recovery (%) | CV (%) | Recovery (%) | CV (%) | Recovery (%) | CV (%) | Recovery (%) | CV (%) | ||
| 1200.0 | 92.8 | 3.3 | 100.0 | 5.6 | 500.0 | 129.8 | 3.0 | 130.8 | 9.9 |
| 400.0 | 111.2 | 2.5 | 108.8 | 3.6 | 250.0 | 90.2 | 1.3 | 85.8 | 7.6 |
| 133.3 | 99.5 | 5.4 | 100.6 | 3.7 | 125.0 | 100.0 | 3.3 | 94.9 | 7.5 |
| 44.4 | 96.0 | 4.4 | 97.6 | 2.2 | 62.5 | 104.5 | 3.6 | 104.1 | 6.6 |
| 14.8 | 98.8 | 1.8 | 99.7 | 3.0 | 31.3 | 104.5 | 1.6 | 105.4 | 2.9 |
| 4.9 | 105.1 | 9.7 | 105.1 | 3.8 | 15.6 | 90.8 | 5.6 | 89.9 | 2.9 |
| 1.6 | 120.0 | 5.1 | 124.6 | 6.0 | 7.8 | 89.1 | 7.1 | 87.0 | 4.6 |
Assay reproducibility and accuracy were determined by intra- and inter-assay percent recovery and coefficient of variation (CV, %).
Accuracy was assessed by the intra- and inter-assay percent recovery. The intra-assay percent recovery of the human samples ranged from 92.8% to 120.0% and of the rat samples ranged from 89.1% to 129.8% (Table 1). The inter-assay percent recovery of the human samples ranged from 97.6% to 124.6% and of the rat samples ranged from 87.0% to 130.8%. These data indicate that the assays exhibited good accuracy.
Plasma cytochrome c in healthy volunteers
Twenty-four samples had undetectable levels of cytochrome c and were coerced to the LLOD. Nineteen samples were below 36.0 ng/mL. One male volunteer, aged 60, had a plasma cytochrome c level of 406.9 ng/mL and another male volunteer, aged 31, had a level of 329.4 ng/mL. These 2 samples were considered outliers based on medcouple, a robust measure of skewness as described by Hubert and Vandervieren,26 and removed from the analysis resulting in an average cytochrome c level of 10.0 ± 17.3 ng/mL (Figure 4A). Multiple linear regression analysis indicated no significant relationship between cytochrome c and other variables such as age, sex, whether the volunteers were under any medication or vitamin or had been vaccinated, and whether they had a blood transfusion, needle stick, or were in contact with someone else’s blood 12 months prior to blood draw (P = .541).
Figure 4.

(A) Box and whisker plots depicting levels (ng/mL) of plasma cytochrome c in healthy volunteers (after eliminating 2 outliers identified by medcouple) and in trauma victims during admission (Adm). *P < .05 by t-test. (B) Plasma cytochrome c at admission and at the subsequent 24, 48, and 72 hours in trauma victims. Overall statistical significance was identified by 1-way repeated-measures analysis of variance (P = .04). *P = .03 denotes significant difference vs admission cytochrome c using Holm-Sidak test for multiple comparisons. (C) Plasma cytochrome c in cohorts of trauma victims according to the injury severity score (ISS). The numbers in brackets indicate sample size. (D) Scatterplot depicting a negative correlation between admission cytochrome c and survival probability of trauma victims estimated by Trauma Score–Injury Severity Score (TRISS), ie, survival probability (%) = 87.8·exp(–0.01·cytochrome c [ng/mL]). (E) Scatterplot depicting a positive correlation between admission cytochrome c and ISS, ie, ISS = 23.8 + 0.2·cytochrome c (ng/mL).
Plasma cytochrome c in trauma victims
Cytochrome c levels were significantly increased in trauma patients compared with healthy volunteers (Figure 4A), with the highest level on hospital admission, with the levels subsequently decreasing while in the intensive care unit (Figure 4B). Patients with an ISS ≥ 25 – previously associated with incremental risk of death27 – had higher admission cytochrome c levels compared with patients with ISS ≤ 24 but without achieving statistical significance (Figure 4C). The admission plasma cytochrome c was inversely correlated with the probability of survival predicted by the TRISS (Figure 4D). Plasma cytochrome c was also correlated with ISS but without achieving statistical significance (Figure 4E). Comparison of cytochrome c levels and organ dysfunction scores (qSOFA, SOFA, and MODS) at hospital admission and at the subsequent 24 and 48 hours showed a trend toward decreased organ dysfunction paralleled by decreased cytochrome c levels (Table 2). The availability of SOFA and MODS for only 1 patient at 72 hours precluded the comparison at that time point. Multiple linear regression analyses indicated no significant relationship between admission cytochrome c and other variables such as sex, survival to discharge, systolic blood pressure, base deficit, and transfusion (P = .950).
Table 2.
Cytochrome c and indicators of organ dysfunction in trauma patients.
| Initial | 24 hours | 48 hours | 72 hours | |
|---|---|---|---|---|
| Cytochrome c (ng/mL) | 23.7 ± 31.4[12] | 13.3 ± 14.6[12] | 5.2 ± 5.3[11]† | 3.8 ± 2.7[11]† |
| qSOFA | 1.5 ± 0.7[12] | 2.3 ± 0.7[12]† | 2.0 ± 0.7[12] | 2.0 ± 0.9[12]† |
| SOFA | 10.0 ± 2.8[7] | 9.6 ± 3.2[5] | 9.0[1] | |
| MODS | 9.0 ± 3.5[5] | 8.0 ± 5.3[3] | 10.0[1] |
Abbreviations: MODS, Multiple Organ Dysfunction Score; qSOFA, quick Sepsis-related Organ Failure Assessment; SOFA, Sepsis-related Organ Failure Assessment.
Values are mean ± SD. Numbers in brackets indicate sample size. Overall statistical significance by 1-way repeated-measures analysis of variance was noted for cytochrome c (P = .04) and for qSOFA (P = .009). †P = .03 after multiple comparisons only vs initial by Holm-Sidak test.
Plasma cytochrome c in rats after cardiac arrest
In Series I, plasma cytochrome c levels progressively increased at 60, 120, and 180 minutes post-resuscitation from baseline levels in vehicle control rats (Figure 5A). In Series II, plasma cytochrome c levels were markedly elevated at 120 minutes post-resuscitation in rats that received the vehicle/buffer, less in rats that received the ZNP/buffer, and substantially less in rats that received the ZNP/saline (Figure 5B). Also in Series II, cytochrome c levels at 120 minutes post-resuscitation were inversely proportional to cardiac work index (Figure 5C) and to survival after cardiac resuscitation (Figure 5D).
Figure 5.

(A) Box and whisker plots illustrating levels (ng/mL) of plasma cytochrome c at baseline (BL) and at 60, 120, and 180 minutes post-resuscitation in vehicle control rats from Series I. Overall statistical significance was demonstrated by 1-way repeated-measures (RM) analysis of variance (ANOVA) (P < .001). †P < .01; ‡P < .001 vs BL using Holm-Sidak test for multiple comparisons. (B) Box and whisker plots demonstrating levels (ng/mL) of plasma cytochrome c at 120 and 240 minutes post-resuscitation in rats that received the sodium-hydrogen exchanger isoform-1 (NHE-1) inhibitor zoniporide (ZNP) vehicle and sodium carbonate/bicarbonate buffer (vehicle/buffer), the ZNP and the buffer (ZNP/buffer), or the ZNP and normal saline (ZNP/saline) from Series II. Overall statistical significance was demonstrated by 2-way RM ANOVA (P = .026). *P < 0.05 using Holm-Sidak test for multiple comparisons only vs the vehicle/buffer group. Numbers in brackets indicate the sample size. (C) Scatterplot showing a negative correlation between cytochrome c and cardiac work index (CWI) at 120 minutes at post-resuscitation, ie, CWI (mm Hg·mL/kg) = 31.4 – 0.01·cytochrome c (ng/mL). (D) Scatterplot showing a negative correlation between cytochrome c levels at 120 minutes post-resuscitation and survival time, ie, survival (minutes) = 237.6 – 0.03·cytochrome c (ng/mL).
Discussion
We report a highly sensitive chemiluminescent ELISA assay developed to measure plasma cytochrome c in humans and rats. The ECL technique detected elevation of plasma cytochrome c in patients with blunt trauma upon admission with levels that correlated with injury severity. The same ECL technique – adapted to rat plasma – detected elevation of plasma cytochrome c after resuscitation from cardiac arrest with levels that inversely correlated with survival and responsiveness to mitochondrial protective interventions.
Our human and rat ECL assays required a very small sample volume and displayed a wide dynamic range markedly surpassing the performance of other available techniques. The assays had CVs <10% and <20% for intra- and inter-assay precision, respectively. This is in line with that reported for measurement of cytochrome c by other ELISA techniques. We have also shown reproducibility of the technique. As mentioned before, the ECL assays requires sulfo-tagged detection antibody. However, if the detection antibody is labelled with HRP or alkaline phosphatase (AP) – the 2 most commonly used enzymes in colorimetric ELISA – it can still be used for the ECL technique using a secondary detection antibody against HRP or AP which can be custom-labelled with sulfo-tag as shown in this study for the rat assay. Therefore, any ELISA technique for which an analyte-specific capture and detection antibodies are available, can be adapted to our ECL technique.
We compared our healthy control human cytochrome c values with other reported values acknowledging that different techniques may vary in their accuracy. For example, Sakaida et al28 employed an ECL technique with a Picolumi 8220 analyser and reported a value of 112.0 ± 57.0 pg/mL in healthy controls. This value is ~99% less than the levels in our study. These authors used capture and detection antibodies specific for rat cytochrome c instead of human cytochrome c and rat cytochrome c standard instead of human standard in their assay, possibly underestimating the human cytochrome c concentration. Their possible underestimation could be attributed to (1) use of rat antibodies to human cytochrome c leading to the formation of unstable antigen-antibody complex and (2) use of un-matched capture and detection antibodies leading to binding of the antibodies to overlapping epitopes on cytochrome c – opposed to non-overlapping epitopes – thereby interfering with one another binding and obscuring the detection. Ben-Ari et al13 reported using traditional ELISA control values of 39.9 ± 35.1 ng/mL, which are 4-fold higher than our values. They used human cytochrome c capture and detection antibodies, but the cytochrome c used for their standard curve was not reported. A recent report by Donnino et al23 applied an ECL technique based on MSD platform for cytochrome c measurement and reported a value of 0.7 ng/mL for healthy controls which is 14-fold less than our study. They used capture and detection antibodies specific for humans, but their standard human cytochrome c was obtained from eBioscience and ours was from Sigma, which could have explained the discrepancy. Moreover, their assay had a narrow dynamic range (0.03-25.0 ng/mL) comparable with traditional ELISA.
The rat cytochrome c levels observed in this study by ECL were consistent with the levels measured in our previous studies – also in rats – by HPLC.18,19 For example, the rat cytochrome c levels (ng/mL) determined using HPLC (228.2 ± 411.0; n = 29) from a set of baseline plasma samples were comparable to the levels determined using the ECL assay (253.1 ± 344.1; n = 28) from a different set of baseline plasma samples (Figure 6).
Figure 6.
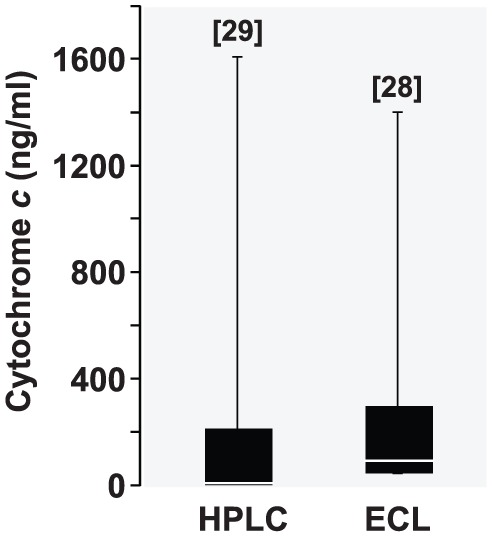
Box and whisker plots depicting cytochrome c levels (ng/mL) determined by high-performance liquid chromatography (HPLC) and the reported electrochemiluminescence (ECL) assay from 2 different sets of baseline rat plasma samples. The numbers in brackets indicate sample size.
We considered assessing the agreement of our human ECL assay with other techniques such as traditional ELISA and HPLC. However, to assess agreement between 2 different methods and to arrive at a clinically meaningful conclusion – eg, by the widely used Bland-Altman approach29 – a relatively larger sample size (~100 samples) is required. The approach involves quantification of the agreement between the 2 methods by calculating difference in their means (ie, ‘the bias’) and constructing 95% limits of agreement as the mean ± 2SD. The mean difference provides an estimate of whether the 2 methods, on average, return a similar result. The agreement between 2 methods is considered sufficient if the limits of agreement and their 95% confidence intervals are within 20%. Due to the large sample size limitation, we were unable to compare the reported ECL assay with the traditional ELISA.
In our study, admission cytochrome c levels were significantly increased in patients with blunt trauma. To our knowledge, this is the first report of cytochrome c release in trauma victims. Traumatic injury is likely to injure mitochondria in proportion to the severity of the individual organs affected, which can be compounded by accompanying haemorrhagic shock creating conditions for cytochrome c to be released to the cytosol and then to the bloodstream. Release of cytochrome c to the cytosol is expected to activate the mitochondrial apoptotic pathway and lead to cell death or reduction in cell function.30,31 Therefore, release of cytochrome c from the mitochondria to the bloodstream after trauma may not be ‘simply’ an epiphenomenon of mitochondrial injury but a central element of the pathophysiological process involved in organ injury and subsequent dysfunction. We documented a negative correlation between probability of survival predicted by TRISS and cytochrome c. Similarly, a negative correlation between ISS and cytochrome c was also demonstrated. Moreover, the patients with high ISS had higher levels of cytochrome c. Therefore, cytochrome c might emerge as a biomarker to predict survival in trauma patients if more samples are analysed. Prognostic value of cytochrome c has been established by other studies as well. Barczyk et al10 reported that death in cancer patients was associated with higher cytochrome c levels. Similarly, a recent study showed higher cytochrome c levels in patients with myocardial infarction who had higher in-hospital mortality.32
Cytochrome c may not only predict severity of mitochondrial injury but may also serve to identify efficacy of treatment interventions aimed at reducing mitochondrial injury. For example, post-resuscitation plasma cytochrome c levels were lower in rats treated with an NHE-1 inhibitor18 or with erythropoietin20 during cardiac resuscitation; interventions which ameliorated post-resuscitation myocardial dysfunction. The reverse may be true for interventions that intensify mitochondrial injury. For example, post-resuscitation plasma cytochrome c levels were higher in rats that received disodium carbonate/sodium carbonate buffer during cardiac resuscitation; intervention that was highly deleterious to myocardial function.21
Conclusions
The ECL assays developed for measuring cytochrome c in human and rat plasma display high sensitivity with a wide dynamic range facilitating cytochrome c determination under varying sample cytochrome c concentrations minimizing the need of sample dilution. The plasma cytochrome c level in trauma victims upon hospital admission was correlated with ISS and the plasma cytochrome c level in rats post-resuscitation was correlated with myocardial function and survival affected by mitochondria-targeted interventions.
Acknowledgments
We greatly appreciate the support of the James R. & Helen D. Russell Institute for Research & Innovation and the Advocate Lutheran General Hospital Trauma Team.
Footnotes
Funding:The author(s) disclosed receipt of the following financial support for the research, authorship, and/or publication of this article: This work was supported in part by a Chicago Medical School and Advocate Lutheran General Hospital Translational Research Pilot Grant Program.
Declaration of conflicting interests:The author(s) declared no potential conflicts of interest with respect to the research, authorship, and/or publication of this article.
Author Contributions: RJG conceived and designed the experiments. RO, GL, SN, and MS helped collecting trauma patient samples and provided clinical data. JR and RJG developed the ECL technique, analysed the data, wrote the first draft of the manuscript, and developed the structure and arguments for the paper. EC, SS, LL, AB, JR, MS, and RJG agree with manuscript results and conclusions. RJG made critical revisions and approved the final version. All authors reviewed and approved of the final manuscript.
Disclosures and Ethics: As a requirement of publication, author(s) have provided to the publisher signed confirmation of compliance with legal and ethical obligations including, but not limited to, the following: authorship and contributorship, conflicts of interest, privacy and confidentiality, and (where applicable) protection of human and animal research subjects. The authors have read and confirmed their agreement with the ICMJE authorship and conflict of interest criteria. The authors have also confirmed that this article is unique and not under consideration or published in any other publication and that they have permission from rights holders to reproduce any copyrighted material.
References
- 1. Von Harsdorf R, Li PF, Dietz R. Signaling pathways in reactive oxygen species-induced cardiomyocyte apoptosis. Circulation. 1999;99:2934–2941. [DOI] [PubMed] [Google Scholar]
- 2. Petrosillo G, Ruggiero FM, Pistolese M, Paradies G. Ca2+-induced reactive oxygen species production promotes cytochrome c release from rat liver mitochondria via mochondrial permeability transition (Mpt)-dependent and Mpt-independent mechanisms: role of cardiolipin. J Biol Chem. 2004;279:53103–53108. [DOI] [PubMed] [Google Scholar]
- 3. De Moissac D, Gurevich Rm, Zheng H, Singal PK, Kirshenbaum LA. Caspase activation and mitochondrial cytochrome c release during hypoxia-mediated apoptosis of adult ventricular myocytes. J Mol Cell Cardiol. 2000;32:53–63. [DOI] [PubMed] [Google Scholar]
- 4. Loor G, Kondapalli J, Iwase H, et al. Mitochondrial oxidant stress triggers cell death in simulated ischemia-reperfusion. Biochim Biophys Acta. 2011;1813:1382–1394. [DOI] [PMC free article] [PubMed] [Google Scholar]
- 5. Garcia-Dorado D, Gonzalez MA, Barrabes JA, et al. Prevention of ischemic rigor contracture during coronary occlusion by inhibition of Na(+)-H+ exchange. Cardiovasc Res. 1997;35:80–89. [DOI] [PubMed] [Google Scholar]
- 6. Renz A, Burek C, Mier W, Mozoluk M, Schulze-Osthoff K, Los M. Cytochrome c is rapidly extruded from apoptotic cells and detectable in serum of anticancer-drug treated tumor patients. Adv Exp Med Biol. 2001;495:331–334. [DOI] [PubMed] [Google Scholar]
- 7. Zager RA, Johnson AC, Hanson SY. Proximal tubular cytochrome c efflux: determinant, and potential marker, of mitochondrial injury. Kidney Int. 2004;65:2123–2134. [DOI] [PubMed] [Google Scholar]
- 8. Liu X, Xie W, Liu P, et al. Mechanism of the cardioprotection of rhEPO pretreatment on suppressing the inflammatory response in ischemia-reperfusion. Life Sci. 2006;78:2255–2264. [DOI] [PubMed] [Google Scholar]
- 9. Osaka A, Hasegawa H, Tsuruda K, et al. Serum cytochrome c to indicate the extent of ongoing tumor cell death. Int J Lab Hematol. 2009;31:307–314. [DOI] [PubMed] [Google Scholar]
- 10. Barczyk K, Kreuter M, Pryjma J, et al. Serum cytochrome c indicates in vivo apoptosis and can serve as a prognostic marker during cancer therapy. Int J Cancer. 2005;116:167–173. [DOI] [PubMed] [Google Scholar]
- 11. Alleyne T, Joseph J, Sampson V. Cytochrome-c detection: a diagnostic marker for myocardial infarction. Appl Biochem Biotechnol. 2001;90:97–105. [DOI] [PubMed] [Google Scholar]
- 12. Adachi N, Hirota M, Hamaguchi M, et al. Serum cytochrome c level as a prognostic indicator in patients with systemic inflammatory response syndrome. Clin Chim Acta. 2004;342:127–136. [DOI] [PubMed] [Google Scholar]
- 13. Ben-Ari Z, Schmilovotz-Weiss H, Belinki A, et al. Circulating soluble cytochrome c in liver disease as a marker of apoptosis. J Intern Med. 2003;254:168–175. [DOI] [PubMed] [Google Scholar]
- 14. Hosoya M, Nunoi H, Aoyama M, et al. Cytochrome c and tumor necrosis factor-alpha values in serum and cerebrospinal fluid of patients with influenza-associated encephalopathy. Pediatr Infect Dis J. 2005;24:467–470. [DOI] [PubMed] [Google Scholar]
- 15. Langs-Barlow A, Selvaraj S, Ogbuagu O, et al. Association of circulating cytochrome c with clinical manifestations of antiretroviral-induced toxicity. Mitochondrion. 2015;20:71–74. [DOI] [PMC free article] [PubMed] [Google Scholar]
- 16. Satchell MA, Lai Y, Kochanek PM, et al. Cytochrome c, a biomarker of apoptosis, is increased in cerebrospinal fluid from infants with inflicted brain injury from child abuse. J Cereb Blood Flow Metab. 2005;25:919–927. [DOI] [PubMed] [Google Scholar]
- 17. Small Dm, Gobe GC. Cytochrome c potential as a noninvasive biomarker of drug-induced acute kidney injury. Expert Opin Drug Metab Toxicol. 2012;8:655–664. [DOI] [PubMed] [Google Scholar]
- 18. Radhakrishnan J, Kolarova JD, Ayoub IM, Gazmuri RJ. AVE4454B – a novel sodium-hydrogen exchanger isoform-1 inhibitor – compared less effective than cariporide for resuscitation from cardiac arrest. Transl Res. 2011;157:71–80. [DOI] [PMC free article] [PubMed] [Google Scholar]
- 19. Radhakrishnan J, Wang S, Ayoub IM, Kolarova JD, Levine RF, Gazmuri RJ. Circulating levels of cytochrome c after resuscitation from cardiac arrest: a marker of mitochondrial injury and predictor of survival. Am J Physiol Heart Circ Physiol. 2007;292:H767–H775. [DOI] [PMC free article] [PubMed] [Google Scholar]
- 20. Radhakrishnan J, Upadhyaya MP, Ng M, et al. Erythropoietin facilitates resuscitation from ventricular fibrillation by signaling protection of mitochondrial bioenergetic function in rats. Am J Transl Res. 2013;5:316–326. [PMC free article] [PubMed] [Google Scholar]
- 21. Lamoureux L, Radhakrishnan J, Mason TG, Kraut JA, Gazmuri RJ. Adverse postresuscitation myocardial effects elicited by buffer-induced alkalemia ameliorated by NHE-1 inhibition in a rat model of ventricular fibrillation. J Appl Physiol. 1985;2016:1160–1168. [DOI] [PubMed] [Google Scholar]
- 22. Donnino MW, Mortensen SJ, Andersen LW, et al. Ubiquinol (reduced coenzyme Q10) in patients with severe sepsis or septic shock - a randomized, double-blind, placebo-controlled, pilot trial. Crit Care. 2015;19:275. [DOI] [PMC free article] [PubMed] [Google Scholar]
- 23. Donnino MW, Liu X, Andersen LW, et al. Characterization of mitochondrial injury after cardiac arrest (COMICA). Resuscitation. 2017;113:56–62. [DOI] [PMC free article] [PubMed] [Google Scholar]
- 24. Dixit CK, Vashist SK, MacCraith BD, O’Kennedy R. Multisubstrate-compatible ELISA procedures for rapid and high-sensitivity immunoassays. Nat Protoc. 2011;6:439–445. [DOI] [PubMed] [Google Scholar]
- 25. Braggio S, Barnaby RJ, Grossi P, et al. A strategy for validation of bioanalytical methods. J Pharm Biomed Anal. 1996;14:375–388. [DOI] [PubMed] [Google Scholar]
- 26. Hubert M, Vandervieren E. An adjusted box plot for skewed distributions. Comp Stat Data Anal. 2008;52:5186–5201. [Google Scholar]
- 27. Copes WS, Champion HR, Sacco WJ, et al. The injury severity score revisited. J Trauma. 1988;28:69–77. [DOI] [PubMed] [Google Scholar]
- 28. Sakaida I, Kimura T, Yamasaki T, et al. Cytochrome c is a possible new marker for fulminant hepatitis in humans. J Gastroenterol. 2005;40:179–185. [DOI] [PubMed] [Google Scholar]
- 29. Bland JM, Altman DG. Statistical methods for assessing agreement between two methods of clinical measurement. Lancet. 1986;1:307–310. [PubMed] [Google Scholar]
- 30. Narula J, Arbustini E, Chandrashekhar Y, Schwaiger M. Apoptosis and the systolic dysfunction in congestive heart failure. Story of apoptosis interruptus and zombie myocytes. Cardiol Clin. 2001;19:113–126. [DOI] [PubMed] [Google Scholar]
- 31. Communal C, Sumandea M, De Tombe P, Narula J, Solaro RJ, Hajjar RJ. Functional consequences of caspase activation in cardiac myocytes. Proc Natl Acad Sci U S A. 2002;99:6252–6256. [DOI] [PMC free article] [PubMed] [Google Scholar]
- 32. Marenzi G, Cosentino N, Boeddinghaus J, et al. Diagnostic and prognostic utility of circulating cytochrome c in acute myocardial infarction. Circ Res. 2016;119:1339–1346. [DOI] [PMC free article] [PubMed] [Google Scholar]