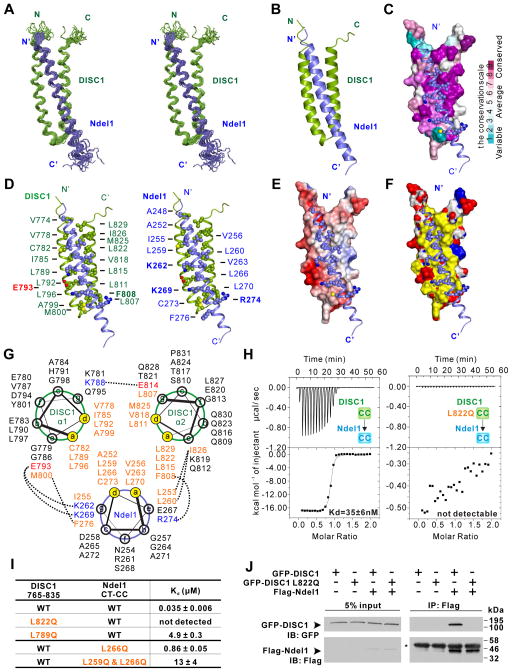
Figure 2. Structure of the DISC1/Ndel1 complex.
(A) Stereo view showing superposition of the backbones of 20 NMR structures of the DISC1 765–835 (green)/Ndel1 CT-CC (blue) complex with the lowest energies.
(B) Ribbon diagram of a representative NMR structure of the DISC1 765–835/Ndel1 CT-CC complex.
(C) Combined surface and ribbon representation showing the conservation map of the DISC1 and Ndel1 binding interface. The residues involved in DISC1/Ndel1 interaction interface are all evolutionarily conserved. In the surface diagram, the highly conserved amino acids are drawn in purple, the less conserved residues in cyan, as indicated in the bar diagram on the right.
(D) Stereo view showing the detailed interaction interface between DISC1 765–835 and Ndel1 CT-CC with combined ribbon and sphere representation. The residues labeled with bold face are involved in charge-charge interactions, whereas others are involved in hydrophobic interactions.
(E) Combined surface and ribbon representation showing the electrostatic potential of DISC1 binding interface for Ndel1. The ± 3-kT/e potential isocontours are shown as blue (positively charged) and red (negatively charged) surfaces, respectively.
(F) Combined surface and ribbon representation showing the hydrophobic interactions dominating the interface between DISC1 and Ndel1. In the surface diagram, hydrophobic residues are colored in yellow, positive charged residues are colored in blue and negative charged residues in red.
(G) Helical wheel representation showing the detailed interactions between the heptad repeats in the DISC1/Ndel1 complex. Residues at the a and d positions forming the hydrophobic core of the coiled coil are highlighted in orange. Residues forming electrostatic interactions are colored with blue for positively charged residues and red for negatively charge residues. Inter-helical interactions between the residues at the e and g (or even b) positions are depicted by dashed lines.
(H) ITC-based measurements quantifying the binding affinities between DISC1 765–835 WT (left panel) and L822Q (right panel) with Ndel1 CT-CC.
(I) ITC-based measurements comparing the binding affinities between DISC1 765–835 (WT or mutants) and Ndel1 CT-CC (WT or mutants). WT, wild type.
(J) Co-IP assay comparing bindings of full-length Ndel1 to the full-length WT DISC1 (or the L822Q mutant). Cell lysates from HEK293T cells transfected with the full-length Flag-Ndel1 and the full-length GFP-DISC1 WT (or L822Q mutant) respectively were mixed and immunoprecipitated by anti-Flag beads. The resulting immunoprecipitates were immunoblotted for DISC1 and Ndel1 as indicated. The heavy chain of Flag antibody on anti-Flag beads is indicated by an asterisk (*).
See also Figure S1, S2 and S3.

