Abstract
Objective
Assess the effect of a 50% discount on fruits and vegetables (F&V) on the purchase and intake of F&V and on psychosocial determinants of F&V intake: self-efficacy (SE), stages of change (SOC), and perceived barriers (PB).
Methods
This randomized controlled trial was conducted in local supermarkets over 16-weeks, including a 4-week baseline, 8-week discount intervention, and 4-week follow-up. Shoppers with overweight or obesity (BMI>25) were randomized to receive a discount or no discount via their reward scan card after the baseline. Twenty-four hour recalls and psychosocial measures were obtained for each study period.
Results
Purchases (p<0.0005) and intakes of F&V (p = 0.019) increased significantly during the intervention, only F&V intake was sustained at follow-up. The discount intervention increased SE (p<0.01) and SOC (p<0.05), and did not decrease PB (p = 0.057), during the intervention. SOC mediated the discount intervention effect on F&V intake (p<0.05) during the intervention, explaining 43% of variance.
Conclusion
A supermarket discount intervention led to increases in purchases and intakes of F&V, and the psychosocial factors SE and SOC, and did not decrease PB. The discount intervention prompted participants to move from the preparation to action stage of SOC, which acted as a mediator for increased F&V intake.
Keywords: randomized controlled trial, RCT, self-efficacy, stages of change, price discount, obesity, perceived barriers
Introduction
Despite evidence that fruit and vegetable (F&V) intake is associated with reduced risk of cardiovascular disease (1) and cancer (2), most Americans do not meet the consumption levels recommended by public health authorities (3,4). The challenge for Americans lies in translating dietary recommendations into dietary practice by making behavioral changes (4). To influence dietary practices and behavior, accumulating research suggests the use of economic incentives (5, 6, 7) given that the relatively high cost of F&V can impede purchasing and thus consumption (8,9). Diets that include F&V tend to be costlier compared to diets high in energy dense (ED) foods, which are rich in added sugars and fats (8). Environmental strategies designed to influence food choice through price discounts have shown promising results, with a significant effect on the purchasing of healthy food (7, 10–12), although intake was not examined.
More recently Geliebter et al (13) conducted a randomized controlled trial (RCT) to evaluate the purchases and food intakes of shoppers with BMI ≥25 following a discount intervention in two Manhattan supermarkets. The 16-week long trial consisted of a 4-week baseline, an 8-week intervention period with a 50 % discount on F&V (vs. no discount for the control group), and a 4-week follow-up with no discounts. The results showed that a 50% F&V discount led to more than 3-fold purchasing of F&V by the discount group as compared to the control group, and translated into a 50% increase in F&V intake, which was sustained after the discounts ended during the follow-up period. In that study, the role of psychosocial factors in relation to F&V purchase and intake was not examined.
Psychosocial factors are of interest as they can lead to behavioral changes. Social cognitive theory (14) suggests that opportunities and/or impediments (barriers) in the environment can have an impact on behaviors that support self-efficacy (SE) for behavioral change. For example, perceived SE or a belief in one’s ability to take control or action in difficult situations (15) can result in positive behavior changes, such as improved nutritional choices and higher intake of F&V (15–17). SE has been shown to mediate nutrition education and counseling intervention effects on F&V intake (18,19). Even among low socioeconomic status (SES) individuals, those who reported higher SE for F&V intake also reported fewer perceived barriers (PB) and had higher F&V intake (20).
Lastly, stages of change (SOC) (21) or the temporal readiness to transform health behavior (22) can be related to F&V intake (23). Prochaska and Velicer (21) examined self-efficacy and associated behavior change in the context of the transtheoretical model, which has been used to predict and alter addictive behaviors, especially cigarette smoking (23). The SOC construct views behavior change as a dynamic process with five distinct stages in a temporal continuum: 1. pre-contemplation – no intention of changing, 2. contemplation – thinking about changing, 3. preparation – planning to change and making small attempts, 4. action – actively involved in changing, 5. maintenance – maintaining changes for at least six months (23). Van Duyn and colleagues (24) showed that SOC for intake of F&V significantly predicted F&V consumption. Similarly, Di Noia (22) reported that higher intake of F&V can be predicted by SOC, i.e., those in the action and maintenance stages had higher F&V consumption than those in the pre-contemplation stage. Additionally, Campbell et al (25) found that SE for eating five servings a day of F&V was highly correlated with SOC. Most of these studies examined the psychosocial factors (SE, PB, and SOC) in relation to F&V intake from an individual education/counseling approach, and population-based research in this area is limited. Therefore, the current study was designed to examine SE and SOC for F&V intake, and PB, when a perceived economic barrier (high cost) is removed via a discount intervention.
The present study represents an expansion of the Geliebter et al (13) study to examine the effect of a discount intervention on purchasing, intake, as well as on psychosocial factors. We hypothesized that the discount intervention would result in increased purchasing and intake of F&V, increased SE and SOC for F&V intake, and decreased PB. We also hypothesized that SE, SOC, and PB would mediate the intervention effect on F&V intake.
Methods
Study Design
The study was an RCT allocating participants within each store to the intervention and control group. The intervention (or discount) group (n=24) received a 50% discount on selected F&V during an 8-week period, and the control group (n=21) received no discount. As an expansion of Geliebter et al (13), the study design was identical except for the addition of psychosocial measures and two additional local D’Agostino supermarkets for data collection (for detailed methods, see Supporting Information). All participants signed consent forms, and the study was approved by the St. Luke’s-Roosevelt IRB. The study was also registered with ClinicalTrials.gov.
Protocol
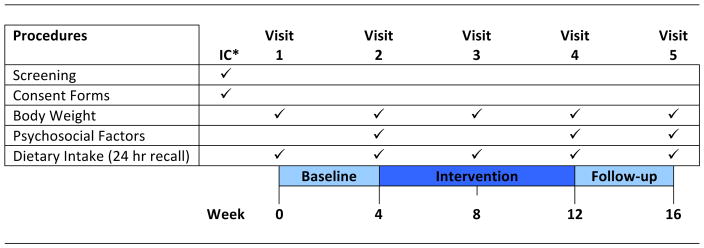
Both study groups participated in three sequential study periods: a 4-week baseline, an 8-week intervention, and a 4-week follow-up, when prices reverted to the original level for the discount group. F&V intake and psychosocial measures (SE, SOC, and PB) were obtained according to the study timeline in Figure 1. Purchasing data was collected at the point of participant purchase from Week 0 to Week 16 via the store scan cards. Price reductions were automatically applied for the discount group for the 8-week intervention period by programming the scan cards. Participants were informed of their discount versus no discount group assignment just before the start of the 8-week intervention.
Figure 1.
Study procedures conducted at various assessment time points over the three study time periods.
*IC refers to initial consultation.
Inclusion/Exclusion Criteria
Participants had to sign an agreement to shop for all their groceries exclusively at their local D’Agostino supermarket for the duration of the study. Participants had to be the primary food shopper in their households, shopping for up to one other person. Participants were requested to not deliberately try to lose weight for the duration of the study.
Recruitment
Overweight or obese shoppers were recruited from four D’Agostino Supermarkets in Manhattan, NYC, via a F&V sample cart in the store and study advertisements printed on their grocery purchase receipts.
Participants
Dataset
The study dataset included a subset (~ 50%) of previous subject data from the Geliebter et al (13) study as measures of psychosocial factors of F&V intake were adopted about halfway in that study, and an additional cohort that followed the original one, not previously reported. Characteristics of the additional cohort did not differ from the previous cohort except for the new cohort being somewhat older (M = 44.9 y.o., SD= 13.5) than the previous cohort (M = 35.1 y.o., SD= 11.9) (data not shown).
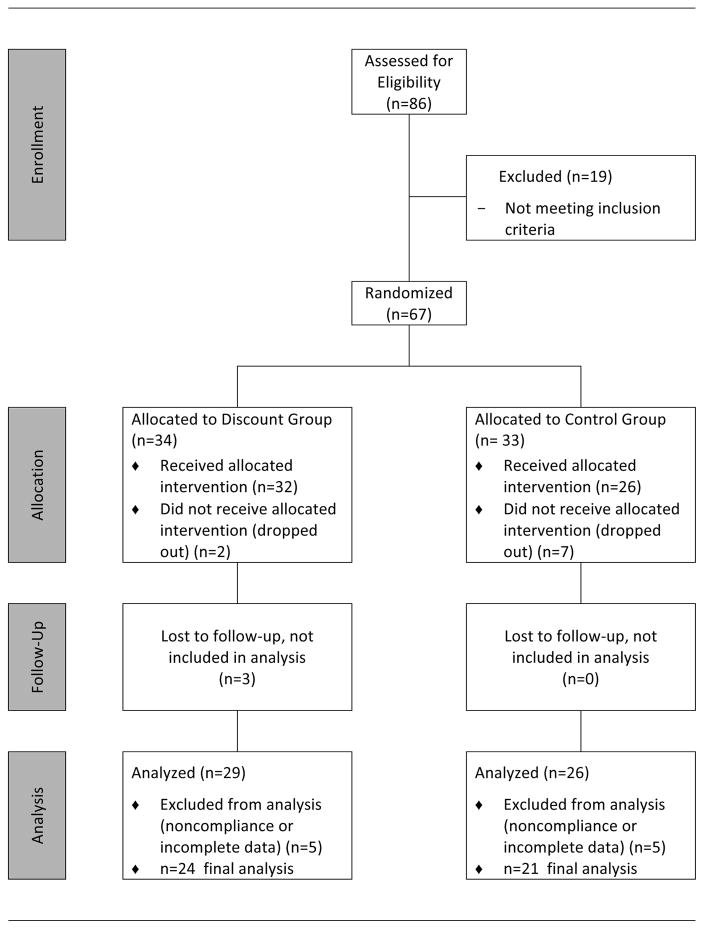
Of the 85 overweight (BMI≥25) or obese (BMI≥30) individuals recruited, 67 qualified and were enrolled in the study, and 9 dropped out prior to the intervention period (Figure 2). Dropout rates differed by study condition (discount: 3%: control: 21%), which could be due in part to participants being told just prior to the intervention period that they were randomized into the control group and would not be receiving discounts. Only those who completed all three study periods were included in the analyses. The final number of participants included in the analysis was 45 (34 females, 11 males): 24 in the discount group and 21 in the control group. The mean BMI was 30.0 (SD = 4.45; range 24.1 to 41.3 kg/m2), and the mean age was 39.4 years (SD=13.4; range 22 to 63 years). Of these, 68.9% were Caucasian, 13.3% African American, 11.1% Hispanic, 4.4% Asian, and 2.4% selected “Other”. The baseline characteristics of the discount and control groups did not differ and are presented in Table 1.
Figure 2.
Consolidated Standards of Reporting Trials flow diagram for participant enrollment, intervention allocation, follow-up, and data analysis.
Table 1.
Baseline participant characteristics for discount (intervention) and control groups
| Characteristics | Discount | Control | Significance of P values |
|---|---|---|---|
| Age, mean (SD), y | 39.3 (14.1) | 39.6 (12.9) | NS |
| BMI, mean (SD), kg m−2 | 29.8 (5) | 30.6 (5.0) | NS |
| Gender, no. (%) | NS | ||
| Female | 18 (75%) | 16 (76.2%) | |
| Male | 6 (25%) | 5 (23.8%) | |
| Ethnicity | NS | ||
| African-American | 2 (8.3%) | 4 (19%) | |
| Caucasian | 18 (75%) | 13 (61.9%) | |
| Hispanic | 3 (12.5%) | 2 (9.5%) | |
| Asian | 0 (0%) | 2 (9.5%) | |
| Other | 1 (4.2%) | 0 (0%) | |
| Income, no. (%) | NS | ||
| $0 to $19,999 | 2 (8.3%) | 5 (23.8%) | |
| $20,000 to $39,999 | 7 (29.2%) | 4 (19%) | |
| $40,000 to $59,999 | 4 (16.7%) | 5 (23.8%) | |
| $60,000 to $79,999 | 5 (20.8%) | 3(14.3%) | |
| $80,000 to $99,999 | 1 (4.2%) | 2 (9.5%) | |
| $100,000 and over | 5 (20.8%) | 2 (9.5%) | |
| Education, no. (%) | NS | ||
| High School | 1 (4.3%) | 0 (0%) | |
| College Student | 0 (0%) | 1 (4.8%) | |
| Associate’s of Arts | 1 (4.3%) | 2 (9.5%) | |
| BA/BS | 10 (43.5%) | 10 (47.6%) | |
| MA/MS | 6 (26.1%) | 6 (28.8%) | |
| PHD/MD/JD/EdD | 5 (21.7%) | 2 (9.5%) |
NS – not significant
Measures
Purchasing data
Purchases were referenced by the participant’s scan card number and analyzed by study period as mean weekly gross dollar purchases of discounted and non-discounted items. Gross dollar value, or the price before discount, allowed for accurate comparisons between intervention and control groups.
Dietary intake data
A twenty-hour recall of food intake was obtained in person every 4 weeks as per the Geliebter et al (13) protocol.
Psychosocial factors of fruit and vegetable intake
The University of California Fruit and Vegetable Inventory (FVI) (26–28) is comprised of 13 items assessing six constructs that have been shown to be related to F&V intake: perceived benefits to eating F&V, perceived control, SE for eating F&V, SOC to eat more fruit, SOC to eat more vegetables, and perceived diet quality (27). FVI subscales have good internal reliability (Cronbach’s alpha = .75 –.87), cross-sectional associations with F&V intake, and correlations between changes in self-reported intake of F&V (from the FVI) with serum carotenoids following a nutrition education intervention (26, 28). Two subscales from the validated FVI were used to assess SE and SOC. SE for F&V intake is a subscale consisting of six items (questions 3 to 8), with responses (disagree=0 and agree=2) that are summed to obtain a score with a range of 0 – 12; higher scores represent increasing SE. The SE subscale measures one’s belief that one can buy more and include more F&V in meals and snacks. SOC is represented by two items of the FVI (questions 12 & 13) that assess where on the 5 stages of change continuum the participant lies in readiness to increase consumption of F&V (one item is about readiness to change fruit intake and the other to change vegetable intake, which were combined). Scores range from 2 to 10; Stage 1 pre-contemplation (not thinking about increasing) = 2, stage 2 contemplation (thinking about increasing within the next 6 months) = 4, stage 3 preparation (definitely planning to increase in the next month) = 6, stage 4 action (trying to increase now) = 8, and stage 5 maintenance (already eating 3 or more servings per day) = 10. The PB scale is comprised of 10 items (questions 14 to 23) that are summed to obtain a total score with a range from 1 – 10. Higher score represents increasing PB. The psychosocial constructs measured in the current study are well-established predictors of F&V intake (29–31) and are associated with changes in consumption following interventions (3, 28).
Statistical Analyses
Mixed-design ANOVA with repeated measures was used to analyze the main effects over time and the interaction between group (discount vs. control) and time, on purchasing and intake. Income ($) level, based on a median split, also served as a grouping factor for a separate analysis. When the overall ANOVA showed significance (P<0.05), posthoc tests were used to analyze specific changes. Behavioral outcome measures included: weekly purchasing of discounted F&V (gross $ or the nondiscounted prices) and intake of F&V (g; number of servings). Two-tailed P values <0.05 were required for statistical significance. The Statistical Package for the Social Sciences version 22.0 was used.
Structural Equation Modeling (SEM) was employed to examine the impact of discount intervention on psychosocial measures: SE, SOC, and PB, and their role as potential mediators of F&V intake. Analyses were performed for the psychosocial measures at the end of the intervention period, controlling for baseline pre-intervention measures.
Mediation analysis
Model specification
A two-step model was constructed to examine mediation effects. All potential mediating variables between intervention and behavioral outcomes were included in a basic multiple mediator model at once, and then non-significant psychosocial variables were dropped, leaving only significant variables in the final model.
Model fit
Mediation analysis models were tested with Amos™ v.23. Analyses were performed using maximum-likelihood estimation. Model fit was assessed with multiple indices, including Chi-square, Root Mean Square Error of Approximation (RMSEA), Confirmatory Factor Index (CFI), and The Lewis Index (TLI). Non-significant Chi-square, RMSEA ≤ 0.06, CFI > 0.90, TLI > 0.90 were considered acceptable for model fit (32).
Results
Purchasing of Fruit and Vegetables
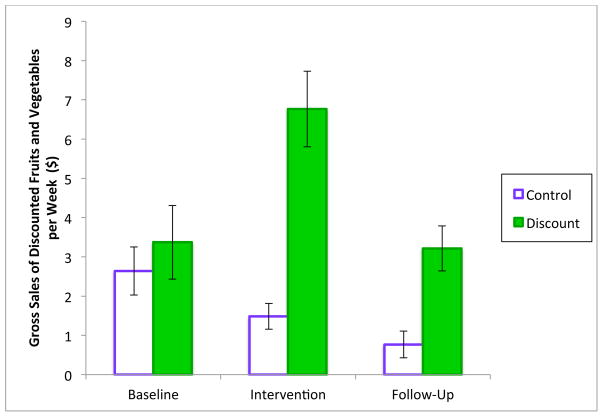
Over the three time periods of baseline, intervention, and follow-up, the repeated measures ANOVA showed a significant effect of time on gross weekly purchasing of discounted F&V, F(2,86)=7.1, P=0.001, and a significant group-by-time interaction, F(2,86)=8.2, P=0.001 (See Figure 3). Purchasing (gross weekly) of discounted F&V by the discount group ($6.83, SD=$4.92) during the intervention period was 4.6 times that of the control group ($1.48, SD=$1.50). Post-hoc tests showed that the weekly gross purchasing of discounted F&V by the discount group increased twofold from the baseline ($3.42, SD=$4.79) to the intervention period ($6.83, SD=$4.92), t(23)=5.3, P<0.0005, and decreased from the intervention to the follow-up period ($3.26, SD=$2.92), t(23)=−3.4, P=0.002, to a value not significantly different from the baseline period (P=0.88). For the control group, however, weekly gross spending on discounted F&V did not change significantly from the baseline period ($2.64, SD=$2.81) to the intervention period ($1.48, SD=$1.50), P=0.06, or from the intervention period to the follow-up period, ($0.77, SD=$1.56), P=0.10. Post-hoc comparisons of the two groups showed a significant group-by-time interaction, between the baseline and the intervention period, F(1,43)=27, P<0.0005, between the intervention and follow-up period, F(1,43)=5.8, P=0.021, but not between the baseline and follow-up period, F(1,43)=1.7, P=0.20, indicating an absence of a sustained effect of the intervention on spending for F&V during the follow up period.
Figure 3.
Gross (price before discounts) weekly purchasing of discounted fruits and vegetables during baseline, intervention, and follow-up periods. The discount group increased purchasing during the intervention period (P < 0.0005) when prices were reduced, relative to the control group, and then decreased purchasing during the follow-up (P = 0.002) (mean ± 1 standard error of the mean).
Fruit and Vegetable Intake from 24-hr Recalls
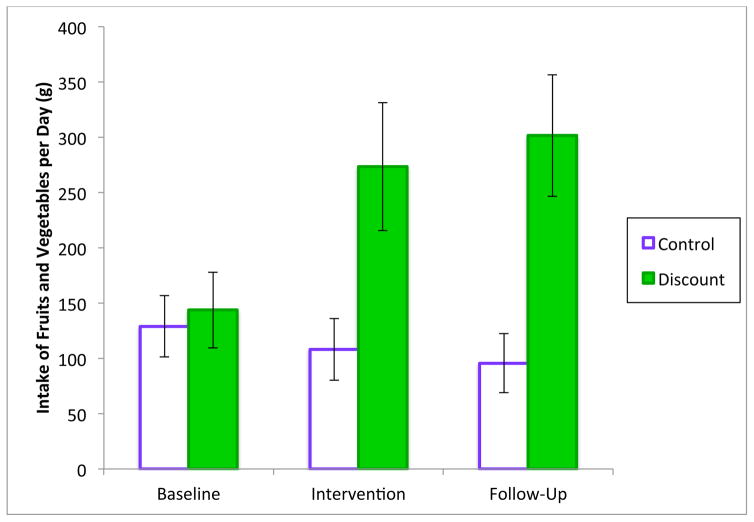
Over the three time periods, there was no overall significant effect of time on F&V intake, F(2,86)=2.0, P=0.14, but the group-by-time interaction was significant, F(2,86)=4.8, P=0.011 (See Figure 4). F&V intake of the discount group (269 g [3.4 servings], SD=294 g), was 2.5 times greater than the control group (108 g [1.4 servings], SD=128 g) during the intervention period. Post-hoc tests showed that the F&V intake of the discount group increased nearly twofold from the baseline period (150 g, SD=172 g) to the intervention period (269 g, SD=294 g), t(23)=2.5, P=0.019, and did not change significantly from the intervention to the follow-up (302 g, SD=275 g), P=0.62, but remained at a level significantly higher than the baseline t(23)=3.1, P=0.006. For the control group, however, F&V intake did not change significantly from the baseline period (129 g, SD=127 g) to the intervention period (108 g, SD=128 g), P=0.48, or from the intervention period to the follow-up period, (96 g, SD=123 g), P=0.70. Post-hoc comparisons of the two groups showed a significant group-by-time interaction between the baseline and intervention period, F(1,43)=6.0, P=0.019, but not between the intervention and the follow-up, F(1,43)=0.37, P=0.55, and also a significant interaction between the baseline and follow-up, F(1,43)=9.9, P=0.003, indicating a sustained intervention effect on intake during the follow-up period.
Figure 4.
Fruit and vegetable intake during baseline, intervention, and follow-up periods. Fruit and vegetable intake increased (p=0.019) during the intervention period in the discount group relative to the control group and was sustained during the follow up period (P=0.003). (mean ± 1 standard error of the mean).
The intake of discounted F&V within the discount group during the intervention period correlated significantly with gross weekly purchasing of the discounted items (r=0.48, P=0.019) during that period. By contrast, the intake of discounted F&V within the control group during the intervention period was not correlated with gross weekly purchasing of the discounted items (r=0.18, P=0.44).
Income
Across all participants during baseline, higher income participants (n=18) (based on a median split of personal income category) compared to lower income participants (n=27) did not differ in gross purchasing of the subsequently discounted F&V ($3.49, SD=$2.92 vs. $2.77, SD=$4.57, p>0.05), and did not differ in total weekly purchasing of all items at the supermarket ($45.49, SD=$47.78 vs. $49.32, SD=$37.25, p >0.05). Within the discount group, higher income participants (n=11) compared to lower income participants (n=13) did not differ in gross purchasing of discounted F&V during baseline ($2.86, SD=$2.42 vs. $3.90, SD=$6.22, p>0.05) and during intervention ($7.00, SD=$4.22 vs. $6.69, SD=$5.61, p>0.05).
Psychosocial Measures
Intervention and mediation effects
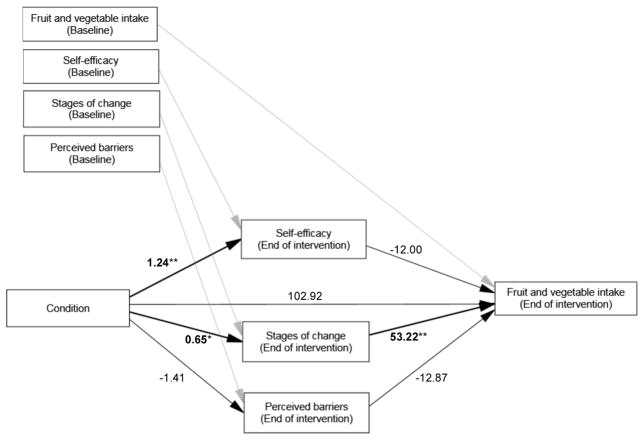
The results of the first basic multiple mediator model are illustrated in Figure 5. Model fit indices were Chi-square=20.99 (p=0.59); RMSEA<0.01; CFI=1.00; and TLI=1.00, indicating a good fit. Controlling for baseline variables, the intervention (discount condition vs. control) significantly increased SE (p<0.01) and SOC (p<0.05), and the decrease in PB was not significant (p = 0.057). At the end of the intervention, the intervention group had 1.24 higher SE score than the control group, a 0.65 higher SOC score than the control group, and 1.41 lower PB score than the control group. At baseline, SOC was at the preparation stage (control group 7.75, SD= 1.16, discount group 7.64, SD= 1.62) and after the intervention, the discount group entered the action stage (8.00, SD = 1.20) while the control group remained in the preparation stage (7.43, SD= 1.03). Of the psychosocial factors, only SOC had a significant mediation effect on F&V intake (p<0.05).
Figure 5.
Basic multiple mediator model of psychosocial outcome measures at end of intervention on F&V intake. Error terms for all outcome measures were included in the analysis but omitted in this figure. Values are β values, p-values <0.05 are denoted with an asterisk (*), and p-values <0.01 are denoted with a double asterisk (**). “Condition” represents discount group versus control group. All variables were controlled by baseline covariates (in upper left boxes) which are connected by grey arrows to the variables. At the end of the intervention, the intervention group had 1.24 higher SE score than the control group (p<0.01), a 0.65 higher SOC score than the control group (p<0.05), and a PB score 1.41 lower than the control group (p=0.057).
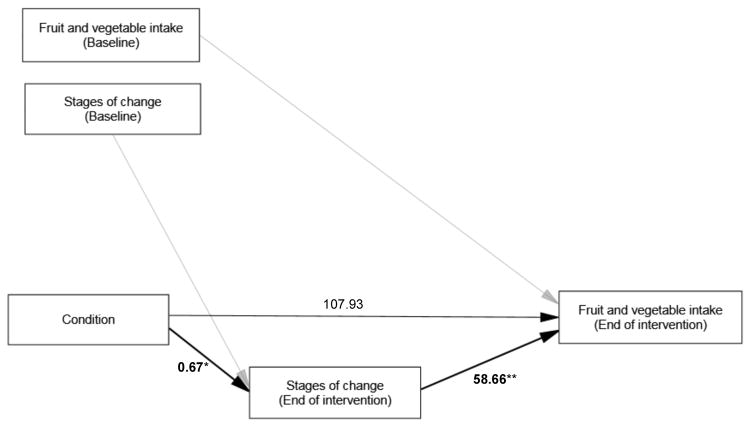
In the next step, non-significant mediating variables were dropped, and the model re-examined for the mediation effect of SOC on F&V intake. The model fit indices for this model were Chi-square=2.91 (p=0.573); RMSEA<0.01; CFI=1.00; and TLI=1.00, indicating a good fit. As shown in Figure 6, SOC significantly mediated the intervention effect on F&V intake (p<0.05). When SOC was entered into the model, the intervention effect on F&V intake was no longer significant (p=0.081), reflecting a mediating effect of SOC on F&V intake. The intervention group had 0.67 higher score on SOC compared to the control group, and every score increase in SOC positively impacted F&V intake by 58.7g. The intervention group moved from planning to increase F&V intake (preparation stage) to trying to increase their F&V intake (action stage). This mediation model explained 43% of the variance in F&V intake.
Figure 6.
Final model showing significant mediation effect of stage of change (SOC) at end of intervention on F&V intake. Error terms for all outcome measures were included in the analysis but omitted in this figure. Values are β values, p-values <0.05 are denoted with an asterisk (*), and p-values <0.01 are denoted with a double asterisk (**). “Condition” represents discount group versus control group. All variables were controlled by baseline covariates (in upper left boxes) which are connected by grey arrows to the variables.
Discussion
As expected, the discount group purchased more F&V during the intervention period and reverted towards baseline purchasing when the discount ceased. The finding of increased purchasing of F&V in the current study is consistent with other studies that utilized price reduction to influence food purchasing (7, 10–13). At baseline, there were no differences based on income for purchasing of F&V (that were subsequently discounted), likely because participants regardless of income were spending relatively little on F&V. The discount intervention also similarly influenced purchasing by income categories. There was also an increase in intake of F&V during the intervention, and maintenance of the intake during follow up after the discount was removed, similar to the previous study by Geliebter et al (13). The increased F&V intake occurred despite a decrease in F&V purchasing to baseline levels. It is possible that participants in the discount group stocked up on durable F&V during the discount period and continued consuming these F&V at follow up, and/or increased their F&V intake in settings such as restaurants and other social gathering sites.
Intervention Effect and Psychosocial Factors
Self-efficacy (SE) for F&V intake
As expected, participants receiving the discount showed an increase in SE for F&V intake during the intervention relative to controls. The increased SE findings are consistent with interventional studies to increase F&V intake, in which SE was associated with increased F&V intake (15–17). Previous studies used individual-based interventional approaches that utilized education and counseling protocols to increase SE and F&V intake. This is the first study to demonstrate that a population-based discount intervention increases SE for F&V intake.
According to Bandura (14), practicing a behavior is the most important factor in developing SE for the behavior. Theoretically, the discount provided an incentive to purchase more F&V and an opportunity to practice consuming more F&V, which is likely to have increased SE for F&V intake while the discount was in effect.
Stages of change (SOC) for F&V Intake
The discount intervention also led to an increase in SOC for F&V intake. Increases in SE have been shown to usually occur in the later SOC (i.e., preparation, action, maintenance) (4, 22). Our sample was in the preparation stage for SOC prior to receiving the discount, and therefore primed to increase SE for intake of F&V. The increase in SOC to the action stage for the discount group during the discount intervention was concurrent with the increase in SE. The relationship between SOC and SE may have an important influence on adopting healthy eating behaviors in population-based environmental discount interventions. This study showed that a population-based discount intervention also increased SOC for F&V intake.
Perceived barriers (PB)
Social Cognitive Theory posits that there are barriers in the environment that affect health behaviors, and in the case of F&V intake, cost was a barrier that was temporarily removed by the study’s discount intervention. The finding that the discount intervention did not significantly decrease participant PB for the intake of F&V suggests participants realized the discount was temporary. Nevertheless, despite continued perception of the existence of barriers to the intake of F&V, the discount intervention prompted participants to consume more F&V during the intervention.
The discount intervention led to increases in SE and SOC, and only SOC was found to be a mediator of the discount intervention effect on F&V intake. Participants who received the discount moved up from preparation to the action SOC, and their intake of F&V increased. These findings are consistent with other studies that found SOC to be associated with F&V intake (16, 17, 24) and a mediator of an educational intervention effect on F&V intake (33). Contrary to other studies that found SE to be mediators of educational/counseling intervention effects on F&V intake (16, 18), our study did not find SE to be a mediator of a discount intervention effect on F&V intake. Perhaps psychosocial determinants of F&V intake respond differentially to intervention type (i.e. education/counseling versus price discount).
Limitations
Challenges in complying with study requirements may have contributed to the loss of participants for analysis. Also, since participants were not blinded to the discount, disappointment in not receiving the discount could have led to decreases in SE in the control group. Baseline to intervention comparisons for the control group showed a significant decrease for SE but not for SOC. Analysis of psychosocial factors was restricted to baseline and intervention due to power limitations. Lastly, participants were from an urban area and overweight or obese; thus results may not generalize to nonurban or normal weight individuals.
Conclusion
In summary, the discount intervention resulted in increased purchases and intakes of F&V and led to increased SE and SOC for F&V intake, while perceived barriers did not decrease significantly; and F&V intake was maintained after the discount ceased. The finding that SOC was a mediator for F&V intake augments other findings from studies not involving economic incentives to increase F&V intake. These study findings support further consideration for implementation of subsidies/discounts on F&V to motivate changes in dietary intake.
Supplementary Material
What is already known about this subject?
discounts/subsidies on fruit and vegetables (F&V) increase F&V purchase
discount/subsidies on F&V increase F&V intake
high self-efficacy and higher stages of change are associated with increased F&V intake
What does this study add?
reveals the role of psychosocial factors on the impact of a price discount intervention on F&V intake.
shows that stages of change mediates the discount intervention effect on increased F&V intake
Acknowledgments
We thank Heewon Lee Gray, PhD, for performing the mediation analyses, Dominica Hernandez, PhD and Beatriz Cole, for serving as research coordinators, Martica Heaner, PhD and Damien Hsu, PhD for providing nutritional consultations to subjects at the end of the study, Ewelina Swierad and Melinda Smith. We would also like to thank D’Agostino Supermarkets and their team, particularly CEO, Nicholas D’Agostino, III, and Bill Bergen, Bobby Del Sole, and Scott Allen.
The study was supported in part by NIH grant 1R01DK105440 (AG); the Robert Wood Johnson Foundation and the Columbia University Institute for Social and Economic Research and Policy (AG and MBK); and by Western New England University, College of Pharmacy (SK).
Footnotes
Study is registered with ClinicalTrials.gov NCT01509664
The authors declared no conflict of interest.
References
- 1.Ness AR, Powles JW. Fruit and vegetables, and cardiovascular disease: a review. Int J Epidemiol. 1997;26(1):1–13. doi: 10.1093/ije/26.1.1. Review. [DOI] [PubMed] [Google Scholar]
- 2.Steinmetz KA, Potter JD. Vegetables, fruit, and cancer prevention: a review. J Am Diet Assoc. 1996;96(10):1027–39. doi: 10.1016/S0002-8223(96)00273-8. Review. [DOI] [PubMed] [Google Scholar]
- 3.Bogers RP, Assema Pv, Brug J, Kester AD, Dagnelie PC. Psychosocial predictors of increases in fruit and vegetable consumption. Am J Health Behav. 2007;31(2):135–45. doi: 10.5555/ajhb.2007.31.2.135. [DOI] [PubMed] [Google Scholar]
- 4.Ma J, Betts NM, Horacek T, Georgiou C, White A. Assessing stages of change for fruit and vegetable intake in young adults: a combination of traditional staging algorithms and food-frequency questionnaires. Health Educ Res. 2003;18(2):224–36. doi: 10.1093/her/18.2.224. [DOI] [PubMed] [Google Scholar]
- 5.Giuffrida A, Torgerson DJ. Should we pay the patient? Review of financial incentives to enhance patient compliance. BMJ. 1997;315(7110):703–7. doi: 10.1136/bmj.315.7110.703. Review. [DOI] [PMC free article] [PubMed] [Google Scholar]
- 6.Kane RL, Johnson PE, Town RJ, Butler M. A structured review of the effect of economic incentives on consumers’ preventive behavior. Am J Prev Med. 2004;27(4):327–52. doi: 10.1016/j.amepre.2004.07.002. [DOI] [PubMed] [Google Scholar]
- 7.Ni Mhurchu C, Blakely T, Jiang Y, Eyles HC, Rodgers A. Effects of price discounts and tailored nutrition education on supermarket purchases: a randomized controlled trial. Am J Clin Nutr. 2010;91(3):736–47. doi: 10.3945/ajcn.2009.28742. [DOI] [PubMed] [Google Scholar]
- 8.Drewnowski A, Rolls BJ. How to modify the food environment. J Nutr. 2005;135(4):898–9. doi: 10.1093/jn/135.4.898. [DOI] [PubMed] [Google Scholar]
- 9.Yeh MC, Ickes SB, Lowenstein LM, et al. Understanding barriers and facilitators of fruit and vegetable consumption among a diverse multi-ethnic population in the USA. Health Promot Int. 2008;23(1):42–51. doi: 10.1093/heapro/dam044. [DOI] [PubMed] [Google Scholar]
- 10.French SA, Story M, Jeffery RW, et al. Pricing strategy to promote fruit and vegetable purchase in high school cafeterias. J Am Diet Assoc. 1997;97:1008–1010. doi: 10.1016/S0002-8223(97)00242-3. [DOI] [PubMed] [Google Scholar]
- 11.French SA, Jeffery RW, Story M, et al. A pricing strategy to promote low-fat snack choices through vending machines. Am J Public Health. 1997;87:849–851. doi: 10.2105/ajph.87.5.849. [DOI] [PMC free article] [PubMed] [Google Scholar]
- 12.French SA, Jeffery RW, Story M, et al. Pricing and promotion effects on low-fat vending snack purchases: the CHIPS Study. Am J Public Health. 2001;91:112–117. doi: 10.2105/ajph.91.1.112. [DOI] [PMC free article] [PubMed] [Google Scholar]
- 13.Geliebter A, Ang IY, Bernales-Korins M, et al. Supermarket discounts of low-energy density foods: effects on purchasing, food intake, and body weight. Obesity. 2013;21(12):E542–8. doi: 10.1002/oby.20484. [DOI] [PubMed] [Google Scholar]
- 14.Bandura A. Self-efficacy: The exercise of control. New York, NY: Freeman; 1997. [Google Scholar]
- 15.Luszczynska A, Tryburcy M, Schwarzer R. Improving fruit and vegetable consumption: a self-efficacy intervention compared with a combined self-efficacy and planning intervention. Health Educ Res. 2007;22(5):630–8. doi: 10.1093/her/cyl133. [DOI] [PubMed] [Google Scholar]
- 16.Contento IR, Randell JS, Basch CE. Review and analysis of evaluation measures used in nutrition education intervention research. J Nutr Educ Behav. 2002;34(1):2–25. doi: 10.1016/s1499-4046(06)60220-0. Review. [DOI] [PubMed] [Google Scholar]
- 17.Resnicow K, Wallace DC, Jackson A, et al. Dietary change through African American churches: baseline results and program description of the eat for life trial. J Cancer Educ. 2000;15(3):156–63. doi: 10.1080/08858190009528685. [DOI] [PubMed] [Google Scholar]
- 18.Fuemmeler B, Mâsse L, Yaroch, et al. Psychosocial mediation of fruit and vegetable consumption in the body and soul effectiveness trial. Health Psychol. 2006;25(4):474–483. doi: 10.1037/0278-6133.25.4.474. [DOI] [PubMed] [Google Scholar]
- 19.Campbell MK, McLerran D, Turner-McGrievy G, et al. Mediation of adult fruit and vegetable consumption in the National 5 A Day for Better Health Community Studies. Ann Behav Med. 2008;35(1):49–60. doi: 10.1007/s12160-007-9002-y. [DOI] [PubMed] [Google Scholar]
- 20.Bruening M, Kubik MY, Kenyon D, Davey C, Story M. Perceived barriers mediate association between self-efficacy and fruit and vegetable consumption among students attending alternative high schools. J Am Diet Assoc. 2010;110(10):1542–6. doi: 10.1016/j.jada.2010.07.001. [DOI] [PMC free article] [PubMed] [Google Scholar]
- 21.Prochaska JO, Velicer WF. The transtheoretical model of health behavior change. Am J Health Promot. 1997;12:38–48. doi: 10.4278/0890-1171-12.1.38. [DOI] [PubMed] [Google Scholar]
- 22.Di Noia J, Schinke SP, Prochaska JO, Contento IR. Application of the transtheoretical model to fruit and vegetable consumption among economically disadvantaged African-American adolescents: preliminary findings. Am J Health Promot. 2006;20(5):342–8. doi: 10.4278/0890-1171-20.5.342. [DOI] [PMC free article] [PubMed] [Google Scholar]
- 23.Ma J, Betts NM, Horacek T, Georgiou C, White A, Nitzke S. The Importance of Decisional Balance and Self-efficacy in Relation to Stages of Change for Fruit and Vegetable Intakes by Young Adults. Am J Health Promot. 2002;16(3):157–166. doi: 10.4278/0890-1171-16.3.157. [DOI] [PubMed] [Google Scholar]
- 24.Van Duyn MA, Kristal AR, Dodd K, et al. Association of awareness, intrapersonal and interpersonal factors, and stage of dietary change with fruit and vegetable consumption: a national survey. Am J Health Promot. 2001;16(2):69–78. doi: 10.4278/0890-1171-16.2.69. [DOI] [PubMed] [Google Scholar]
- 25.Campbell MK, Reynolds KD, Havas S, et al. Stages of change for increasing fruit and vegetable consumption among adults and young adults participating in the national 5-a-Day for Better Health community studies. Health Educ Behav. 1999;26(4):513–34. doi: 10.1177/109019819902600409. [DOI] [PubMed] [Google Scholar]
- 26.Townsend MS, Kaiser LL. Development of a tool to assess psychosocial indicators of fruit and vegetable intake for two federal programs. J Nutr Educ Behav. 2005;37(4):170–184. doi: 10.1016/s1499-4046(06)60243-1. [DOI] [PubMed] [Google Scholar]
- 27.Townsend MS, Kaiser LL. University of California Fruit and Vegetable Inventory. University of California Cooperative Extension; Hollister, CA: 2006. [Google Scholar]
- 28.Townsend MS, Kaiser LL. Brief psychosocial fruit and vegetable tool is sensitive for the US Department of Agriculture’s Nutrition Education Programs. J Am Diet Assoc. 2007;107(12):2120–2124. doi: 10.1016/j.jada.2007.09.015. [DOI] [PubMed] [Google Scholar]
- 29.Havas S, Treiman K, Langenberg P, et al. Factors associated with fruit and vegetable consumption among women participating in WIC. J Am Diet Assoc. 1998;98(10):1141–1148. doi: 10.1016/S0002-8223(98)00264-8. [DOI] [PubMed] [Google Scholar]
- 30.Kvaavik E, Lien N, Tell GS, Klepp KI. Psychosocial predictors of eating habits among adults in their mid-30s: The Oslo Youth Study follow-up 1991–1999. Int J Behav Nutr Phys Act. 2005;2:9. doi: 10.1186/1479-5868-2-9. [DOI] [PMC free article] [PubMed] [Google Scholar]
- 31.Moser RP, Green V, Weber D, Doyle C. Psychosocial correlates of fruit and vegetable consumption among African American men. J Nutr Educ Behav. 2005;37(6):306–314. doi: 10.1016/s1499-4046(06)60161-9. [DOI] [PubMed] [Google Scholar]
- 32.Hu LT, Bentler PM. Cutoff Criteria for Fit Indexes in Covariance Structure Analysis: Conventional Criteria versus New Alternatives. Struct Equ Modeling. 1999;6(1):1–55. [Google Scholar]
- 33.Di Noia J, Prochaska JO. Mediating variables in a Transtheoretical Model dietary intervention program. Health Educ Behav. 2010;37(5):753–762. doi: 10.1177/1090198109334897. [DOI] [PMC free article] [PubMed] [Google Scholar]
Associated Data
This section collects any data citations, data availability statements, or supplementary materials included in this article.


