Abstract
The discovery of salutary effects of low doses of carbon monoxide (CO) has spurred interest in designing exogenous molecules that can deliver CO to biological targets under controlled conditions. Herein we report a water-soluble photosensitive manganese carbonyl complex [MnBr(CO)3(pyTAm)] (2) (pyTAm = 2-(pyridyl)imino-triazaadamantane) that can be triggered to release CO upon exposure to visible light. Inclusion of a triazaadamantyl pharmacophore into the coligand of 2 improves its stability and solubility in water. Change in the coligand from 2-(pyridyl)imino-triazaadamantane to 2-(pyridyl)iminoadamantane (pyAm) or 2-(quinonyl)imino-triazaadamantane (qyTAm) dramatically alters these desired properties of the photoCORM. In addition to structures and CO-releasing properties of the three analogous complexes 1–3 from these three α-diimine ligands, theoretical calculations have been performed to determine the origin of Mn–CO bond labilization upon illumination. Rapid delivery of CO to myoglobin under physiological conditions attests the potential of 2 as a biocompatible photoCORM.
Introduction
Despite the notoriety as the “silent killer” carbon monoxide (CO) has recently been identified as an important signaling molecule in mammalian physiology and pathology. CO is endogenously produced in mammals as one of the byproducts of heme breakdown by the enzyme heme oxygenase (HO).1 When applied in smaller doses (<200 ppm), CO exhibits excellent anti-inflammatory and anti-apoptotic effects in normal cells.2 In addition, pre-treatment with CO reduces the chances of graft rejection in various organ transplantation protocols, prevents ischemic reperfusion (IR) injury, and relieves pulmonary hypertension (PAH).3,4 Interestingly when applied at a slightly higher concentrations, CO exhibits significant pro-apoptotic effects in various dysregulated hyperproliferative cells like cancer cells.5 Moreover, when administered along with a chemotherapeutics, CO increases the sensitivity of the drug considerably without affecting the normal cells and tissues. For example, exposure to CO induces apoptosis of prostate cancer cells during chemotherapy through metabolic exhaustion.6 Such exposure also prohibits angiogenesis and further metastasis of the cancer. Therefore, under control conditions, CO could be exploited for efficient eradication of cancer cells, especially for the types of malignancies that are resistant towards conventional chemotherapeutics. Although CO inhalation therapy has been sparsely employed in clinics, the lack of appropriate control is a major limitation for its routine application. It has now been established that carbon monoxide releasing molecules (CORMs) are more desirable in exploiting the therapeutic potential of this gaseous molecule.7–12 Among various CORMs the photoactive metal carbonyl complexes (photoCORMs)13–15 have drawn significant repute due to their ability to function as more target-specific and controllable CO donors unlike the first generation solvent-assisted CORMs.16 The photoCORMs reported so far are mostly carbonyl complexes of metals of group 7 and 8 presumably due to their well-studied photophysical and photochemical properties. The two major challenges in development of physiologically applicable photoCORMs are (a) solubility and stability of the complex in aerated aqueous media and (b) sensitivity to light suitable for phototherapy to trigger the release of CO. A biocompatible photoCORM as the pro-drug should be sufficiently soluble and stable in aqueous media where CO photorelease could be initiated with light of relatively longer wavelengths to facilitate deep tissue penetration and avoid possible detrimental effects due to UV radiation. The majority of the photoCORMs however do not fully satisfy these prerequisites for biological applications.13–15
Over the past few years we and others have shown the potential of CO delivered from designed photoCORMs towards eradication of malignant cells.17–19 However, development of a physiologically acceptable photoCORM still remains as a tantalizing challenge. We have been engaged in systematic isolation of various group 7 and 8 metal-based photoCORMs on the basis of few design principles.20 It is now apparent that among the group 7 metal carbonyls, only manganese carbonyls rapidly release CO upon exposure to visible light; the analogous rhenium complexes require UV light for their activation.21 Moreover, results of theoretical calculations indicate that metal-to-ligand charge transfer (MLCT) transitions are mainly responsible for the labilization of the metal–CO bonds in such complexes. As a consequence, use of bidentate or tridentate N-donor ligands with variable π-accepting capacities can modulate the frontier orbitals involved in such MLCT transitions to red-shift the absorption band to visible region.21 In a recent work we have isolated a family of manganese carbonyl complexes derived from α-diimine ligands and critically investigated the correlation between ligand structure and CO release property.22 Results of these studies now clearly demonstrate that among photoCORMs bearing α-diimine ligands, complexes in which one of the imine functions is not a part of rigid ring system exhibit superior light absorption and faster CO release compared to complexes in which both imine functions are part of a rigid ring framework. This finding has led us to select the former type of α-diimine ligands for the present study.
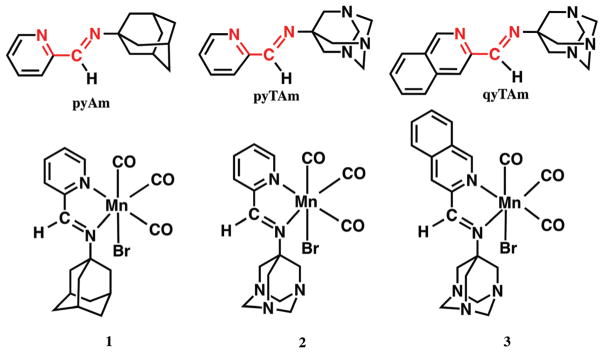
In the next step of the design, we looked into ligand frames with desirable features such as efficient cellular uptake, preferential accumulation to the target site, and minimal side effect from the CO-spent byproducts. The first two characteristics are crucial to enhance the efficacy of the drug/pro-drug by ensuring low required doses and nominal systemic exposure. The adamantane motif has been chosen in various drug designs to enhance the lipophilicity of the drug/pro-drug thereby improving their pharmacokinetics.23 Aminoadamantanes were among the initial class of compounds that eventually entered the pharmaceutical market and most of them are still in use. There has been extensive development on adamantane-based therapeutics over the years for treating Influenza A, Herpes simplex, Hepatitis C and HIV.23 In addition several adamantane derivatives have been utilized as potent pharmacophore in cancer research. Careful scrutiny revealed that several platinum complexes bearing the adamantyl moiety showed preferential in vitro cytotoxicity against a number of human cancer cell lines. Most notably a 1-aminoadamantane (amantadine) complex of platinum showed significantly higher cytotoxicity towards an intrinsically cisplatin-resistant ovarian cancer cell line SK-OV-3.24 Further it has been shown that a platinum amino-adamantane complex displayed much higher efficacy in the combination therapy with TRAIL (tumor necrosis factor-related apoptosis-inducing ligand) compared to cisplatin in human colon and prostate carcinoma cells.25 Significantly higher cellular uptake of the adamantylamine complexes compared to cisplatin was also observed in this work. Moreover, detailed study of the excreted metabolites of adamantane-based drug molecules reveals mostly unmodified adamantane moieties, which is certainly an added advantage in terms of minimizing the possible side effects. All these attractive features encouraged us to select 1-aminoadamantane as a precursor amine to synthesize the α-diimine ligands for the present work. The 2-(pyridyl)iminoadamantane (pyAm) Schiff base ligand bearing the adamantyl motif was our first step towards isolating manganese-based photoCORM namely, [MnBr(CO)3(pyAm)] (1) (Fig. 1) with desirable pharmacokinetic properties. However, lack of solubility of this complex in aqueous media poses a problem in terms of biological applications. In further pursuit of developing water soluble photoCORM, we have also employed 2-(pyridyl)iminotriazaadamantane (pyTAm) and 2-(quinonyl)iminotriazaadamantane (qyTAm) to isolate the manganese complexes [MnBr(CO)3(pyTAm)] (2) and [MnBr-(CO)3(qyTAm)] (3) (Fig. 1). Interestingly, complex 2 shows excellent stability and solubility in water and phosphate buffer saline (PBS) whereas complex 3 exhibits only marginal solubility in such media. Herein we report the structures and photo-properties of 1–3 as well as their CO release efficiencies. Results of density functional theory (DFT) and time dependent DFT (TDDFT) studies on 1 and 2 have also been included to provide insight into their photochemical properties. Finally, the efficacy of light-induced CO delivery to myoglobin by complex 2 has been determined to establish the utility of this water-soluble photoCORM.
Fig. 1.
Structures of the α-diimine ligands (top panel) and complexes 1–3 (bottom panel).
Experimental section
General
All reagents were of commercial grade and were used without further purification. The solvents were purified according to the standard procedure.26 A Perkin-Elmer Spectrum-One FT-IR was employed to monitor the IR spectra of the complexes and the ligands. UV-Vis spectra were recorded at room temperature using a Varian Cary 50 UV-Vis spectrophotometer. 1H NMR spectra were recorded at 298 K on a Varian Unity Inova 500 MHz instrument. Microanalyses (C, H, N) were performed using a Perkin-Elmer 2400 Series II elemental analyzer. Horse heart myoglobin was purchased from Sigma-Aldrich and used as received.
Synthesis of ligands
The three ligands were synthesized by following a general procedure. The procedure affording 2-(pyridyl)iminoadamantane (pyAm) is described below.
500 mg (3.3 mmol) of 1-adamantylamine was dissolved in 20 mL of methanol (MeOH) and to it was added 354 mg (3.3 mmol) of 2-pyridinecarboxaldehyde in 5 mL of methanol. The mixture was then stirred for 16 h at room temperature. Next, part of the solvent was removed under reduced pressure when a white solid separated. The solid was filtered and washed with cold methanol and dried in vacuo (yield: 260.6 mg, 34%). Elemental analysis calcd (%) for C16H20N2: C, 79.96; H, 8.39; N, 11.66; found C, 79.91; H, 8.44; N, 11.71. ESI-MS (CH3CN): m/z, 241.22. IR (KBr, cm−1): 3050 (w), 2901 (s), 2847 (s), 1642 (m), 1587 (m), 1566 (m), 1466 (m), 1452 (m), 1433 (m), 1308 (w), 1091 (m), 993 (w), 864 (w), 815 (w), 778 (s). 1H NMR (CDCl3): δ = 8.60 (d, 1H), 8.34 (s, 1H), 8.00 (d, 1H), 7.70 (t, 1H), 7.26 (t, 1H), 2.15 (s, 4H), 1.81 (s, 8H), 1.68 (t, 3H). 13C NMR (CDCl3); δ = 156.65, 156.12, 149.72, 136.95, 124.80, 121.38, 43.45, 37.00, 30.00. λmax (CH2Cl2)/nm 264 (ε M−1 cm−1 5930), 230 (11 280).
Yield of 2-(pyridyl)iminotriazaadamantane (pyTAm), prepared by the same procedure with 1,3,5-triazaadamant-7-amine as the amine precursor was 502 mg (64%). Elemental analysis calcd (%) for C13H17N5: C, 64.17; H, 7.04; N, 28.78; found C, 64.21; H, 7.09; N, 28.83. ESI-MS (CH3CN): m/z, 244.19. IR (KBr, cm−1): 2915 (m), 2862 (m), 1645 (w), 1587 (w), 1567 (w), 1470 (m), 1452 (m), 1363 (w), 1314 (w), 1243 (m), 1222 (m), 1030 (s), 992 (s), 821 (s), 775 (m), 641 (m). 1H NMR (CDCl3): δ = 8.63 (d, 1H), 8.27 (s, 1H), 7.97 (d, 1H), 7.74 (t, 1H), 7.32 (t, 1H), 4.52 (d, 3H), 4.15 (d, 3H), 3.51(s, 6H). 13C NMR (CDCl3); δ = 159.72, 154.93, 149.84, 137.00, 125.33, 121.23, 73.97, 62.50. λmax (CH2Cl2)/nm 275 (ε M−1 cm−1 9390), 225 (8290).
Yield of 2-(quinonyl)iminotriazaadamantane (qyTAm) synthesized by the same procedure with 1,3,5-triazaadamant-7-amine as the amine precursor and 2-quinolinecarboxaldehyde was 502 mg (64%). Elemental analysis calcd (%) for C13H17N5: C, 69.60; H, 6.53; N, 23.87; found C, 69.56; H, 6.59; N, 28.91. ESI-MS (CH3CN): m/z, 291.28. IR (KBr, cm−1): 2914 (m), 2860 (m), 1639 (w), 1597 (w), 1502 (w), 1450 (w) 1309 (w), 1242 (m), 1219 (m), 1079 (w), 1028 (s), 994 (s), 834 (m), 821 (m), 751 (m), 637 (m). 1H NMR (CDCl3): δ = 8.43 (s, 1H), 8.15 (m, 2H), 8.09 (d, 1H), 7.82 (d, 1H), 7.73 (t, 1H), 7.56 (t, 1H), 4.52 (d, 3H), 4.15 (d, 3H), 3.54 (s, 6H). 13C NMR (CDCl3); δ = 160.27, 155.22, 137.04, 130.36, 129.94, 128.18, 128.00, 118.19, 74.06, 62.62. λmax (CH2Cl2)/nm 275 (ε M−1 cm−1 9030), 225 (8290).
Synthesis of complexes
The complexes 1 and 2 were synthesized using the same general procedure. Synthesis of [MnBr(CO)3(pyAm)] is described below as a representative case.
Synthesis of [MnBr(CO)3(pyAm)] (1)
A mixture of 100 mg (0.365 mmol) of [MnBr(CO)5] and 87.6 mg (0.365 mmol) of 2-(pyridyl)iminoadamantane (pyAm) in 20 mL of dichloromethane (CH2Cl2) was allowed to stir for 18 h at room temperature in the dark. The color of the solution changed from yellow to orange during this time. Partial removal of the solvent under reduced pressure followed by addition of diethyl ether resulted in formation of an orange solid. The solid was filtered, washed with cold methanol, and dried in vacuo. Yield: 117 mg (77%). Elemental analysis calcd (%) for C19H20N2O3BrMn (459.22): C, 49.66; H, 4.39; N, 6.10; found C, 49.59; H, 4.30; N, 6.15. IR (KBr, cm−1): 2017 (s), 1927 (s), 1905 (s), 1445 (w), 1243 (w), 1075 (w), 775 (m), 687 (w), 630 (m), 508 (w); 1H NMR (CD3CN): δ = 9.23 (d, 1H), 8.56 (s, 1H), 8.11 (t, 1H), 8.04 (d, 1H), 7.64 (t, 1H), 2.27 (m, 12H), 1.83 (t, 3H). λmax (CH2Cl2)/nm 445 (ε M−1 cm−1 1800), 360 (1500).
Synthesis of [MnBr(CO)3(pyTAm)] (2)
This complex was prepared by following the same procedure with 2-(pyridyl)imino-triazaadamantane (pyTAm) as the ligand. Yield: 102 mg (61%). Elemental analysis calcd (%) for C16H17N5O3BrMn (462.20): C, 41.55; H, 3.68; N, 15.15; found C, 41.67; H, 3.63; N, 15.25. ESI-MS (CH3CN): m/z, 462.13. IR (KBr, cm−1): 2020 (s), 1925 (s), 1900 (s), 1455 (w), 1241 (w), 1217 (w), 1026 (m), 995 (m), 825 (w), 735 (w), 640 (w); 1H NMR (CD3CN): δ = 9.24 (d, 1H), 8.34 (s, 1H), 8.14 (t, 1H), 8.06 (d, 1H), 7.66 (t, 1H), 4.55 (s, 3H), 4.13 (s, 3H), 3.91(d, 6H). λmax (CH2Cl2)/nm 455 (ε/M−1 cm−1 2100), 350 (6200).
Synthesis of [MnBr(CO)3(qyTAm)] (3)
A batch of 100 mg (0.365 mmol) of [MnBr(CO)5] and 107 mg (0.365 mmol) of 2-(quinonyl)triazaiminoadamantane (qyTAm) was dissolved in a mixture of 30 mL of MeOH and 10 mL of chloroform (CHCl3) and stirred for 20 h at room temperature in the dark. Next, the volume of the orange solution was reduced to ~20 mL under vacuum when an orange microcrystalline solid separated. The supernatant was then carefully decanted and the microcrystalline solid was collected and dried in vacuo. Yield: 150 mg (80%). Elemental analysis calcd (%) for C20H19N5O3BrMn (512.34): C, 46.89; H, 3.73; N, 13.67; found C, 46.96; H, 3.70; N, 13.72. ESI-MS (CH3CN): m/z, 512.03. IR (KBr, cm−1): 2018 (s), 1930 (s), 1915 (s), 1455 (w), 1243 (w), 1217 (w), 1026 (m), 995 (m), 830 (w), 754 (w), 635 (w); 1H NMR (CD3CN): δ = 8.70 (d, 1H), 8.45 (d, 1H), 8.41 (s, 1H), 7.94 (d, 1H), 7.85 (d, 1H), 7.66 (t, 2H), 4.41 (s, 3H), 3.98 (s, 3H), 3.70 (d, 6H). λmax (CH2Cl2)/nm 490 (ε/M−1 cm−1 1910), 375 (7300).
X-ray data collection and structure refinement
Single crystals of the complexes 1–3 were obtained by layering hexanes over their dichloromethane solutions. Data were collected on a Bruker APEX II single crystal X-ray diffractometer with graphite monochromated Mo-Kα radiation (λ = 0.71073 Å) by the ω-scan technique in the range 3 ≤ 2θ ≤ 51 for 1, 3 ≤ 2θ ≤ 50 for 2, and 3 ≤ 2θ ≤ 49 for 3 (Table 1). All the data were corrected for Lorentz-polarization and absorption.27 The structures were generated using SHELXT (intrinsic phasing)28 and subsequently refined by full-matrix least squares procedure on F2. For 2, the structure was initially refined in P1̄ space group with two molecules in the asymmetric unit but upon emergence of an Alert A in the CheckCIF report suggesting a probable higher symmetry system, ADDSYMM module of PLATON program29 was utilized for the matrix transformation and eventually the molecular structure of 2 was refined in P2(1)/n space group. All non-hydrogen atoms were refined anisotropically. All hydrogen atoms were included in calculated positions. The absorption corrections are done using SADABS. Calculations were performed using the SHELXTL 2014 program package.30
Table 1.
Crystal data and structure refinement parameters for 1, 2 and 3
| 1 | 2 | 3 | |
|---|---|---|---|
| Empirical formula | C19H20N2O3BrMn | C16H17N5O3BrMn | C20H19N5O3BrMn |
| FW | 459.22 | 462.20 | 512.25 |
| Temp (K) | 296 | 296 | 296 |
| Crystal System | Monoclinic | Monoclinic | Triclinic |
| Space group | P2(1)/n | P2(1)/n | P1̄ |
| a (Å) | 15.428(3) | 7.1920(3) | 8.788(5) |
| b (Å) | 7.2853(15) | 20.6213(9) | 10.438(5) |
| c (Å) | 18.627(4) | 12.1639(5) | 12.643(3) |
| α (°) | 90 | 90 | 104.88(2) |
| β (°) | 113.986(2) | 93.6430(10) | 105.15(3) |
| γ (°) | 90 | 90 | 103.47(6) |
| V (Å3) | 1912.9(7) | 1800.36(13) | 1024.3(8) |
| Z | 4 | 4 | 2 |
| Density (calcd) (Mg m−3) | 1.595 | 1.705 | 1.661 |
| Abs coeff (mm−1) | 2.799 | 2.979 | 2.628 |
| No. of unique reflns | 3426 | 3169 | 3366 |
| R1b | 0.0493 | 0.0378 | 0.0508 |
| wR2c | 0.1759 | 0.1390 | 0.1377 |
| GOFa on F2 | 1.388 | 1.211 | 0.895 |
GOF = [Σ[w(Fo2 − Fc2)2]/(No − Nv)]1/2 (No = number of observations, Nv = number of variables).
R1 = Σ||Fo| − |Fc||/Σ|Fo|.
wR2 = [(Σw(Fo2 −Fc2)2/Σ|Fo|2)]1/2.
Photolysis experiments
Studies on the CO release rates from the complexes were performed with 1 cm × 0.4 cm quartz cuvette. The light source employed for this study involved a broadband visible light (Electro Fiber Optics Corporation, IL 410 illumination system) and a 450 nm cut-off filter was used to avoid any stray UV radiation (power, 10 mW cm−2). A Newport Oriel Apex Illuminator (1 mW cm−2 power) was employed to assess apparent CO release rate under monochromatic light. The cuvette was placed at a distance of 1 cm for 4 or 8 s intervals (depending on media) of exposure and the electronic absorption spectra were sequentially recorded. Prior to each reading, the cuvette was inverted to ensure sufficient mixing. Apparent rate of CO release (kCO) were determined at an appropriate wavelength for each complex from the corresponding log[c] (c = concentration of the complex) versus time (T ) plots.
DFT and TDDFT studies
DFT and TDDFT calculations on complexes 1 and 2 were carried out using double-ζ basis set 6-31G* for all atoms with two exceptions: Br, 6-11G* and Mn, for which LANL2DZ basis set and effective core potential (ECP) were employed. Calculations were carried out with the program PC-GAMESS.31 The hybrid functional PBE0 was utilized for TDDFT calculations. The X-ray crystal structure coordinates of 1 and 2 were used as preliminary coordinates for geometry optimization. The molecular orbitals (MOs) were visualized using MacMolPlt.32 Oscillation strengths greater than 0.004 were taken into consideration for analyses of transitions.
Results and discussion
Synthesis and structure
The reaction of [MnBr(CO)5] with the pyAm and pyTAm in CH2Cl2 solution at ambient temperature afforded complexes 1 and 2 respectively as orange colored solids. Complex 3 was isolated from the reaction of [MnBr(CO)5] with qyTAm in CHCl3/MeOH mixture at ambient condition. In all cases, the reaction mixtures were covered with aluminum foil over the course of reactions to avoid exposure to ambient light. The molecular structures of the complexes have been determined by X-ray crystallography. The distorted octahedral geometry around Mn(I) center was revealed in all three complexes with three CO groups reside in a facial disposition (Fig. 2–4, tables of metric parameters in ESI†). In 1, the equatorial plane composed of N1, N2, C2, C3 atoms is almost planar (mean deviation 0.013 Å). The similar equatorial plane of 2 exhibits a slightly higher mean deviation of 0.024 Å. In case of 3, the equatorial plane comprised of N1, N2, C2, C3 is more distorted (mean deviation 0.064 Å). Also, the chelate ring composed of Mn1, N1, N2, C4, C13 deviates noticeably from planarity (mean deviation 0.086 Å), all presumably due to steric effects. This is in contrast to the five-membered chelate rings (composed of Mn1, N1, N2, C8, C9 atoms) in 1 and 2, which are almost planar with mean deviations of 0.006 and 0.004 Å respectively. The Mn1–C1 bond in 1 and 2 (1.959 and 1.899 Å respectively) is longer compared to the two other Mn–C distances. In case of a structurally similar carbonyl complex namely, [MnBr(CO)3(py-2-CH═N-C6H4-m-COOH)],33 the average Mn–C distance is (1.815 Å) is considerably shorter compared to that for both 1 and 2 (the average Mn–C distances are 1.858 and 1.838 Å respectively). Overall, the Mn–C and Mn–N distances of the present complexes are significantly longer than the corresponding distances of [MnBr(CO)3(bpy)], an analogous complex in which the α-diimine function is part of the rigid ring structure.21
Fig. 2.
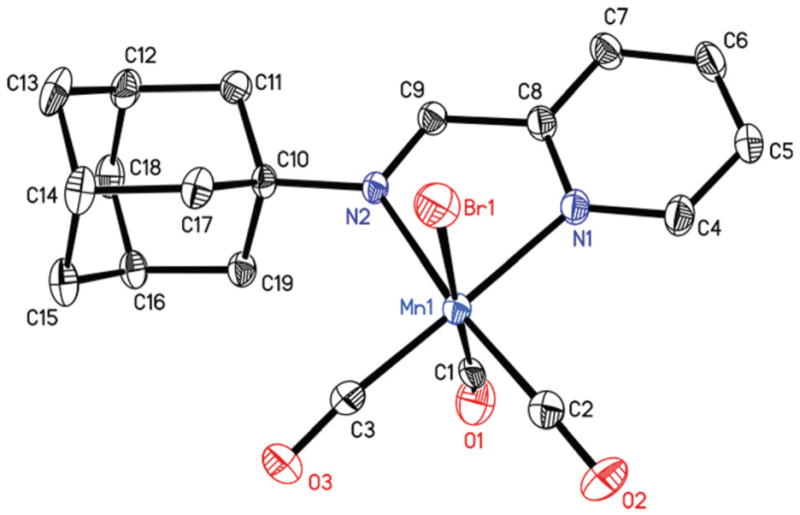
Thermal ellipsoid plot of complex 1 shown with 50% probability ellipsoids. Hydrogen atoms are omitted for the sake of clarity. Selected bond distances [Å] Mn1–C1, 1.959(8); Mn1–C2, 1.807(5); Mn1–C3, 1.807(5), Mn1–N1, 2.051(4); Mn1–N2, 2.106(3), Mn1–Br1, 2.5216(9).
Fig. 4.
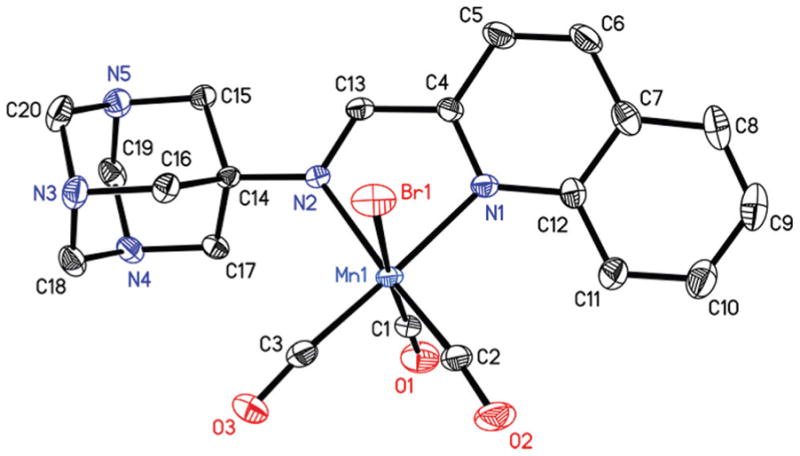
Thermal ellipsoid plot of complex 3 shown with 50% probability ellipsoids. Hydrogen atoms are omitted for the sake of clarity. Selected bond distances [Å] Mn1–C1, 1.802(6); Mn1–C2, 1.797(5); Mn1–C3, 1.805(6), Mn1–N1, 2.098(4); Mn1–N2, 2.087(4), Mn1–Br1, 2.5152(12).
Solubility and stability in aqueous media
Although the present three complexes dissolve in solvents like CH2Cl2, CHCl3 and MeCN, they exhibit very different solubility in aqueous medium. For example 1 is not soluble in water or PBS while 2 dissolves readily in aquous media. Interestingly, the inclusion of the quinoline moiety in the ligand significantly decreases the solubility of 3 in aqueous media. It is thus apparent that among the three designed ligands, only pyTAm affords a photoCORM that is highly soluble in water. Although the low-energy absorption band maximum of 3 (λmax = 490 nm) is more red shifted compared to 2 (λmax = 455 nm), its low solubility in water diminishes its potential as a biocompa-tible photoCORM and hence complex 2 has been used in all experiments hereafter. In a recent account, Westerhausen and co-workers have reported a set of water-soluble Mn(I) based photoCORMs and employed one such complex namely, CORM-EDE1 ([{(OC)3Mn}2(μ-SCH2CH2NH3)3]Br2), in CO-induced activation of mammalian BK channels under illumination.34 Compared to CORM-EDE1, complex 2 has a much simpler structure with a known pharmacophore included in its design.
Solutions of 2 in water and PBS buffer are stable in the absence of light for at least 24 h. As shown in Fig. 5, the electronic absorption spectrum of 2 in such media does not change during this period. The solutions are stable under both aerobic and nonaerobic conditions and can be stored for days without degradation when stored at 0 °C in absence of light (ideal for various biological applications). Aqueous solutions of 2 are also stable in presence of excess glutathione and solution of 2 in neat DMSO remains intact under dark condition (see ESI†). Initial evaluation of the partition coefficient of 2 using the http://www.molinspiration.com software afforded a very low value of log P (−6.12) indicating that this system is not amenable to HPLC-based method for evaluating log P values experimentally. We therefore decided to determine the thermodynamic solubility of complex 2 by conventional absorption spectroscopic technique (see ESI†) which afforded a value of value of 13.8 mg mL−1 as solubility of 2 in deionized water.
Fig. 5.
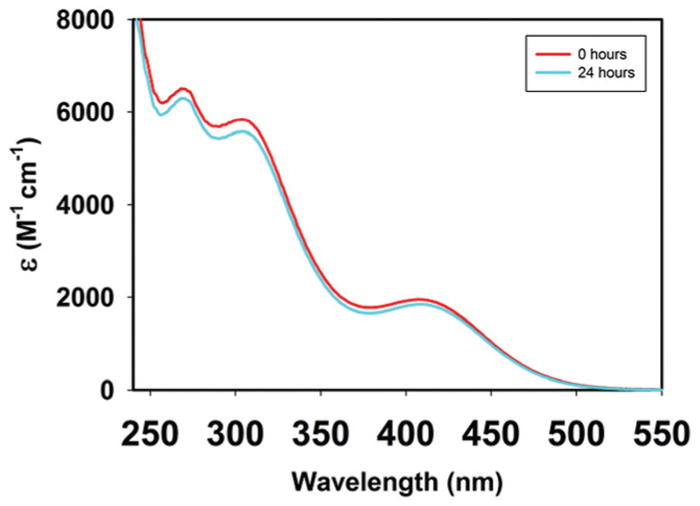
UV-Vis spectral traces of complex 2 in aqueous PBS.
Spectroscopic properties
The IR spectral patterns for 1–3 are consistent with the presence of fac-{Mn(CO)3} moiety with the CO stretching frequencies in the expected regions (see experimental section and ESI†). Complexes 1–3 exhibit well-resolved 1H NMR spectra in solution which is consistent with the presence of diamagnetic Mn(I) centers (see ESI†). Solutions of the complexes exhibit electronic absorption spectra consisting of two bands around 450 and 350 nm. An example is shown in Fig. 6. The lower energy absorption arises from metal-to-ligand charge transfer (MLCT, metal d(π) → ligand(π*)) transitions with considerable halide-to-ligand charge transfer (XLCT, bromide(p) → ligand-(π*)) character (vide infra) while the blue shifted absorption maxima of the complexes have their origins in ligand π → π* transitions. As shown in Fig. 6, the two absorption bands shift to higher energy in aqueous media.
Fig. 6.
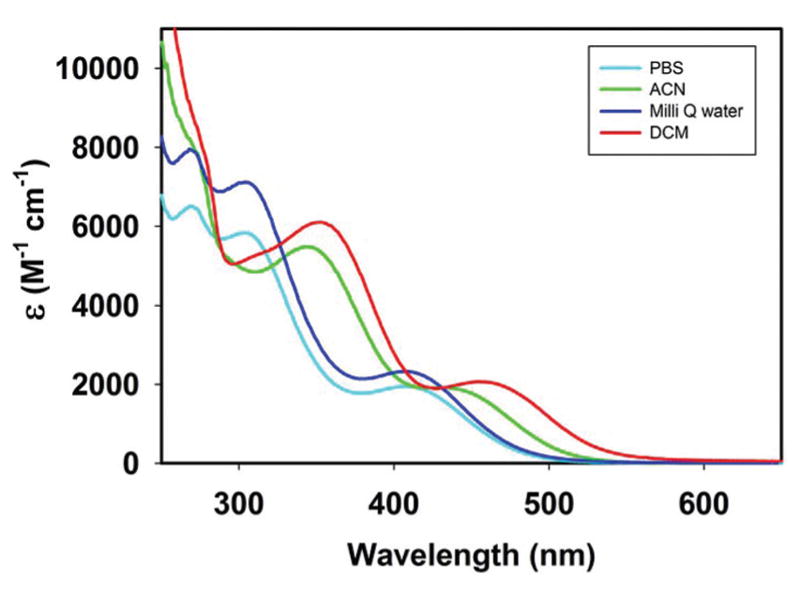
Electronic absorption spectra of complex 2 in different solvents.
CO photo release
All three complexes release CO upon exposure to low power visible light (10–15 mW cm−2). Exposure to such light results in systematic changes in the absorption spectra (an example is shown in Fig. 7) arising from the loss of CO.35,36 The apparent CO release rates (kCO) for the three complexes have been determined in CH2Cl2 for the purpose of comparison. In such solutions (conc., 1.5 × 10⁻⁴ M), the kCO values increase in the order 1 < 2 < 3 (2.84 ± 0.02 min−1 for 1, 5.56 ± 0.02 min−1 for 2 and 12.43 ± 0.02 min−1 for 3 respectively) upon illumination with broadband visible light. In order to examine whether the MLCT/XLCT transition (λmax = 460 nm) is responsible for the CO release under visible light illumination, the rate of CO photorelease from 2 in CH2Cl2 has also been determined with broadband visible light source equipped with a cutoff filter (λ ≥ 450). Under this experimental condition (conc., 1.5 × 10⁻⁴ M, power, 10 mW cm−2), 2 exhibits a comparable kCO value of 5.11 ± 0.02 min−1 underscoring a strong correlation between absorptivity of this complex in the visible region and its CO photolability. When 450 nm monochromatic light (1 mW cm−2) was employed, the apparent CO release rate (kCO) of 2 in the same solvent dropped to 2.35 ± 0.02 min−1 (quantum yield λ450 = 0.35) showing a dependence of CO release rate on the power of the incident light.
Fig. 7.
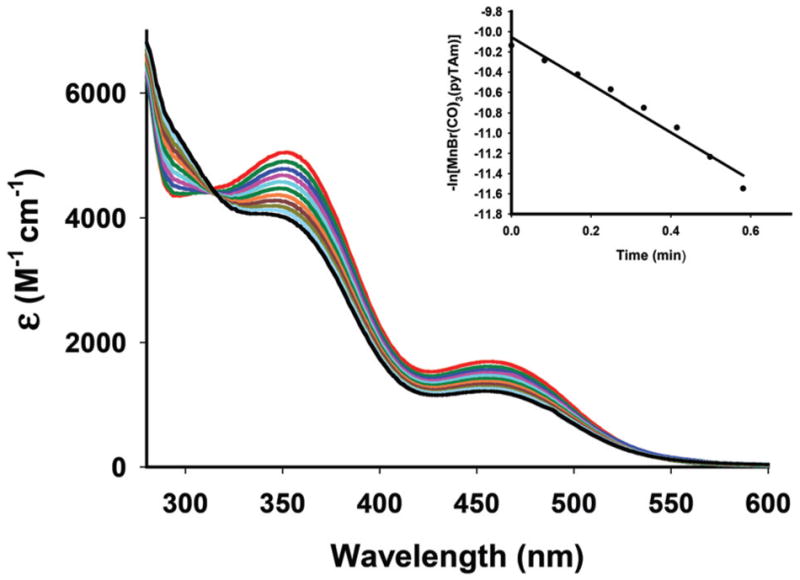
Changes in the electronic absorption spectrum of complex 2 in CH2Cl2 upon exposure to monochromatic visible light with λ = 450 nm (conc., 1.92 × 10⁻⁴ M). The inset displays the kCO rate plot for complex 2.
Although the molar absorptivities of 2 are comparable in different organic and aqueous media (Fig. 6), modest drop in kCO value is observed in PBS (2.61 ± 0.02 min−1, conc., 2.25 × 10⁻⁴ M) and water (1.66 ± 0.02 min−1, conc., 2.25 × 10⁻⁴ M) solutions. Despite such drop in aqueous environment, the kCO value of 2 in PBS is still very reasonable for rapid CO delivery to biological targets. It is also important to note that 2 is considerably stable in the presence of dithionite in PBS and releases CO only upon exposure to light.
Delivery of CO to myoglobin
Photoinduced release of CO from 2 has been investigated with the aid of myoglobin (Mb) assay. Although 2 is stable in the presence of dithionite, we have checked the process of CO photorelease from 2 by two independent experiments. In the first experiment, complex 2 was directly added to a solution of dithionite-reduced Mb in PBS (pH 7.4) in the dark. The mixture was then irradiated with a broadband light source for 1 min and changes in the absorption spectrum of the protein were recorded. A shift of the Soret band from 435 nm to 424 nm clearly indicated the formation of carboxymyoglobin (Mb-CO). In order to eliminate the effect of dithionite (if any)37 in such experiment the light-induced CO release from 2 was also investigated by a second modified myoglobin assay. In this experiment, solution of 2 in PBS (pH 7.4) was degassed and subsequently irradiated with a broadband light source. The resulting solution was then flushed with N2 gas, and the photogenerated CO was transferred via a cannula into a cuvette containing reduced Mb in PBS. This remote transfer of CO eliminated the possibility of carbonyl reduction by dithio-nite.37 As shown in Fig. 8, the shift in the Soret band (from 435 to 424 nm) and changes in the absorption in the 550 nm region demonstrated formation of Mb-CO. Taken together, these results attest the utility of 2 as a convenient CO donor to biological targets under physiological conditions.
Fig. 8.
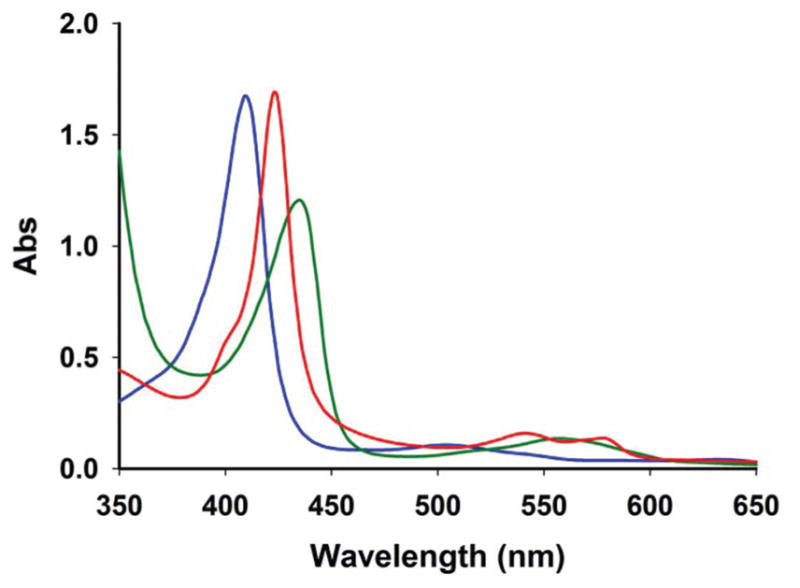
UV-Vis traces from the Mb assay for 2 in PBS solution. The blue trace represents oxidized Mb (λmax = 410 nm); bright green trace represents reduced Mb (λmax = 435 nm); red trace represents Mb-CO formation (λmax = 424 nm) upon transfer of CO remotely generated from 2 by visible light illumination (power 15 mW cm−2) for 1 min.
Photoproducts of 2
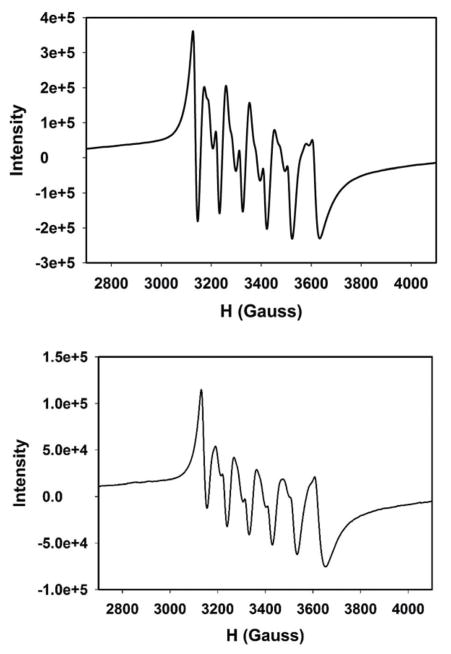
Exhaustive photolysis of complex 2 in water under aerobic conditions results in an almost colorless solution. The UV-Vis spectrum of this photolyzed solution resemble closely to that of the free ligand, indicating deligation of pyTAm ligand upon illumination with concomitant CO release (Fig. 9). Also, the IR spectrum of the solid residue obtained upon evaporation of the photolyzed solution reveals no band pertaining to CO stretching (see ESI†). This suggests that 2 liberates all three CO ligands upon illumination. The photolyzed solution also displays well-resolved six-line X-band EPR spectrum indicating the presence of Mn(II) species in the photodecomposition product (Fig. 10). The X-band EPR spectrum of the reaction mixture of MnSO4, pyTAm ligand and (Et4N)Br (1 : 1 : 1) in acetonitrile–water exhibited very similar pattern (Fig. 10, bottom panel). Since electronic absorption spectroscopy of the photolyzed solution indicated deligation of pyTAm from complex 2, the similarity in these two EPR patterns suggested a solvated Mn(II) species in the photolyzed product along with the free ligand (pyTAm). Collectively the photo behavior of 2 is consistent with our previous findings17,22 as well with other water-soluble manganese photoCORMs reported recently.34
Fig. 9.
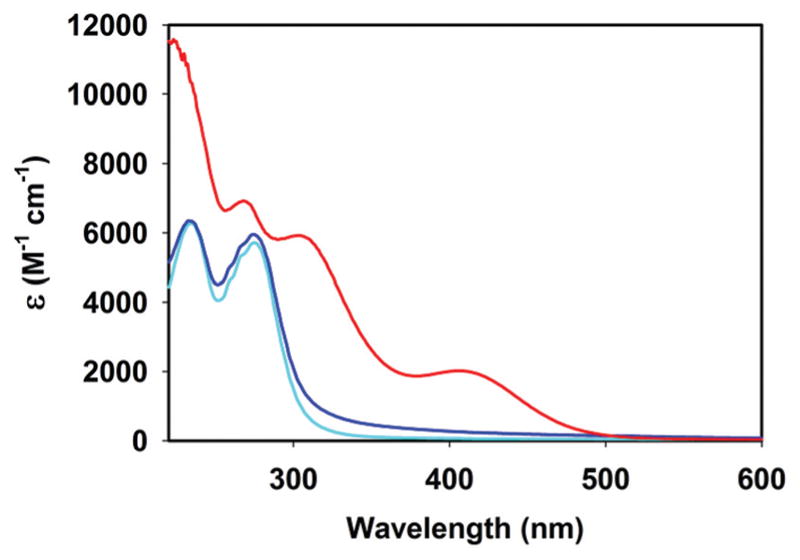
Electronic absorption spectra of 2 (red trace), photolyzed solution (blue trace) and pyTAm (cyan trace) in aqueous solutions.
Fig. 10.
X-Band EPR spectrum of the photolyzed solution of complex 2 in acetonitrile–water (40 : 60 v/v) (top panel) and a reaction mixture if MnSO4, pyTAm and (Et4N)Br (1 : 1 : 1) in same media (bottom panel). Microwave frequency, 9.44 GHz; modulation amplitude, 2.00 G; modulation frequency, 100 KHz.
DFT and TDDFT calculations
Density functional theory (DFT) and time-dependent DFT (TDDFT) studies have been performed to acquire insight into the nature of the transitions responsible for Mn–CO bond labilization in 2. The DFT optimized structure of 2 shows good agreement with the bond lengths and bond angles observed in the crystal structure of the complex (see ESI†). In addition, TDDFT studies have provided the molecular orbital (MO) electron densities and the calculated electronic transitions. The theoretical electronic absorption spectrum of 2 obtained from TDDFT calculations also agrees well with the experimental data. As shown in Fig. 11, the 1MLCT transition of 2 around 450 nm originates from the occupied orbital (HOMO–1) mostly comprised of π(Mn–CO) and p-Br and ends up in lowest unoccupied molecular orbital (LUMO) primarily made up of π* orbitals of the imine and pyridine moieties. More specifically, about 37% of the HOMO–1 is composed of π(Mn–CO) and 31% of p-Br bonding character. The LUMO is mainly composed of π* ligand orbitals (75%) and mostly concentrated on the pyridine ring and imine function (Fig. 11). Very similar results have been obtained from DFT and TDDFT calculations on 1 (see ESI†). Taken together it is clear that absorption in the ~450 nm region initiates CO photorelease from 2 as a consequence of MLCT/XLCT transition, a phenomenon observed with similar carbonyl complexes derived from ligands with α-diimine function.20
Fig. 11.
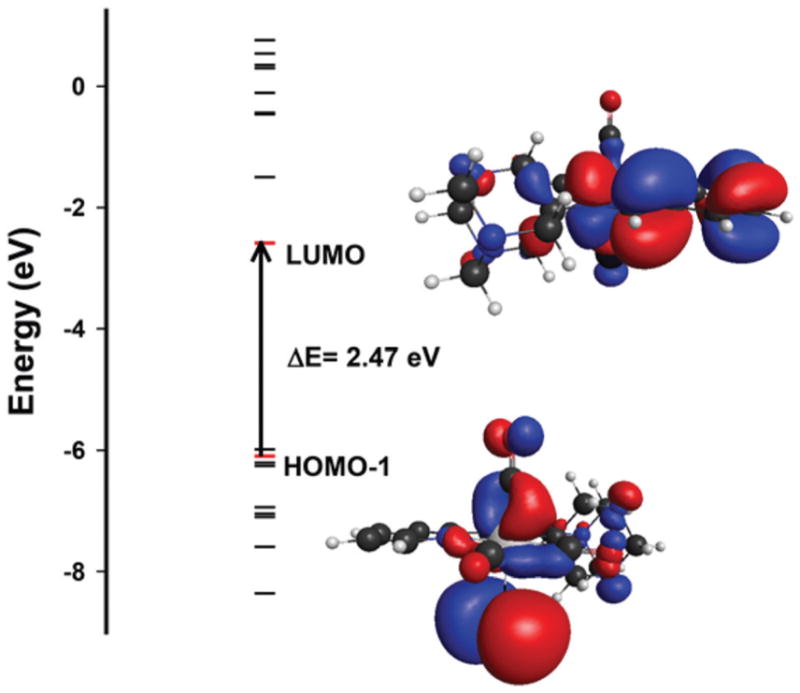
Calculated energy diagram of 2. The most prominent MOs involved with transitions under the band associated with CO release upon visible light illumination are shown.
Potential of 2 as a biocompatible photoCORM
The search for a biocompatible photoCORM in this research has clearly identified complex 2 as an excellent contender for CO delivery to biological targets. Despite excellent CO photo-lability of all the three complexes, only complex 2 shows high solubility (and stability) in aqueous media. In addition to this property, 2 contains the triazaadamantane moiety that improves the potential of cellular internalization of this prodrug by malignant cells in particular. Phosphane compounds with triazaadamantane moiety have been used as ancillary ligands in developing various anticancer drugs.38,39 Among others, RAPTA-type complexes developed by Dyson and co-workers (RAPTA = ruthenium-arene PTA) are noteworthy.40 The pH dependent solubility of these compounds provides an extra advantage in site-specific drug delivery. At physiological pH (7.4) the triazaadamantane moiety carries no charge and can diffuse through lipid membranes and thereby in to the cells. However, in cancer cells with relatively low pH, the tri-azaadamantane unit gets protonated and trapped within. This characteristic facilitates preferential accumulation of the drug/ prodrug molecule at the target site (diseased tissue) and thus ensures nominal systemic exposure. The protonated triaza-adamantane moiety also imparts enhanced DNA damage.
In addition to excellent solubility in aqueous media, complex 2 rapidly releases 3 molecules of CO upon exposure to low power visible light and aqueous solutions of 2 are stable in the dark and insensitive to reductants like dithionite, and glutathione, and can be stored for long periods at low temperature. It is therefore reasonable to assume that 2 will serve as an excellent photoCORM in biological systems. Recent research efforts by other groups towards developing water-soluble photoCORMs have employed different appendages to the car-bonyl complexes to improve their solubility. For example, Schatzschneider and co-workers have reported a peptide appended photoCORM,41 while Zobi and co-workers have attached photoCORMs to vitamin B12 platform42,43 to achieve solubility in aqueous media. In this report, complex 2 represents a new class of highly water-soluble photoCORM with a much simpler design and straightforward synthetic strategy. The synthetic protocol demonstrates that appropriate choice of ligand/coligands and metal centers confers appreciable aqueous solubility, stability under dark condition and sensitivity to visible light. All these properties along with the presence of a known pharmacophore built within makes such complex one of the most promising candidates for phototherapeutic procedure reported to date. Studies on CO delivery to cancer cells with 2 and related complexes are in progress in this laboratory and the results will be reported elsewhere in near future.
Supplementary Material
Fig. 3.
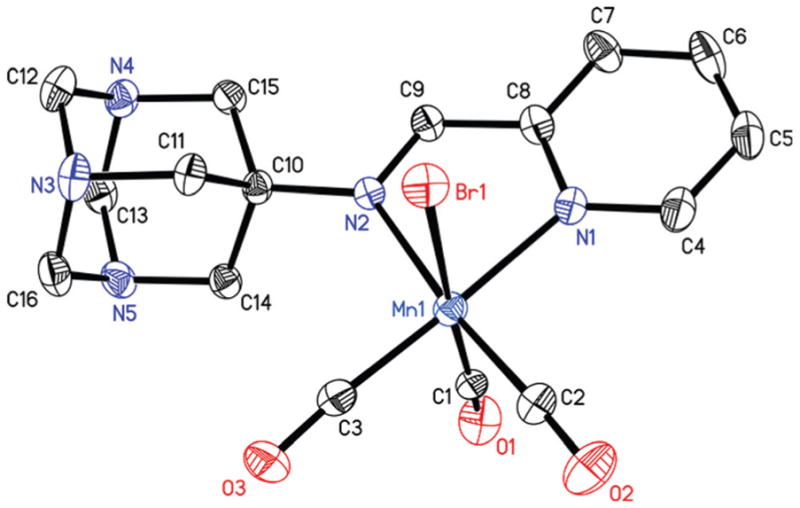
Thermal ellipsoid plot of complex 2 shown with 50% probability ellipsoids. Hydrogen atoms are omitted for the sake of clarity. Selected bond distances [Å] Mn1–C1, 1.899(5); Mn1–C2, 1.815(4); Mn1–C3, 1.801(4), Mn1–N1, 2.049(3); Mn1–N2, 2.092(3), Mn1–Br1, 2.5082(6).
Acknowledgments
Financial supports from the NSF grant DMR-1409335 and an UCSC COR Special Research grant are gratefully acknowledged. JJ acknowledges support from the NIH grant 2R25GM058903. We also thank Graham Roseman and Cameron Pye of Department of Chemistry & Biochemistry, UC Santa Cruz for help in the EPR and thermodynamic water solubility assay experiments respectively.
Footnotes
Electronic supplementary information (ESI) available: Packing diagrams of complexes 1–3 (Fig. S1–S3), standard curve for aqueous solubility determination (Fig. S4). FTIR spectra of complexes 1–3 (Fig. S5–S7), 1H NMR spectra of complexes 1 and 2 in CD3CN solutions (Fig. S8 and S9), electronic absorption spectra of pyAm, pyTAm and qyTAm in dichloromethane solutions (Fig. S10), changes in electronic absorption spectrum of 1 and 3 in dichloromethane upon 450 nm monochromatic light illumination (Fig. S11 and S12), absorption spectrum of 2 in PBS in presence of glutathione (Fig. S13) and in DMSO (Fig. S14), FTIR spectrum of the photolyzed residue of 2 in KBr matrix (Fig. S15), selected X-ray and optimized DFT bond distances and angles for 1 and 2 (Table S1), and calculated MO energy diagram of 1 (Fig. S16). CCDC 1452076, 1452077 and 1463775. For ESI and crystallographic data in CIF or other electronic format see DOI: 10.1039/c6dt01358a
Notes and references
- 1.Kikuchi G, Yoshida T, Noguchi M. Biochem Biophys Res Commun. 2005;338:558–567. doi: 10.1016/j.bbrc.2005.08.020. [DOI] [PubMed] [Google Scholar]
- 2.Ryter SW, Choi AMK. Korean J Intern Med. 2013;28:123–140. doi: 10.3904/kjim.2013.28.2.123. [DOI] [PMC free article] [PubMed] [Google Scholar]
- 3.Nakao A, Choi AMK, Murase N. J Cell Mol Med. 2006;10:650–671. doi: 10.1111/j.1582-4934.2006.tb00426.x. [DOI] [PMC free article] [PubMed] [Google Scholar]
- 4.Kaczorowshi DJ, Zuckerbraun BS. Curr Med Chem. 2007;14:2720–2725. doi: 10.2174/092986707782023181. [DOI] [PubMed] [Google Scholar]
- 5.Motterlini R, Otterbein LE. Nat Rev Drug Discovery. 2010;9:728–743. doi: 10.1038/nrd3228. [DOI] [PubMed] [Google Scholar]
- 6.Wegiel B, Gallo D, Csizmadia E, Harris C, Belcher J, Vercellotti GM, Penacho N, Seth P, Sukhatme V, Ahmed A, Pandolfi PP, Helczynski L, Bjartell A, Persson JL, Otterbien LE. Cancer Res. 2013;73:7009–7021. doi: 10.1158/0008-5472.CAN-13-1075. [DOI] [PMC free article] [PubMed] [Google Scholar]
- 7.Schatzschneider U. Br J Pharmacol. 2015;172:1638–1650. doi: 10.1111/bph.12688. [DOI] [PMC free article] [PubMed] [Google Scholar]
- 8.Garcia-Gallego S, Bernardes GJL. Angew Chem, Int Ed. 2014;53:9712–9721. doi: 10.1002/anie.201311225. [DOI] [PubMed] [Google Scholar]
- 9.Heinemann SH, Hoshi T, Westerhausen M, Schille A. Chem Commun. 2014;50:3644–3660. doi: 10.1039/c3cc49196j. [DOI] [PMC free article] [PubMed] [Google Scholar]
- 10.Mann BE, Motterlini R. Chem Commun. 2007:4197–4208. doi: 10.1039/b704873d. [DOI] [PubMed] [Google Scholar]
- 11.Alberto R, Motterlini R. Dalton Trans. 2007:1651–1660. doi: 10.1039/b701992k. [DOI] [PubMed] [Google Scholar]
- 12.Johnson TR, Mann BE, Clark JE, Foresti R, Green CJ, Motterlini R. Angew Chem, Int Ed. 2003;42:3722–3729. doi: 10.1002/anie.200301634. [DOI] [PubMed] [Google Scholar]
- 13.Gonzalez MA, Mascharak PK. J Inorg Biochem. 2014;133:127–135. doi: 10.1016/j.jinorgbio.2013.10.015. [DOI] [PubMed] [Google Scholar]
- 14.Rimmer RD, Pierri AE, Ford PC. Coord Chem Rev. 2012;256:1509–1519. [Google Scholar]
- 15.Schatzschneider U. Inorg Chim Acta. 2011;374:19–23. [Google Scholar]
- 16.Romao CC, Blatter WS, Seixas JD, Bernardes GJL. Chem Soc Rev. 2012;41:3571–3583. doi: 10.1039/c2cs15317c. [DOI] [PubMed] [Google Scholar]
- 17.Carrington SJ, Chakraborty I, Bernard JML, Mascharak PK. ACS Med Chem Lett. 2014;5:1324–1328. doi: 10.1021/ml500399r. [DOI] [PMC free article] [PubMed] [Google Scholar]
- 18.Carrington SJ, Chakraborty I, Mascharak PK. Chem Commun. 2013:11254–11256. doi: 10.1039/c3cc46558f. [DOI] [PubMed] [Google Scholar]
- 19.Niesel J, Pinto A, PN’Dongo HW, Merz K, Ott I, Gust R, Schatzschneider U. Chem Commun. 2008:1798–1800. doi: 10.1039/b719075a. [DOI] [PubMed] [Google Scholar]
- 20.Chakraborty I, Carrington SJ, Mascharak PK. Acc Chem Res. 2014;47:2603–2611. doi: 10.1021/ar500172f. [DOI] [PubMed] [Google Scholar]
- 21.Chakraborty I, Carrington SJ, Mascharak PK. Chem-MedChem. 2014;9:1266–1274. doi: 10.1002/cmdc.201402007. [DOI] [PubMed] [Google Scholar]
- 22.Jimenez J, Chakraborty I, Mascharak PK. Eur J Inorg Chem. 2015:5021–5026. doi: 10.1002/ejic.201500816. [DOI] [PMC free article] [PubMed] [Google Scholar]
- 23.Wanka L, Iqbal K, Schreiner PR. Chem Rev. 2013;113:3516–3604. doi: 10.1021/cr100264t. [DOI] [PMC free article] [PubMed] [Google Scholar]
- 24.Horvath V, Blanarová O, Svihalkova-Sindleerova L, Soucek K, Hofmanová J, Sova P, Kroutil A, Fedorocko P, Kozubik A. Gynecol Oncol. 2006;102:32–40. doi: 10.1016/j.ygyno.2005.11.016. [DOI] [PubMed] [Google Scholar]
- 25.Vondálová Blanárová O, Jelinková I, Szöor A, Skender B, Soucek K, Horváth V, Vaculová A, Andera L, Sova P, Szöllosi J, Hofmanová J, Vereb G, Kozubík A. Carcinogenesis. 2011;32:42–51. doi: 10.1093/carcin/bgq220. [DOI] [PubMed] [Google Scholar]
- 26.Perrin DD, Armarego WLF. Purification of Laboratory Chemicals. Pergamon Press; 1988. [Google Scholar]
- 27.North ACT, Philips DC, Mathews FS. Acta Crystallogr, Sect A. 1968;24:351–359. [Google Scholar]
- 28.Sheldrick GM. Acta Crystallogr, Sect A: Fundam Crystallogr. 2015;71:3–8. doi: 10.1107/S2053273314026370. [DOI] [PMC free article] [PubMed] [Google Scholar]
- 29.Spek AL. Acta Crystallogr, Sect D: Biol Crystallogr. 2009;65:148–155. doi: 10.1107/S090744490804362X. [DOI] [PMC free article] [PubMed] [Google Scholar]
- 30.Sheldrick GM. Acta Crystallogr, Sect C: Cryst Struct Commun. 2015;71:3–8. doi: 10.1107/S2053229614024218. [DOI] [PMC free article] [PubMed] [Google Scholar]
- 31.Nemukhin AV, Grigorenko BL, Granovsky AA. Moscow Univ Chem Bull. 2004;45:75–102. [Google Scholar]
- 32.Waller MP, Braun H, Hojdis N, Buhl M. J Chem Theory Comput. 2007;3:2234–2242. doi: 10.1021/ct700178y. [DOI] [PubMed] [Google Scholar]
- 33.Alvarez CM, Garcia-Rodriguez R, Miguel D. J Organomet Chem. 2007;692:5717–5726. [Google Scholar]
- 34.Mede R, Klein M, Claus RA, Krieck S, Quickert S, Gorls H, Neugebauer U, Schmitt M, Gessner G, Heinemann SH, Popp J, Bauer M, Westerhausen M. Inorg Chem. 2016;55:104–113. doi: 10.1021/acs.inorgchem.5b01904. [DOI] [PubMed] [Google Scholar]
- 35.Gonzalez MA, Carrington SJ, Fry NL, Martinez JL, Mascharak PK. Inorg Chem. 2012;51:11930–11940. doi: 10.1021/ic3018216. [DOI] [PubMed] [Google Scholar]
- 36.Gonzalez MA, Yim MA, Cheng S, Moyes A, Hobbs AJ, Mascharak PK. Inorg Chem. 2012;51:601–608. doi: 10.1021/ic2021287. [DOI] [PubMed] [Google Scholar]
- 37.McLean S, Mann BE, Poole RK. Anal Biochem. 2012;427:36–40. doi: 10.1016/j.ab.2012.04.026. [DOI] [PubMed] [Google Scholar]
- 38.Murray BS, Babak MV, Hartinger CG, Dyson PJ. Coord Chem Rev. 2016;306:86–114. [Google Scholar]
- 39.Babak MV, Meier SM, Huber KVM, Reynisson J, Legin AA, Jakupec MA, Roller A, Stukalov A, Gridling M, Bennett KL, Colinge J, Berger W, Dyson PJ, Superti-Furga G, Keppler BK, Hartinger CG. Chem Sci. 2015;6:2449–2456. doi: 10.1039/c4sc03905j. [DOI] [PMC free article] [PubMed] [Google Scholar]
- 40.Kilpin KJ, Cammack SM, Clavel CM, Dyson PJ. Dalton Trans. 2013;42:2008–2014. doi: 10.1039/c2dt32333h. [DOI] [PubMed] [Google Scholar]
- 41.Pfeiffer H, Rojas A, Niesel J, Schatzschneider U. Dalton Trans. 2009:4292–4298. doi: 10.1039/b819091g. [DOI] [PubMed] [Google Scholar]
- 42.Zobi F, Blacque O, Jacobs RA, Schaub MC, Bogdanova AY. Dalton Trans. 2012;41:370–378. doi: 10.1039/c1dt10649j. [DOI] [PubMed] [Google Scholar]
- 43.Santoro G, Beltrami R, Kottelat E, Blacque O, Bogdanova AY, Zobi F. Dalton Trans. 2016;45:1504–1513. doi: 10.1039/c5dt03402g. [DOI] [PubMed] [Google Scholar]
Associated Data
This section collects any data citations, data availability statements, or supplementary materials included in this article.


