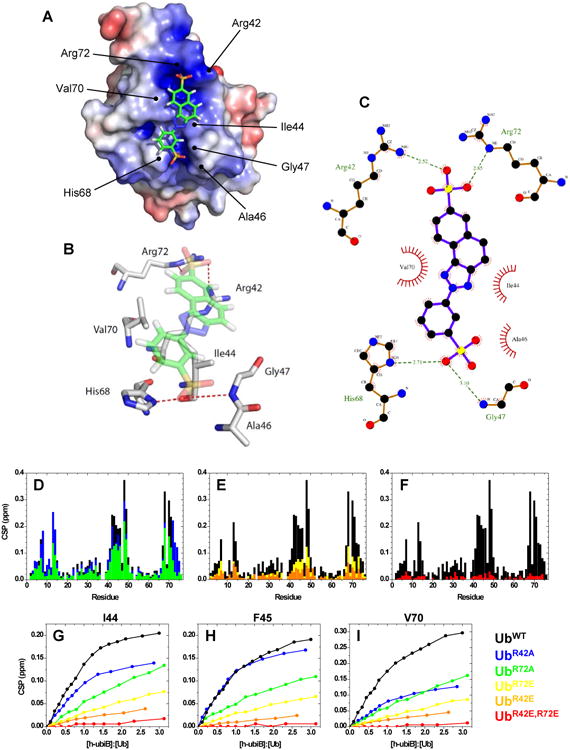
Figure 3.

Structure of the Ub:h-ubiB complex. (A) Ub is represented by its electrostatic surface, (equipotential contours from -3kT/e to +3kT/e, positive potential is painted blue and negative is red), while h-ubiB is shown in stick representation. Key Ub residues involved in the interaction are labeled. (B) 3D representation of the contacts between h-ubiB and the interacting groups in Ub. Red dashed lines represent hydrogen bonds. (C) LIGPLOT representation of the hydrophobic contacts (red spoked arcs) and hydrogen bonds (green dashed lines) between h-ubiB and Ub. (D-I) Validation of the structure of Ub:h-ubiB complex by site-directed mutagenesis. Residue-specific CSPs from titration with h-ubiB of UbWT (black) and (D) single-Ala mutants, UbR42A (green) and UbR72A (blue), (E) single-Glu mutants, UbR42E (yellow) and UbR72E (orange), and (F) double-Glu mutant, UbR42E,R72E, red. Representative titration curves for Ub residues (G) I44, (H) F45, and (I) V70, colored according to the indicated mutants. See also Figs S4-S6 and Tables S3, S4.
