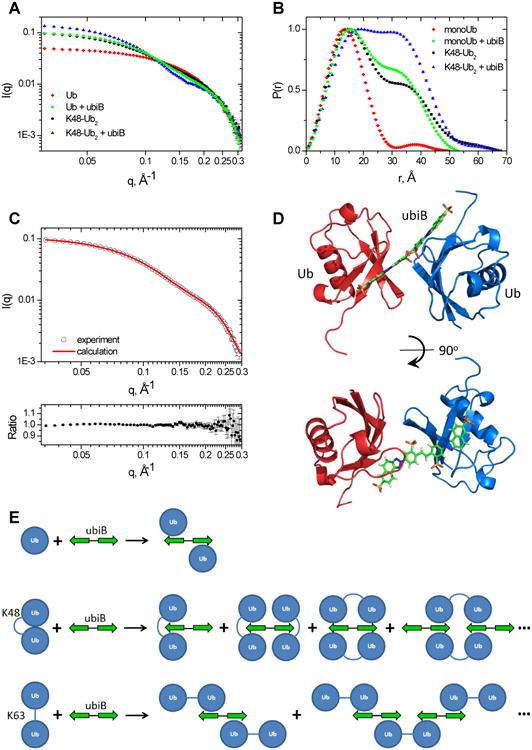
Figure 5.

Characterization of the complexes of Ub and K48-Ub2 with ubiB using SANS. (A) SANS intensity and (B) pair distribution function for Ub or K48-Ub2 alone and in the presence of an equimolar amount of ubiB. (C) Agreement between the experimental SANS intensity (I(q)exp, open circles) and the I(q)calc calculated for the structure shown in (D). Top: overlay of the I(q) values; bottom: the ratio of I(q)exp to I(q)calc. The error bars in (A) and (C) represent standard errors in the experimental I(q) values, and in (B) standard errors in the derived P(r). (D) Structural model of the Ub:ubiB:Ub complex obtained by rigid-body docking. Ubs are shown as ribbons colored blue and red, ubiB is in stick representation. (E) Schematic illustration of the Ub:ubiB:Ub complex and possible structural arrangements of K48-Ub2 and K63-Ub2 in complex with ubiB, see also Figs S8-S9.
