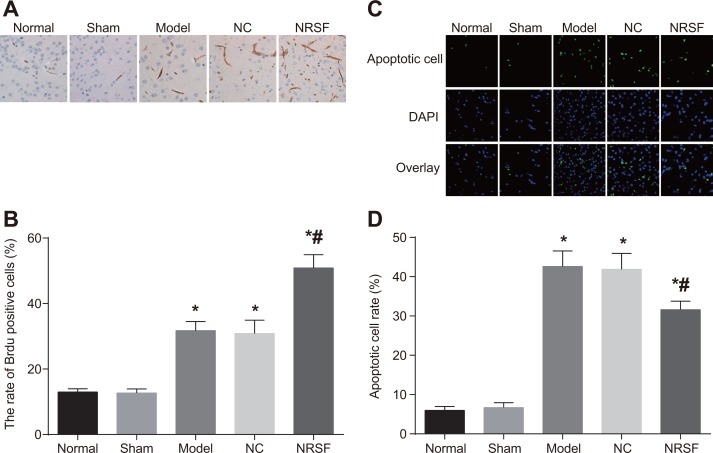
Figure 3.
BrdU-positive cell morphology (A), BrdU-positive cell rates (B), numbers of apoptotic nerve cells (C), and histogram of apoptosis rate (D) for brain tissues from each group. *P < 0.05 compared to the normal group; #P < 0.05 compared to the model group; NC, negative control; NRSF, neuron-restrictive silencer factor.

