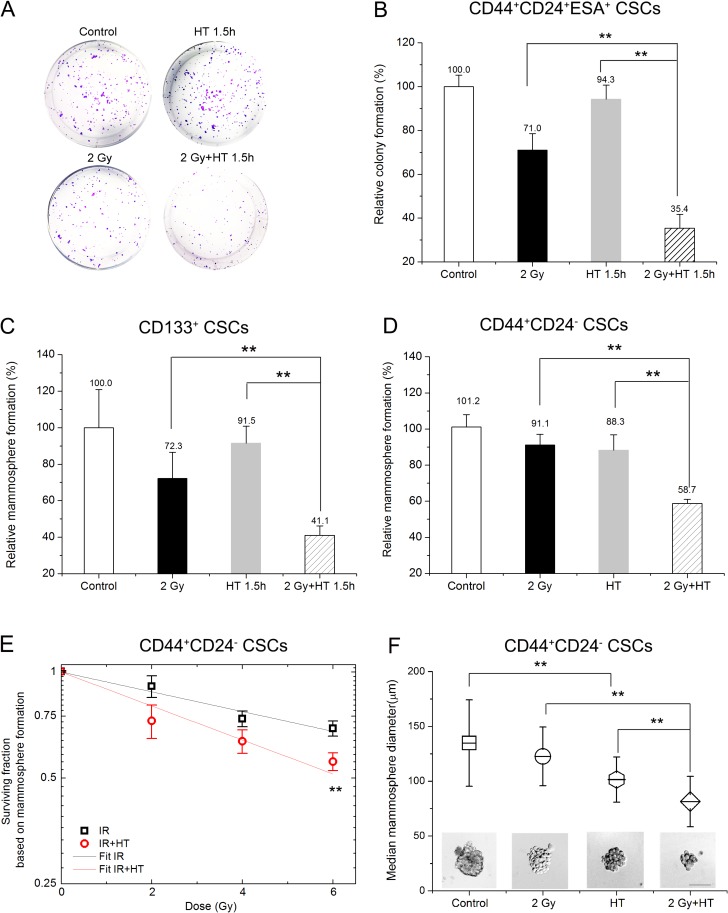
Figure 3. Hyperthermia sensitized breast CSCs and pancreatic CSCs to radiation.
(A–B) Representative images of colonies derived from CD44+CD24+ESA+ CSCs after sham-treated, HT (43°C for 1.5 hours), 2 Gy or 2 Gy+HT treatment (A) and quantification of colonies (B). (C) Quantification of mammospheres derived from CD133+ CSCs at day 7 after sham-treated, HT (43°C for 1.5 hours), 2 Gy or 2 Gy+HT treatment. (D) Statistics in mammosphere formations derived from CD44+CD24- CSCs at day 7 after sham-treated, HT (43°C for 2 hours), 2 Gy or 2 Gy+HT treatment. (E) The mammosphere survival of CSCs after IR alone (squares) or IR+HT (circles) treatments. The dose-response curve of IR alone (black line) or IR+HT (red line) was fitted using the linear part of LQ model. (F) Representative images of mammosphere derived from CD44+CD24- CSCs after different treatments. Bar = 100 μm (bottom) and mean values for mammosphere diameters of the indicated treatment groups. At least 40 mammospheres were measured in each group. The results are presented as the mean ± SD, as determined from three independent experiments. *P < 0.05, **P < 0.01.

