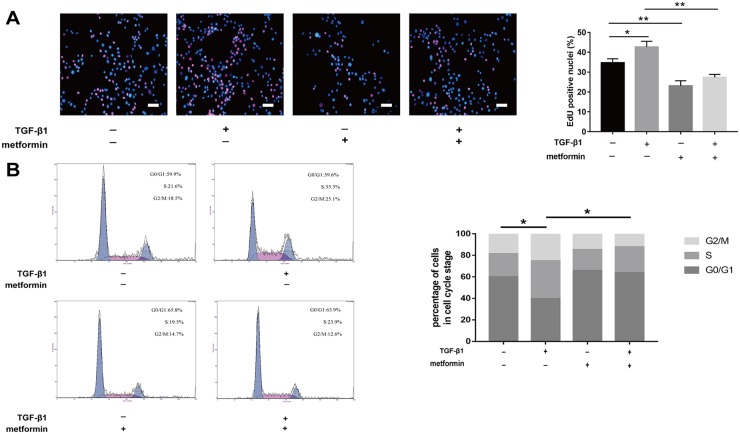
Figure 4. Metformin inhibited fibroblast proliferation in vitro.
(A) EdU staining was used to detect proliferative fibroblasts (red). Metformin markedly reduced the percentage of proliferative cells. (B) fibroblasts were treated as indicated for 48h and analyzed by flow cytometry to estimate the distribution of fibroblasts in each phase of the cell cycle. TGF-β1 treatment significantly increased S and G2/M phase cells, whereas metformin attenuated the transition. The histogram represents the percentage of cells in each cell cycle phase. Data are expressed as means ± SEM. * P < 0.05; ** P < 0.01.

