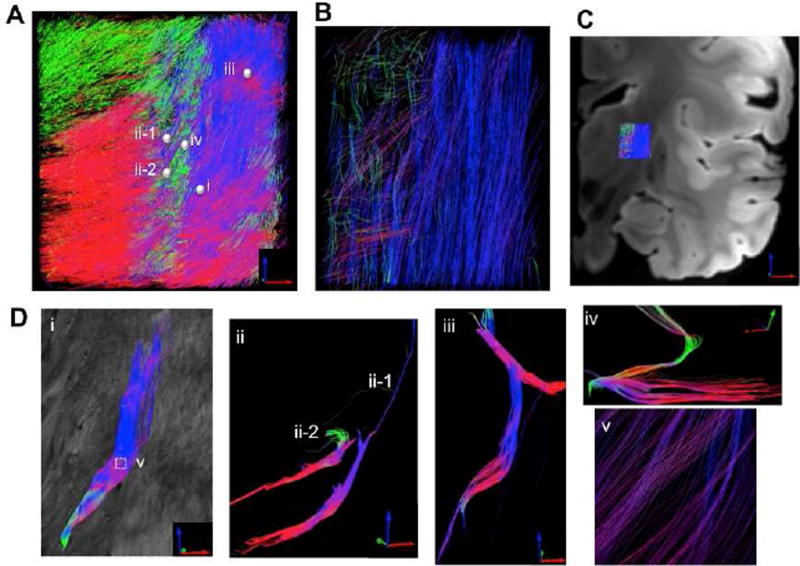
Fig. 10.
as-PSOCT 3D tractography with 30 µm resolution (A) compared with registered dMRI tractography at 750 µm resolution (B). C) The location where tractography is applied in the brain is indicated on the anatomical MRI image. D) i – iv demonstrate various fiber trajectories revealed by as-PSOCT that are not resolvable with dMRI. The tracts are created by the seeds (spheres i, ii-1, ii-2, iii, and iv) selected on (A). v shows the zoom-in view of fiber crossing on ROI-i.

